4670
BRAIN FUNCTIONAL CHANGES CORRELATE WITH COGNITIVE DYSFUNCTION IN FRIEDREICH'S ATAXIA: AN RS-fMRI STUDYSirio Cocozza1, Teresa Costabile2, Enrico Tedeschi1, Filomena Abate2, Camilla Russo1, Agnese Liguori2, Walter Del Vecchio3, Francesca Paciello2, Mario Quarantelli3, Alessandro Filla2, Francesco Saccà2, and Arturo Brunetti1
1Department of Advanced Biomedical Sciences, University of Naples "Federico II", Naples, Italy, 2University of Naples "Federico II", Naples, Italy, 3Institute of Biostructure and Bioimaging, National Research Council, Naples, Italy
Synopsis
We performed a seed-based Resting-State fMRI analysis in Friedreich’s Ataxia (FRDA) patients to assess possible brain functional connectivity (FC) changes in these patients, which are know to be charactherized by an impairment of neuropsychological functions. We found an increased FC in FRDA patients compared to controls in different brain regions, including the medial frontal gryrus, the angular gyri and cingulate gyrus, with a decreased cerebellar FC. Our findings of diffuse alterations of FC in FRDA patients compared to controls may shed new light on the pattern of supratentorial and infratentorial involvement and on dynamics of brain plasticity in this condition.
Introduction
Along with the progressive motor disability, impairment of neuropsychological functions, affecting different domains, has been described in Friedreich’s Ataxia (FRDA) patients. In particular, among non-motor symptoms, depressive mood and a variable impairment in visuospatial abilities, information processing speed and executive functions (with specific reference to long-term working memory) have been recently described 1. Aim of our study was to perform the first resting-state functional MRI (RS-fMRI) analysis in FRDA patients to assess possible brain functional connectivity (FC) changes in these patients, and test their correlations with neuropsychological performances.Methods
Twenty-four FRDA patients (M/F:15/9, mean age 31.3±15.0) and twenty-four healthy controls (HC; M/F:15/9, mean age 30.7±15.5) were enrolled in this cross-sectional study. All patients underwent a thorough neuropsychological battery, investigating different cognitive domains. MRI data were acquired on a 3 Tesla MR scanner (Trio, Siemens Medical Systems, Erlangen, Germany). Functional data were processed using the functional connectivity toolbox (CONN, v. 16.a, http://www.nitrc.org/projects/conn), which contains libraries for fMRI analysis based on the Statistical Parametric Mapping (SPM8) software package (http://www.fil.ion.ucl.ac.uk/spm). Briefly, pre-processing steps included the removal of the first five time points, to allow for instability of the initial MRI signal, leaving 195 time points, followed by the motion and slice timing correction, the temporal despiking by means of an hyperbolic tangent squashing function to limit outlier values, band-pass filtering (0.008 Hz<f<0.09 Hz), and spatial smoothing (using a 6-mm Full-Width at Half Maximum Gaussian kernel). Studies with a mean relative root-mean-square (RMS) of the translation parameters at each time point of 0.2 or higher (according to 2), or with more than 2.0mm displacement along or 2.0 degrees rotation around any of the three main axes, were discarded from the analysis. For each subject, BOLD signal time course was calculated over 39 different cortical regions (defined in the Harvard-Oxford atlas 4), chosen because potentially referable to specific executive and cognitive functions that may be compromised in FRDA patients 1. Corresponding correlation maps of the BOLD signal across the brain were then generated for each patient. Correlation between RS-fMRI data and neuropsychological variables was tested by nonparametric correlation analysis by using the Spearman’s coefficient.Results
Compared to HC, FRDA patients showed overall worse neuropsychological scores in several domains, including global cognitive assessment, clear-thinking ability and non-verbal assessment of intelligence, spatial and verbal memory, visuo-perception and visuo-spatial functions, and executive functions. Analysis of RS-fMRI data showed an increased FC in FRDA patients compared to HC between paracingulate gyri and the medial frontal gryrus, between the superior frontal gyrus and bilateral angular gyri and between the middle temporal gyrus and the cingulate gyrus, with a decreased FC between the medial frontal gryrus and cerebellum (Figure 1).Discussion
Only few fMRI studies have been performed to investigate possible functional changes in FRDA patients. These studies have proved the presence of an abnormal activation pattern during motor and behavioural tasks in FRDA patients 3-7. In particular, during behavioural stimuli and verbal fluency performance FRDA patients showed a reduced prefrontal and parietal activation compared to HC, with a mixed activity pattern involving the Broca Area, prefrontal, cingulate and premotor cortices during behavioural stimuli and verbal fluency performance 5-7. Taken togheter, this findings are in line with our results showing a decreased cerebello-cerebral coupled to an increased cerebro-cerebral FC in FRDA patients, confirming the occurence of these alteration in this condition 6-7. It is presumable that in FRDA, because of the disruption of cerebello-cerebral circuits involved in cognition, different mechanisms of neuroplasticity could lead to a gradual adaptation of supratentorial cortex. Indeed, beside the reduced FC between left cerebellum and contralateral medial frontal gyrus, the increased connectivity between superior and medial frontal gyri with other associative cortical areas above-described could be interpreted as a possible compensatory mechanism to the structural basis of this condition.Conclusion
In FRDA patients, widespread alterations of FC are present compared to HC. In particular, the observed reduction in FC between medial frontal gyrus and the contralateral cerebellar cortex reflects the presence of alterations in cerebello-cortical pathway, in line with the clinical degeneration of the cognitive circuits of the disease. On the other hand, the increase in FC between different cortical areas, such as the paracingulate gyri or superior and medial frontal gyri could speculatively reflect a compensatory activation of associative areas in response to the deterioration of portion of the physiological cerebello-cortical routes of connection. These results, in conjunction with clinical findings and neurofunctional tests, may shed new light on the pattern of supratentorial and infratentorial involvement and on dynamics of brain plasticity in FRDA.Acknowledgements
No acknowledgement found.References
1. Nieto A, Correia R, de Nobrega E, et al. (2012) Cognition in Friedreich ataxia. Cerebellum 11 (4):834-844. doi:10.1007/s12311-012-0363-9 2. Van Dijk KR, Sabuncu MR, Buckner RL (2012) The influence of head motion on intrinsic functional connectivity MRI. Neuroimage 59 (1):431-438. doi:S1053-8119(11)00821-4 [pii] 10.1016/j.neuroimage.2011.07.044 3. Akhlaghi H, Corben L, Georgiou-Karistianis N, et al. (2012) A functional MRI study of motor dysfunction in Friedreich's ataxia. Brain Res 1471:138-154. doi:S0006-8993(12)01110-9 [pii] 10.1016/j.brainres.2012.06.035 4. Ginestroni A, Diciotti S, Cecchi P, et al. (2012) Neurodegeneration in friedreich's ataxia is associated with a mixed activation pattern of the brain. A fMRI study. Hum Brain Mapp 33 (8):1780-1791. doi:10.1002/hbm.21319 5. Georgiou-Karistianis N, Akhlaghi H, Corben LA, et al. (2012) Decreased functional brain activation in Friedreich ataxia using the Simon effect task. Brain Cogn 79 (3):200-208. doi:S0278-2626(12)00034-6 6. Dogan I, Tinnemann E, Romanzetti S, et al. (2016) Cognition in Friedreich's ataxia: a behavioral and multimodal imaging study. Ann Clin Transl Neurol 3 (8):572-587. doi:10.1002/acn3.315 7. Harding IH, Corben LA, Storey E, et al. (2016) Fronto-cerebellar dysfunction and dysconnectivity underlying cognition in friedreich ataxia: The IMAGE-FRDA study. Hum Brain Mapp 37 (1):338-350. doi:10.1002/hbm.23034Figures
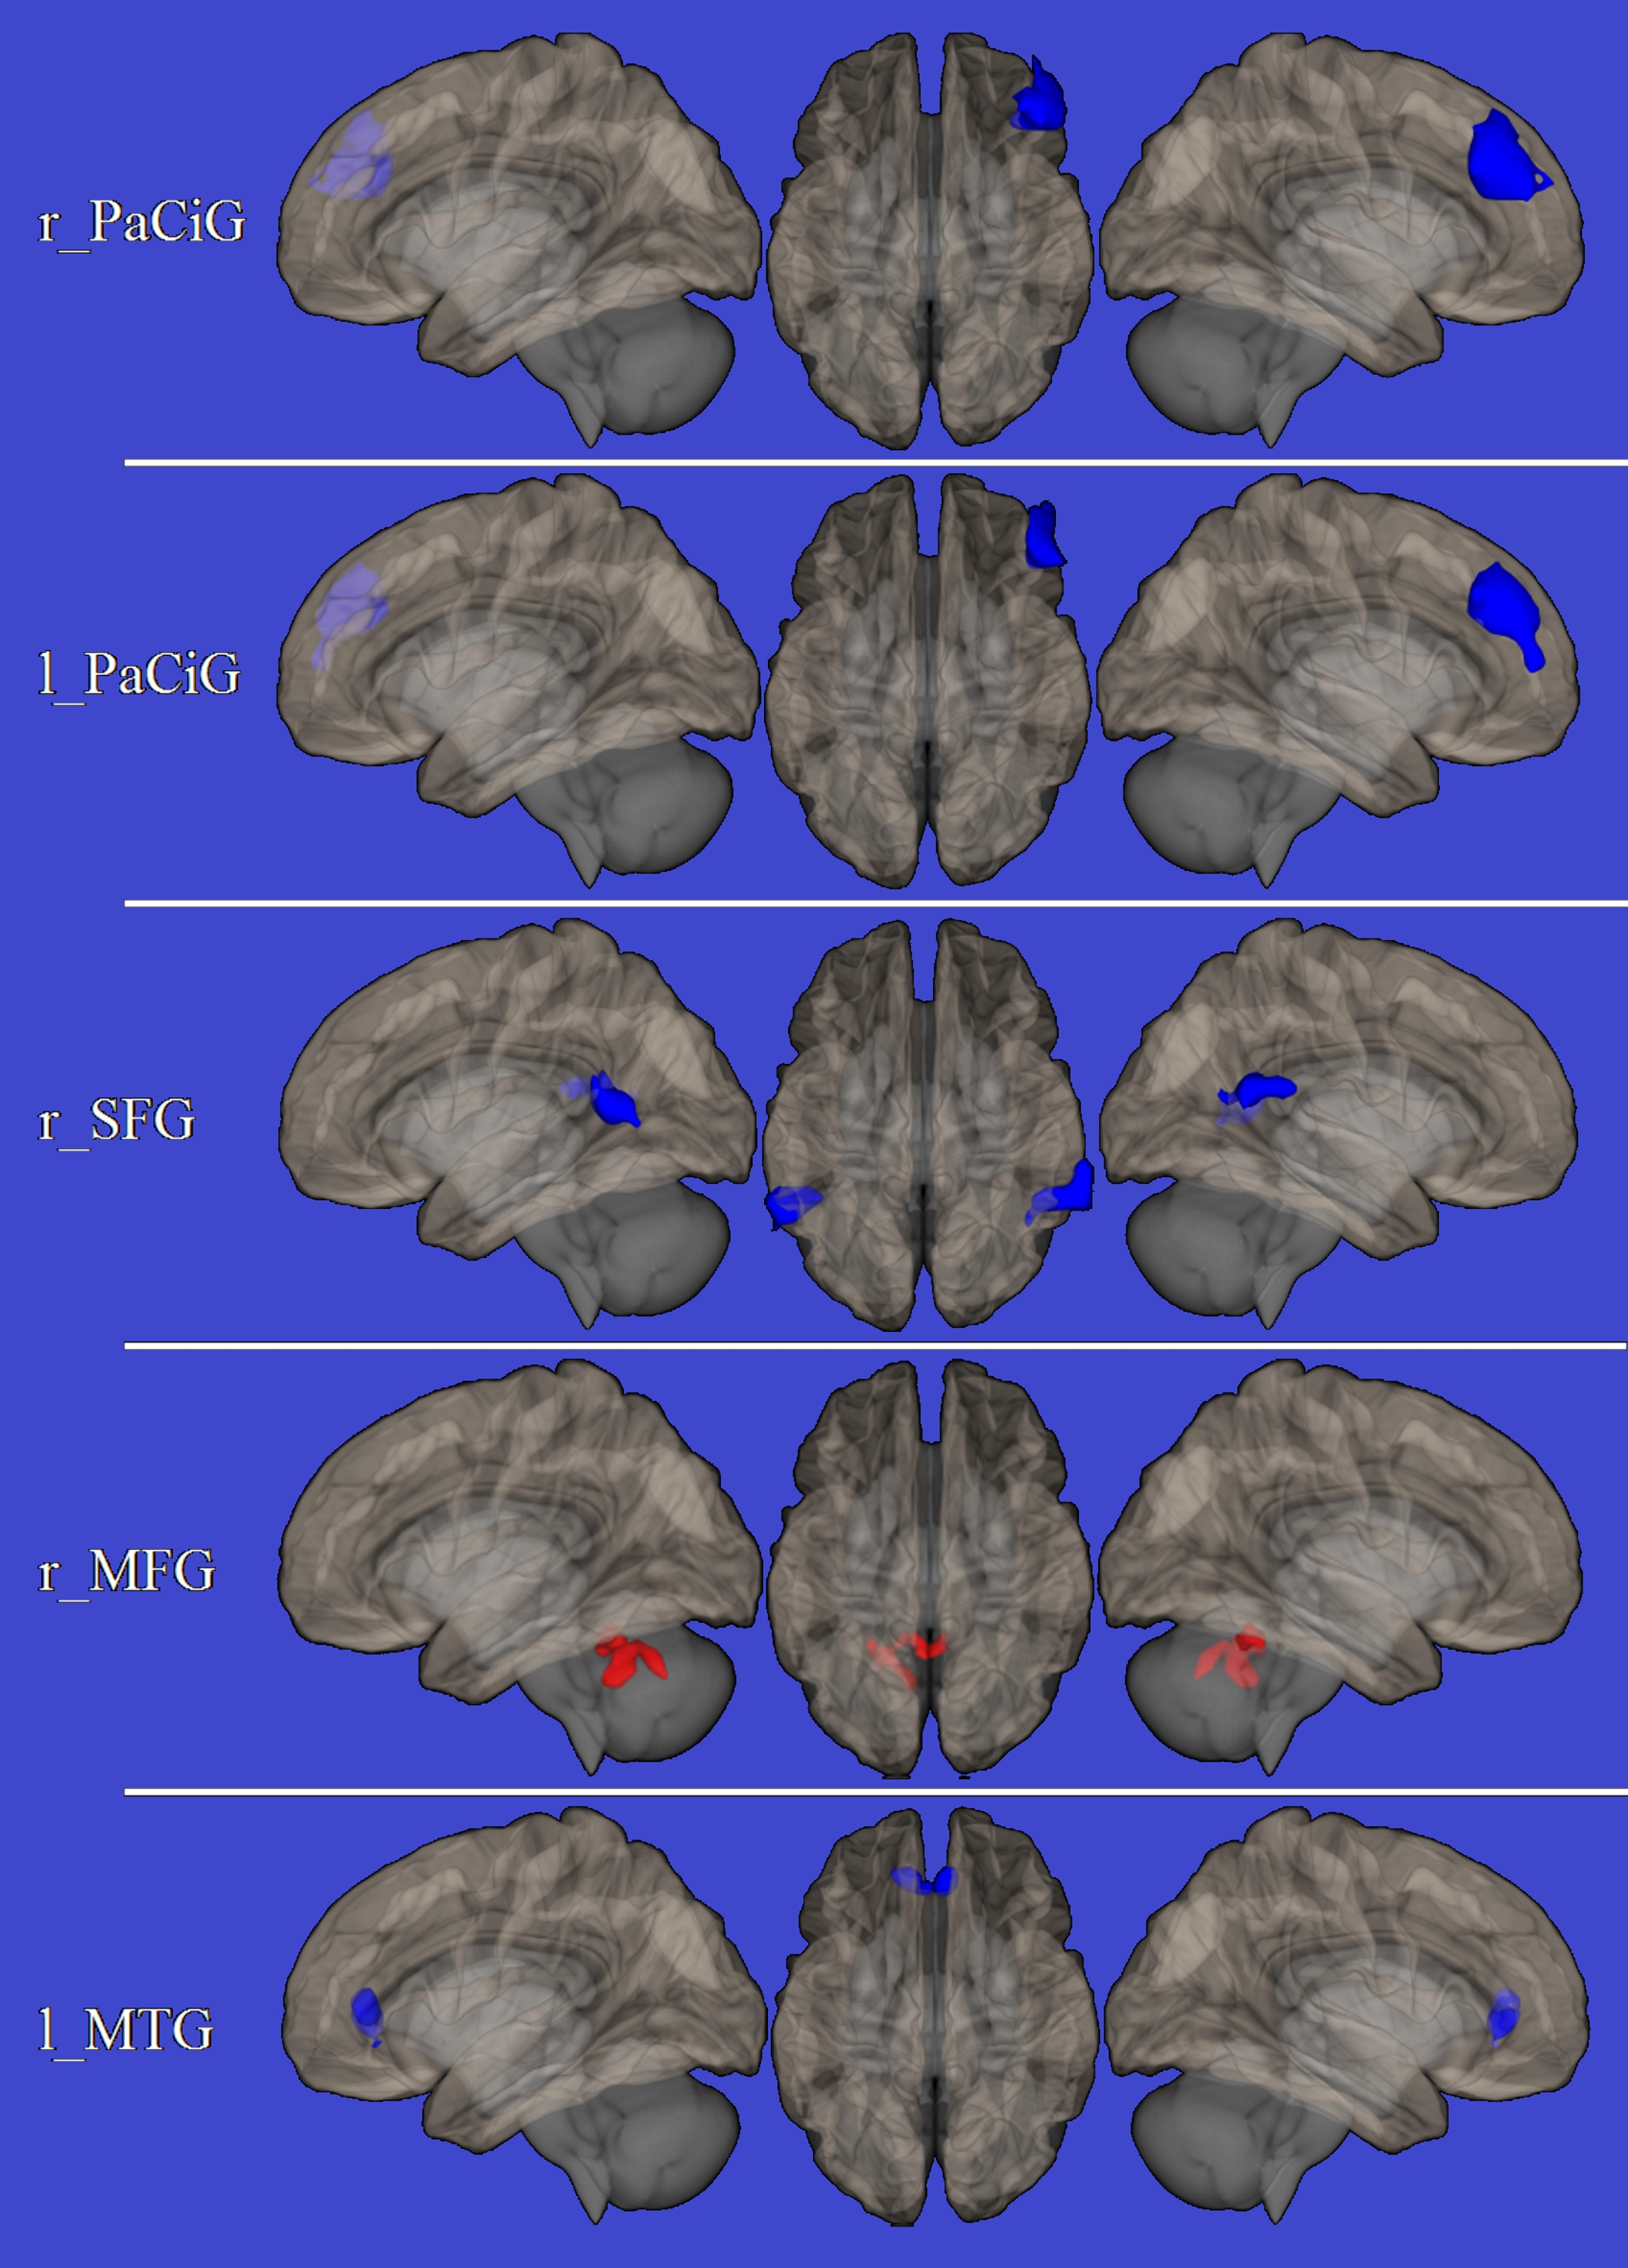
Areas of increased connectivity are shown in blue, areas of
reduced connectivity are shown in red, superimposed on the left lateral (left )
right lateral (right) and upper (central
column) view of the brain surface in the MNI space.
r_PaCiG = right paracingulate gyrus; l_PaCiG = left
paracingulate gyrus; r_SFG = right superior frontal gyrus; r_MFG = right medial
frontal gyrus; l_MTG = left middle temporal gyrus.