4669
Increased functional connectivity in the SOD1(G93A) animal model of Amyotrophic Lateral Sclerosis: a rs-fMRI study at 4.7T1Department of Computer Science, University of Verona, Verona, Italy, 2Department of Neurosciences, Biomedicine and Movement science, University of Verona, Verona, Italy
Synopsis
To date fMRI studies on Amyotrophic Lateral Sclerosis (ALS) patients are still inconsistent. Here, we performed a rs-fMRI study on a pre-clinical model of ALS with the aim to identify biomarkers at functional level, defining an experimental platform useful for the evaluation of disease progression and therapies development. rs-fMRI was performed in SOD1(G93A) and WT mice using a 4.7T tomograph and an EPI sequence. Our results showed increased functional connectivity in SOD1(G93A) mice at the end-stage of disease. In this work, we defined a functional testbed for ALS animal model and demonstrated the feasibility of rs-fMRI in mice at 4.7T.
INTRODUCTION
Amyotrophic lateral sclerosis (ALS) is a fatal neurodegenerative disease that affects the motor system. The heterogeneous nature of ALS makes accurate diagnosis a continuous challenge and therapy is limited to Riluzole, that can prolong the life-span of patients of few months(1). For this reasons, the investigation of biomarkers that could facilitate diagnosis and evaluate the efficacy of therapy is crucial. The SOD1(G93A) animal model is a robust experimental model for ALS and neuroimaging modalities, such as Magnetic Resonance Imaging (MRI), have been used to in-vivo investigation of neurological system degeneration(2). While morphological MRI of brain and spinal cord is the most useful neuroimaging modality in ALS, functional MRI has been recently considered. fMRI studies during motor task have demonstrated that activation of the motor cortex was elevated and spread widely across the motor, premotor and parietal somatosensory cortex(3, 4). Several fMRI studies at rest (rs-fMRI) have revealed functional connectivity abnormalities within the sensorimotor network. Some studies reported reduced functional connectivity in ALS, others increased functional connectivity and others mixed results(5). Such incoherences are due to methodological differences and clinical heterogeneity of patients. In this contest, in-vivo preclinical studies on experimental models of ALS could represent a useful tools to investigate the disease progression, identify therapy targets and validate the efficacy of novel treatments. In this work we report, for the first time, a rs-fMRI study on the SOD1(G93A) animal model. We aimed to identify and validate imaging brain biomarkers at functional level, defining an experimental platform that can be used to evaluate disease progression and support the development of innovative therapies.
METHODS
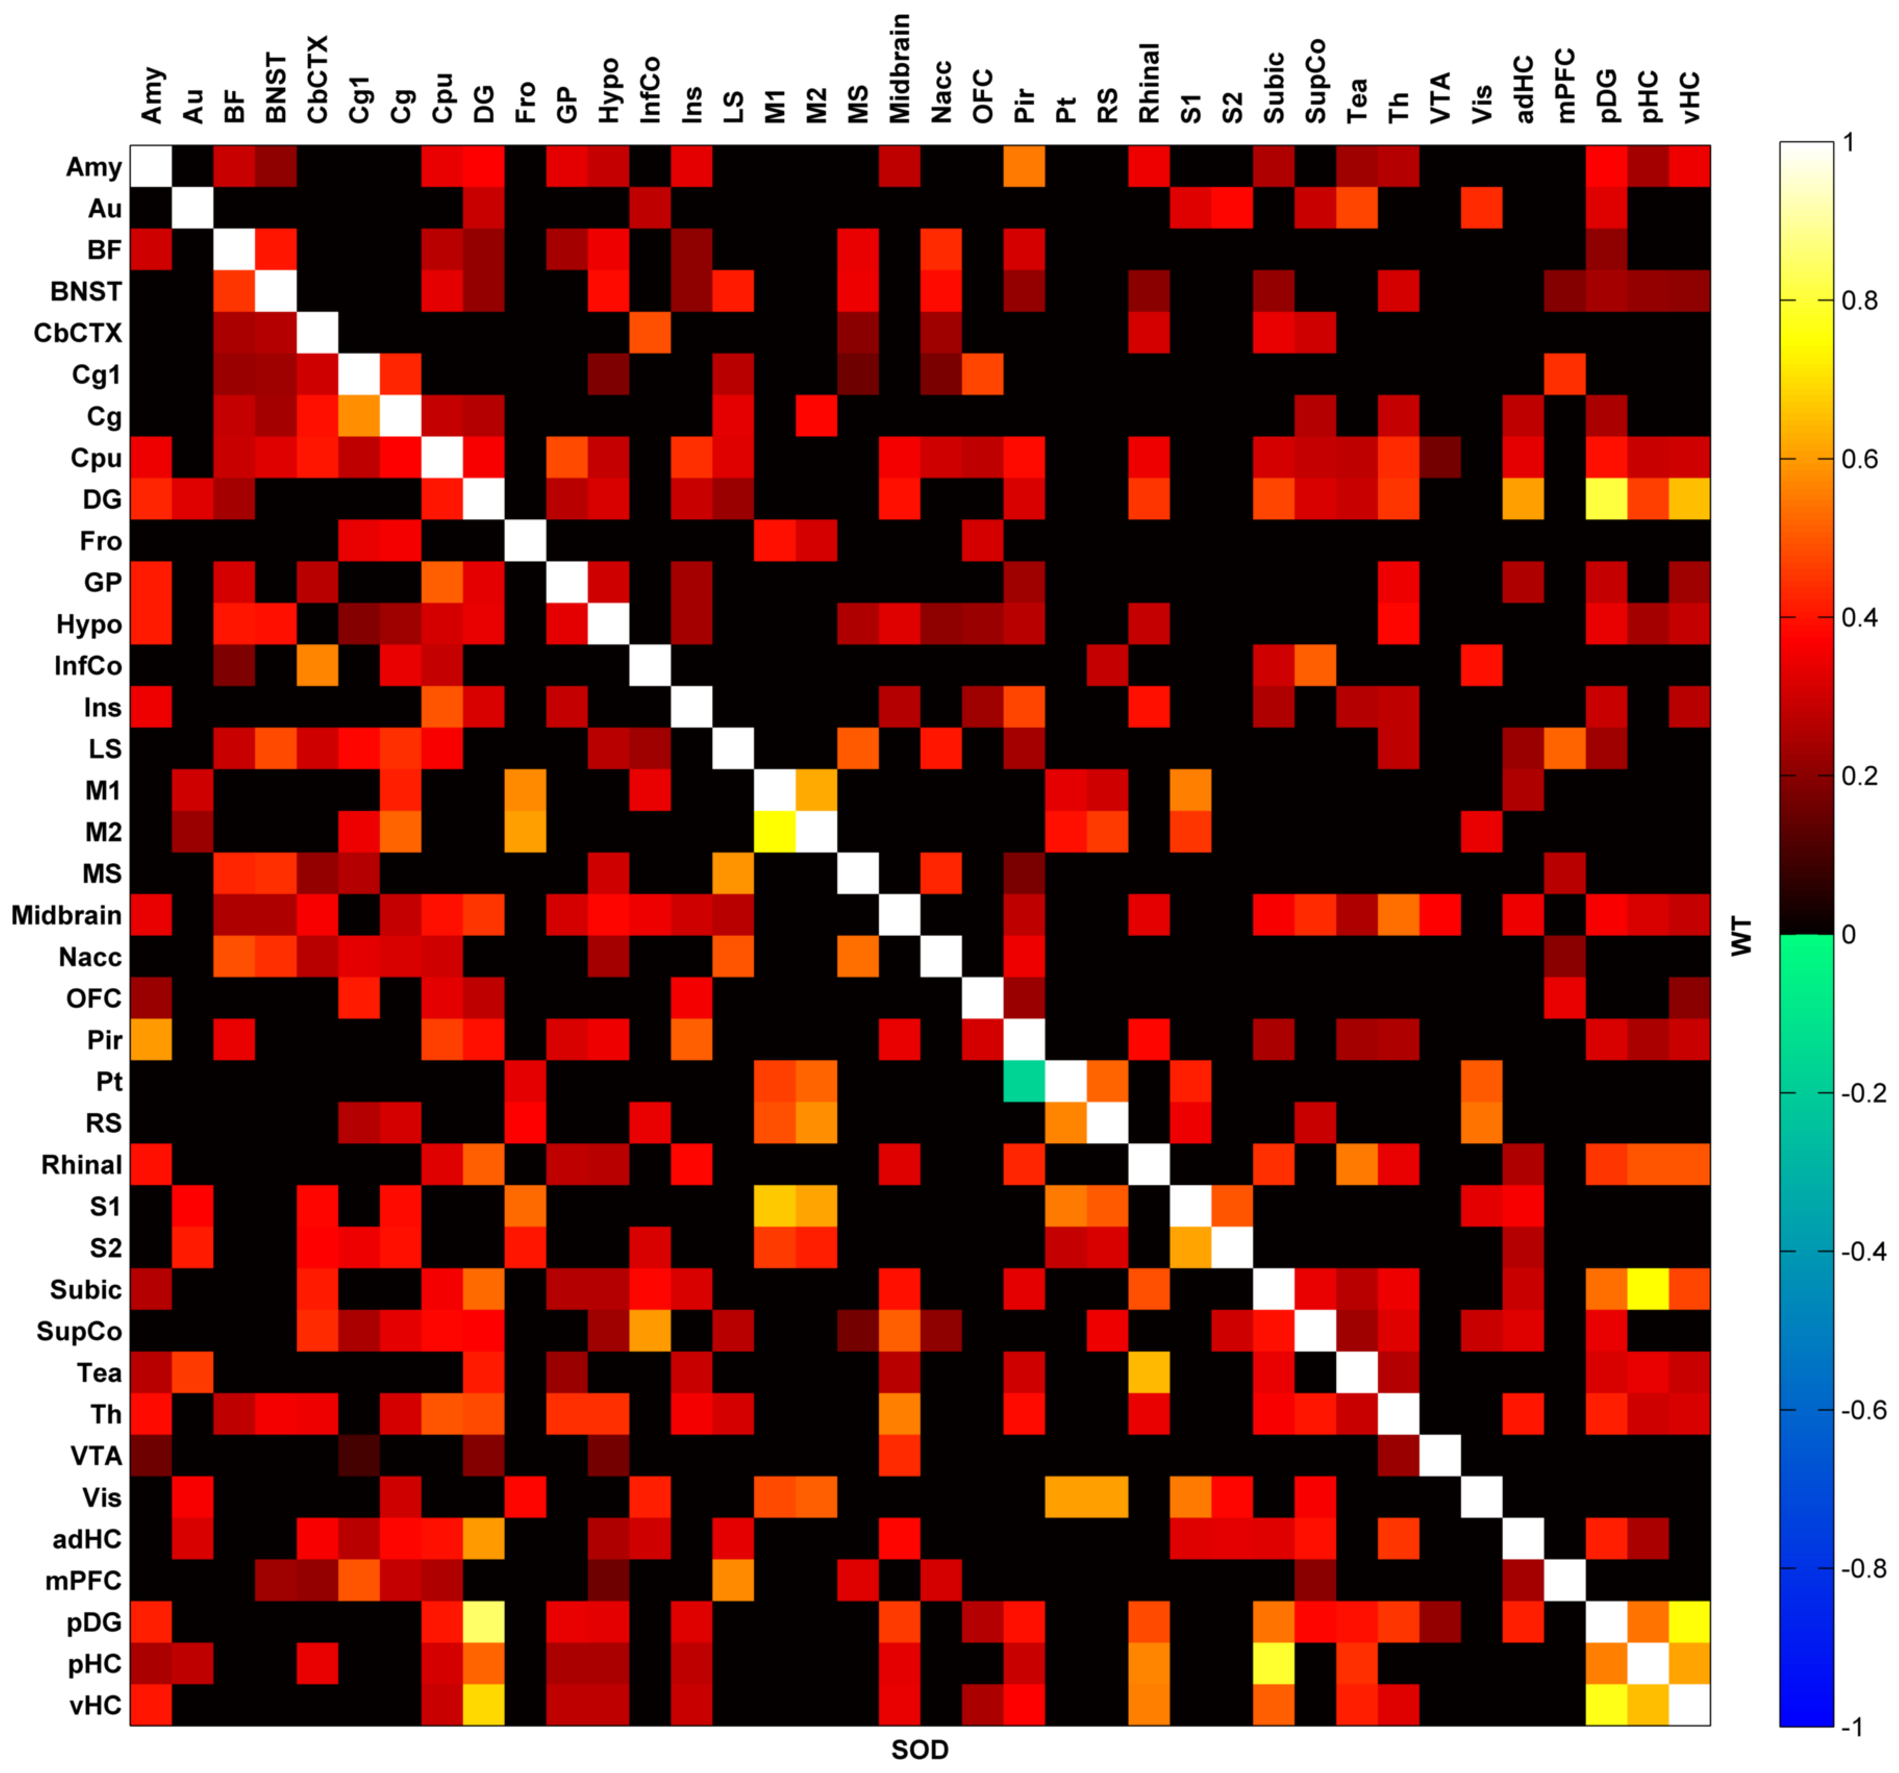
A total of n=20 female mice were used: SOD1(G93A) (n=10) and WT (n=10). rs-fMRI was performed at the onset and at the end-stage of disease. For rs-fMRI experiments animals were anesthetized according to Shah et al. 2016(6) and physiological parameters were monitored. rs-fMR images were acquired with a 4.7T tomograph using an EPI sequence with the following parameters: TR=1200 ms; TE=7.5 ms; flip angle 50°; matrix=64×64, FOV=2.0x2.0 cm2, n°slices=12, 300 volumes, total acquisition time=6 minutes. Processing of rs-fMRI data was performed to identify differences between resting-state brain networks (both MELODIC and the dual regression toolboxes of FSL (7, 8) were used). The pre-processed timeseries fed into Melodic were also used for a region-by-region analysis (brain was parcellated in 38 regions as described in Sforazzini et al. 2014(9)). We evaluated the correlation coefficient for each pair of the regions that were used to parcellate the brain. These correlation coefficients were then tested against the null hypothesis (i.e. mean correlation coefficient equal to zero) using t-test (with False Discovery Rate correction) to reveal Functional Connectivity (FC) strength.
RESULTS
No alterations in connectivity were detected at the onset of the disease. At the end-stage widespread differences in both brain networks identified with Independent Component Analysis (ICA, MELODIC) and in FC strength evaluated on a region-by-region basis were revealed.
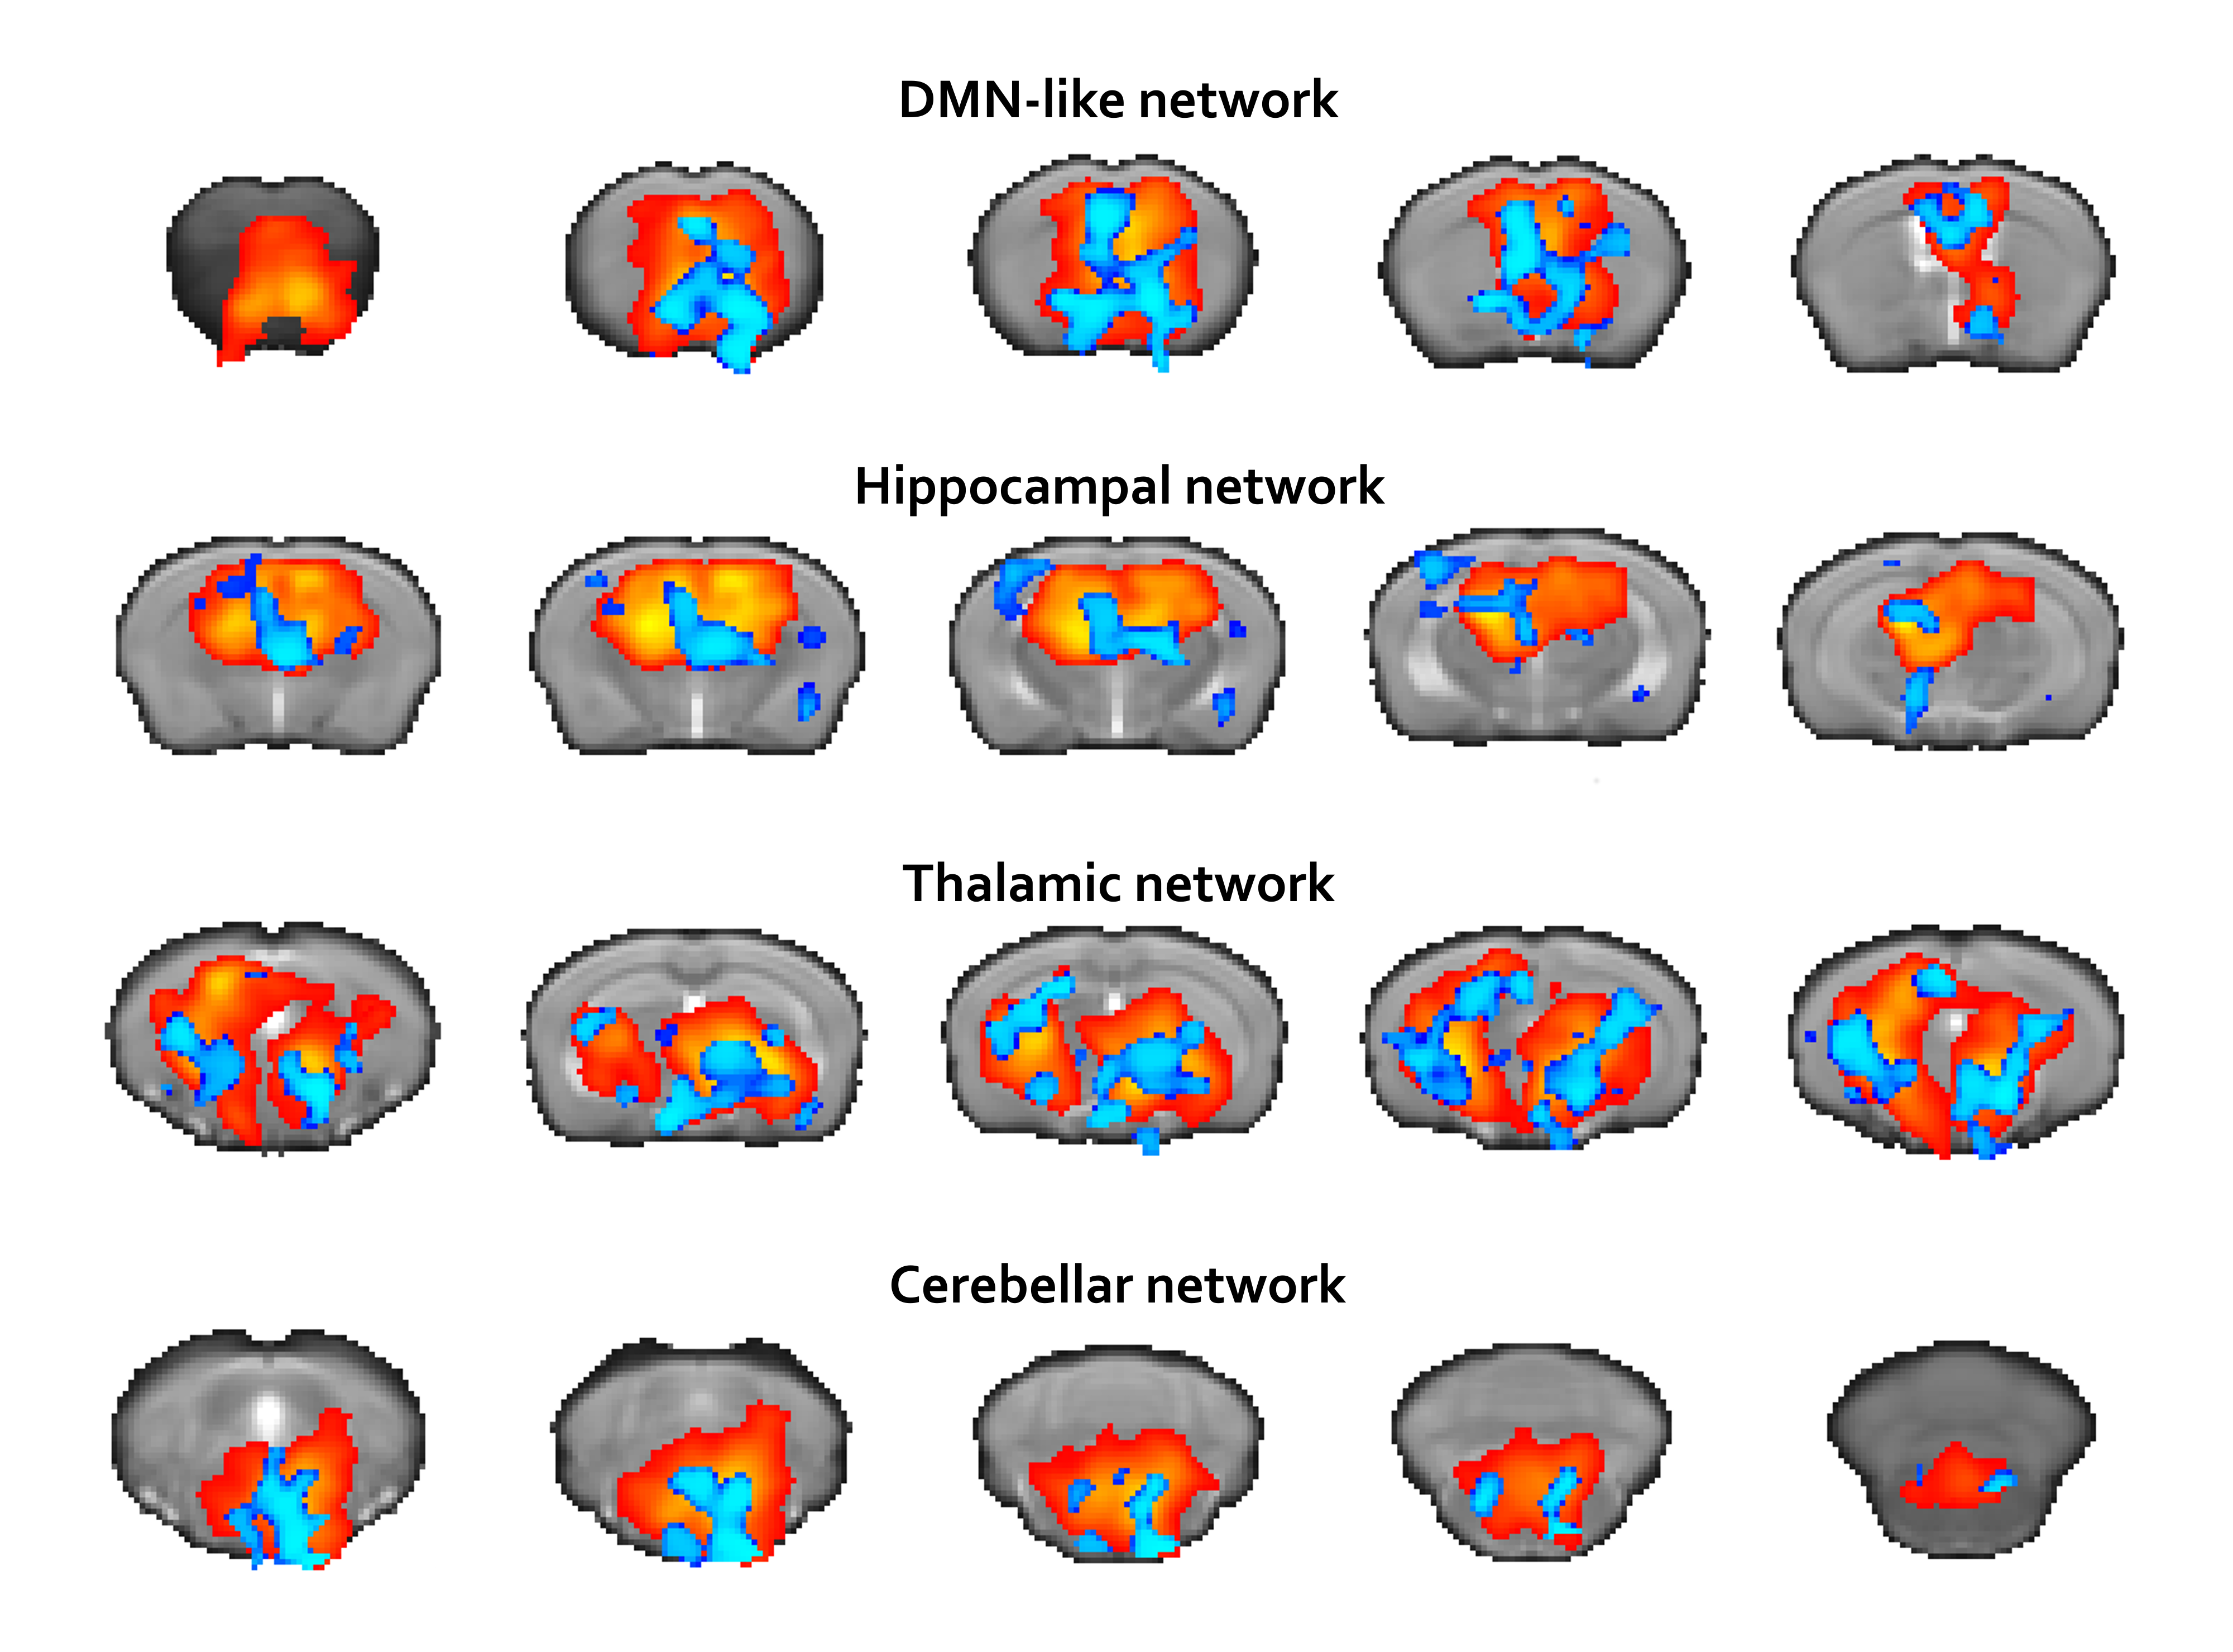
Fig.1 and Fig.2 summarize our findings. Fig.1 shows an increased connectivity (blue regions) in DMN-like, Hippocampal, Thalamic and Cerebellar networks in SOD1(G93A) mice. No areas of reduced connectivity were detected. Fig.2 reports FC strength in SOD1(G93A) (below diagonal) and WT (above diagonal) mice respectively. We identified 279 and 222 region-pairs significantly correlated for the SOD1(G93A) and WT groups respectively (data are corrected for multiple comparisons).
DISCUSSION
rs-fMRI revealed functional connectivity differences between SOD1(G93A) and WT mice. Overall the obtained results point toward an increased FC in the SOD1(G93A) mice that can be interpreted as a compensatory phenomenon. rs-fMRI experiments do not detect group differences at the onset of the disease. However, possible experimental limitations (i.e. 4.7T) may potentially explain these findings. Other experiments performed at higher field could better elucidate these results.
CONCLUSION
Our results showed increased connectivity in SOD1(G93A) mice at the end-stage when compared to WT. At the best of our knowledge, this is the first in vivo rs-fMRI study in an animal model of ALS. Moreover, we demonstrated, for the first time, the feasibility to perform a rs-fMRI study in mice using a magnet operating at 4.7T, a filed strength considered low for preclinical rs-fMRI studies.
Acknowledgements
No acknowledgement found.References
1. Bensimon G, Lacomblez L, Delumeau JC, et al. A study of riluzole in the treatment of advanced stage or elderly patients with amyotrophic lateral sclerosis. J Neurol. 2002;249(5):609-615.
2. Pradat PF, El Mendili MM. Neuroimaging to investigate multisystem involvement and provide biomarkers in amyotrophic lateral sclerosis. Biomed Res Int. 2014;2014:467560.
3. Grolez G, Moreau C, Danel-Brunaud V, et al. The value of magnetic resonance imaging as a biomarker for amyotrophic lateral sclerosis: a systematic review. BMC Neurol. 2016;16(1):155.
4. Mohammadi B, Kollewe K, Samii A, et al. Functional neuroimaging at different disease stages reveals distinct phases of neuroplastic changes in amyotrophic lateral sclerosis. Hum Brain Mapp. 2011;32(5):750-758.
5. Menke RA, Agosta F, Grosskreutz J, et al. Neuroimaging Endpoints in Amyotrophic Lateral Sclerosis. Neurotherapeutics. 2017;14(1):11-23.
6. Shah D, Deleye S, Verhoye M, et al. Resting-state functional MRI and [18F]-FDG PET demonstrate differences in neuronal activity between commonly used mouse strains. Neuroimage. 2016;125:571-577.
7. Beckmann CF, DeLuca M, Devlin JT, et al. Investigations into resting-state connectivity using independent component analysis. Philos Trans R Soc Lond B Biol Sci. 2005;360(1457):1001-1013.
8. Filippini N, MacIntosh BJ, Hough MG, et al. Distinct patterns of brain activity in young carriers of the APOE-epsilon4 allele. Proc Natl Acad Sci U S A. 2009;106(17):7209-7214.
9. Sforazzini F, Schwarz AJ, Galbusera A, et al. Distributed BOLD and CBV-weighted resting-state networks in the mouse brain. Neuroimage. 2014;87:403-415.
Figures