4666
Disease Definition for Schizophrenia by Functional Connectivity using Radiomics Strategy1Department of Radiology, Xijing Hospital, Fourth Military Medical University, Xi'an, China, 2School of Medical Psychology, Fourth Military Medical University, Xi'an, China, 3School of Life Sciences and Technology, Xidian University, Xi'an, China
Synopsis
Specific biomarker reflecting its neurobiological substrates is required for diagnosis and treatment selection of schizophrenia (SZ). We aimed to develop and validate a method of disease definition for SZ by resting-state functional connectivity using radiomics strategy in two data sets. The accuracy was 87.09% for diagnosing SZ patients by applying functional connectivity features, with a validation in the independent replication data set (accuracy = 82.61%). Our findings demonstrate a valid radiomics approach by functional connectivity to diagnose SZ, which is helpful to facilitate objective SZ individualized diagnosis using quantitative and specific functional connectivity biomarker in different sites.
INTRODUCTION
Currently, schizophrenia (SZ) is considered as a heterogeneous clinical syndrome,1 whose clinical practice requests guidance of some objective, quantitative and specific biomarker reflecting its neurobiological substrates for diagnosis and treatment selection.2 Since neuroimaging studies have suggested functional connectivity analysis derived from functional magnetic resonance imaging (fMRI) showing brain dysfunction in SZ resulting from impaired communication of the brain network,3-5 biologically based disease definition for SZ therefore seems to be critical and urgent. However, most routine studies identifying abnormal connections and examining their psychopathological correlates are unable to directly promote the translation of fMRI findings to diagnostic biomarkers for SZ in clinical field. To this end, radiomics is an alternative approach, which has provided insights into several areas of medicine, particularly clinical oncology.6,7 In this study, by means of radiomics approaches, we aimed to develop and validate a method of disease definition for SZ by resting-state functional connectivity in first-episode patients.METHODS
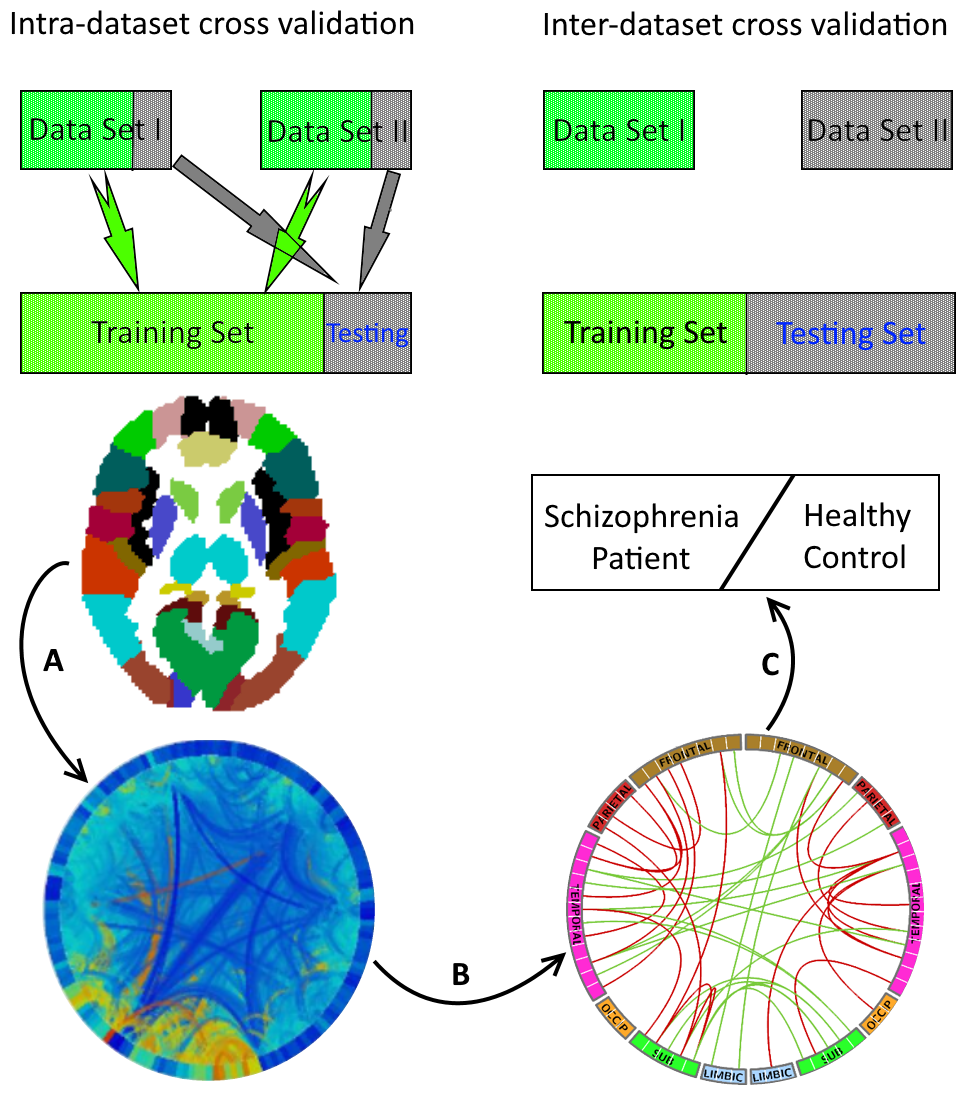
This study included two independent data sets. A total of 108 first-episode SZ patients and 121 HCs participated in the current study, among which 80% patients and HCs (n = 183) and 20% (n = 46) were selected for training and testing in intra-data set validation and one of the two data sets was selected for training and the other for testing in inter-data set validation, respectively (Figure 1). Functional connectivity was calculated for both groups, features were selected by means of Least Absolute Shrinkage and Selection Operator (LASSO) method, and the clinical utility of its features and the generalizability of effects across samples were assessed using machine learning by training and validating multivariate classifiers in the independent samples.RESULTS
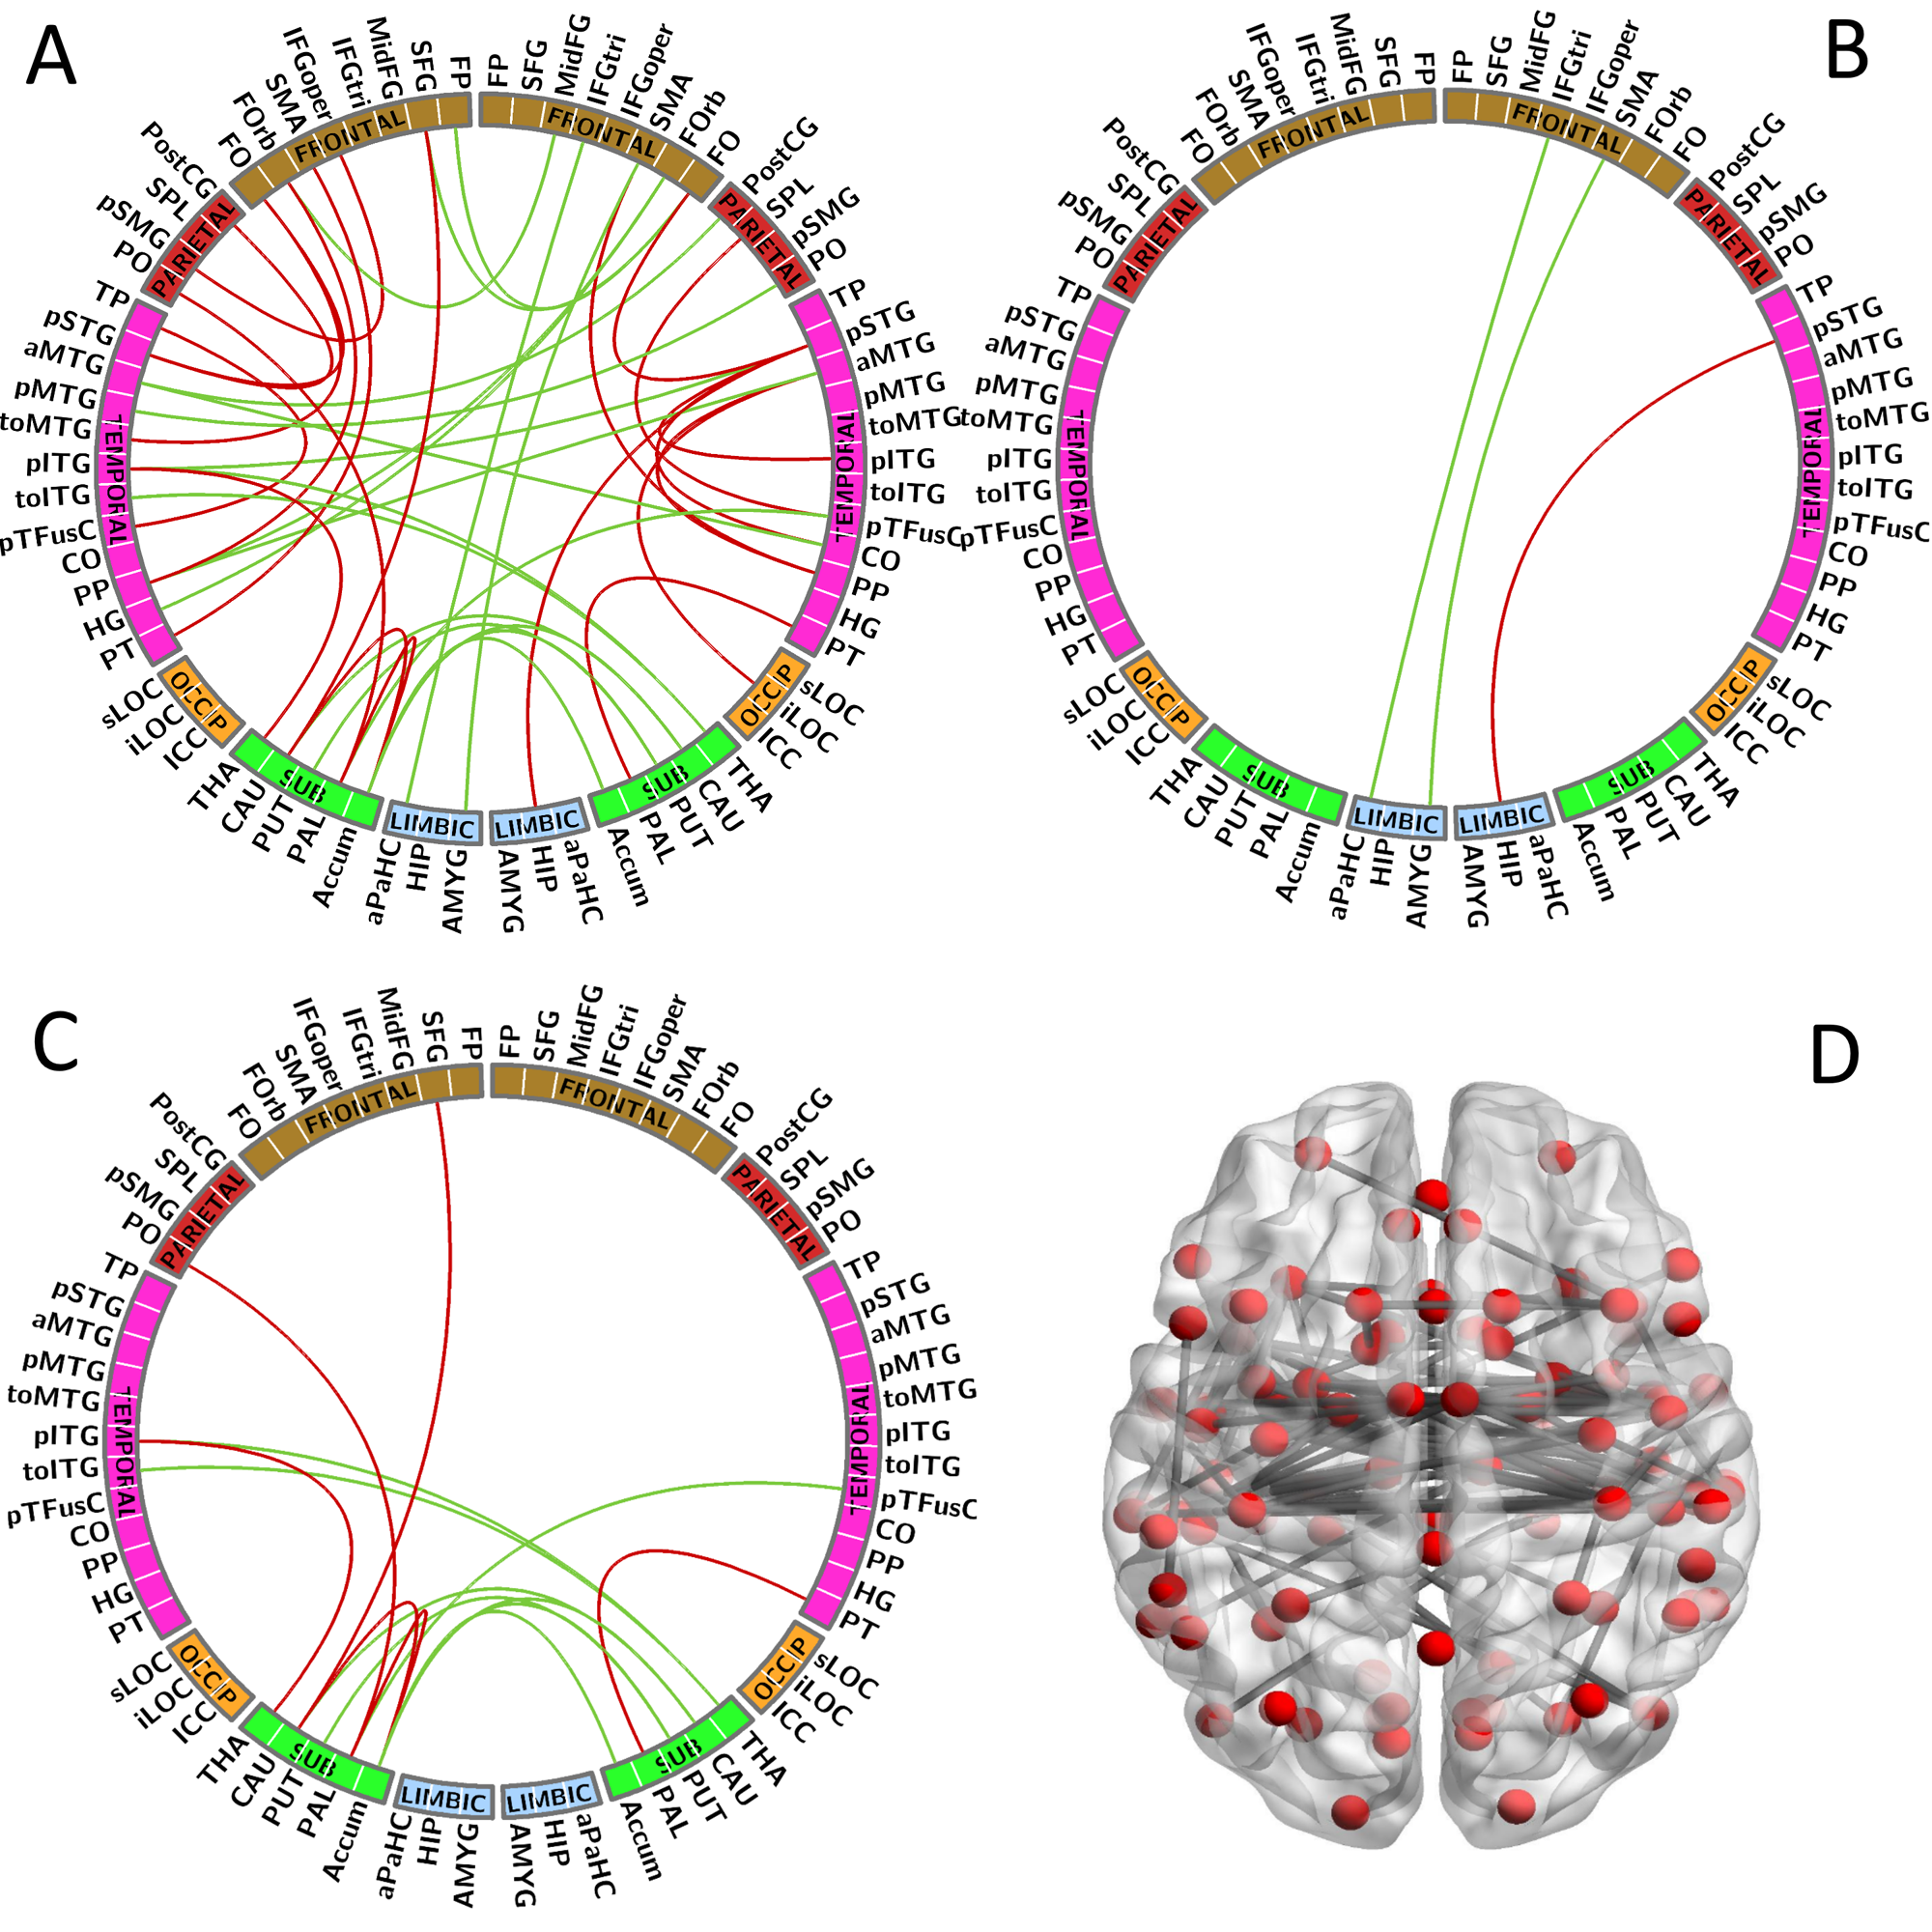
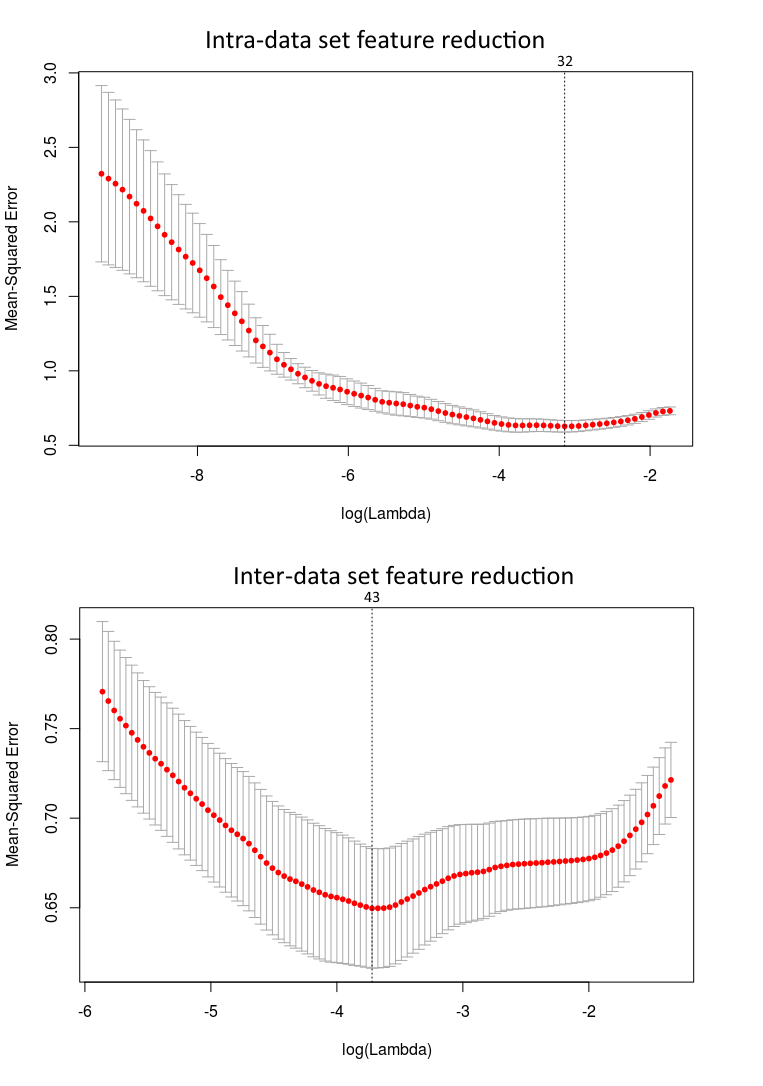
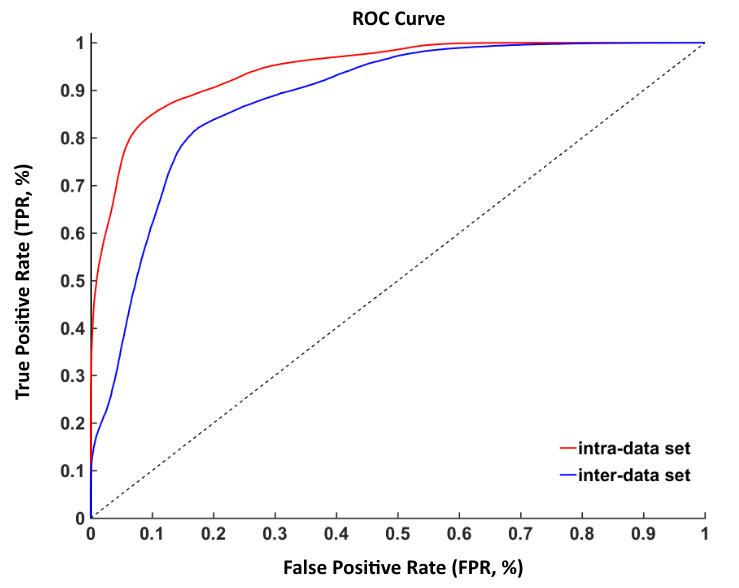
Figure 2 highlights all the 117 functional connectivity features with group differences used from SZ patients and HCs for classification analysis (P < 0.05, uncorrected for multiple comparisons). Of functional connectivity features, in the intra-data set cross validation, 117 features reduced to 32 potential predictors on the basis of 183 subjects in the training data set, and the 32 features were those with nonzero coefficients in the LASSO logistic regression model (Figure 3). In the inter-data set cross validation, 117 features reduced to 43 potential predictors on the basis of 118 subjects in the training data set, and the 43 features were those with nonzero coefficients in the LASSO logistic regression model (Figure 3). In the training of intra-data set, the SVM classifier accurately discriminated SZ patients from HCs on the basis of the ROC curve, with an accuracy of 87.09% (Figure 4). The specificity and sensitivity was 86.79% and 87.22%, respectively. Thus, the prediction accuracy for SZ patients had a significantly higher level than that of chance. The functional connectivity features were further confirmed in the validating data set. In this cohort, the accuracy, specificity and sensitivity were 82.61%, 88.00% and 76.19%, respectively. As for the inter-data set cross validation, accuracy, sensitivity and specificity were 83.15%, 80.79% and 83.63% in training data set; they were 80.07%, 78.65% and 81.33% in testing data set.DISCUSSION
In the current study, we explored whether functional connectivity biomarker define SZ using radiomics strategy. Specifically, the accuracy was 87.09% for the purpose of diagnosing SZ patients by applying functional connectivity features, with a validation in the independent replication data set (accuracy = 82.61%). Our findings are helpful to facilitate objective SZ individualized diagnosis using quantitative and specific biomarker reflecting its neurobiological substrates in different sites. From the perspective of methodology, the newly developed radiomics strategy was used in the present study to push conventional investigation up to a translational level. Clearly, combining training and validating/replication data sets, the diagnostic performance of functional connectivity was proved liable and valid for differentiating individual SZ patients from HCs, yielding the practical value in both psychiatry and radiology. Additionally, the accuracy was from 73.0% to 77.91% in two previous similar studies.8,9 We obtained an accuracy of 87.09% and 82.61% in the training and validating data sets of our study, respectively, an identical level in contrast to a combined static and dynamic functional network connectivity approach showing an overall accuracy of 88.68% in classification of SZ and bipolar disorder patients.10 Our results further increase the diagnostic performance from an accuracy of 78.3% and 77.5% in principal and validating samples by resting-state networks features.11CONCLUSION
These limitations notwithstanding, our findings demonstrate a valid radiomics approach by functional connectivity to diagnose SZ with a high accuracy. The functional connectivity features could be applied in disease definition, which is promising to facilitate the guidance of clinical management for SZ.Acknowledgements
This study was supported by the National Natural Science Foundation of China (81571651) and State Scholarship Fund, China Scholarship Council (201603170143).References
1. Owen MJ, Sawa A, Mortensen PB. Schizophrenia. Lancet. 2016;388:86-97.
2. Tamminga CA, Pearlson GD, Stan AD, et al. Strategies for Advancing Disease Definition Using Biomarkers and Genetics: The Bipolar and Schizophrenia Network for Intermediate Phenotypes. Biol Psychiatry Cogn Neurosci Neuroimaging. 2017;2:20-27.
3. Cui LB, Liu K, Li C, et al. Putamen-related regional and network functional deficits in first-episode schizophrenia with auditory verbal hallucinations. Schizophr Res. 2016;173:13-22.
4. Cui LB, Liu L, Guo F, et al. Disturbed Brain Activity in Resting-State Networks of Patients with First-Episode Schizophrenia with Auditory Verbal Hallucinations: A Cross-sectional Functional MR Imaging Study. Radiology. 2017;283:810-819.
5. van den Heuvel MP, Sporns O, Collin G, et al. Abnormal rich club organization and functional brain dynamics in schizophrenia. JAMA Psychiatry. 2013;70:783-792.
6. Aerts HJ, Velazquez ER, Leijenaar RT, et al. Decoding tumour phenotype by noninvasive imaging using a quantitative radiomics approach. Nat Commun. 2014;5:4006.
7. Huang YQ, Liang CH, He L, et al. Development and Validation of a Radiomics Nomogram for Preoperative Prediction of Lymph Node Metastasis in Colorectal Cancer. J Clin Oncol. 2016;34:2157-2164. Behav Brain Res. 2015;283:78-86.
8. Mikolas P, Melicher T, Skoch A, et al. Connectivity of the anterior insula differentiates participants with first-episode schizophrenia spectrum disorders from controls: a machine-learning study. Psychol Med. 2016;46:2695-2704.
9. Yang H, He H, Zhong J. Multimodal MRI characterisation of schizophrenia: a discriminative analysis. Lancet. 2016;388 Suppl 1:S36.
10. Rashid B, Arbabshirani MR, Damaraju E, et al. Classification of schizophrenia and bipolar patients using static and dynamic resting-state fMRI brain connectivity. Neuroimage. 2016;134:645-657.
11. Skåtun KC, Kaufmann T, Doan NT, et al. Consistent Functional Connectivity Alterations in Schizophrenia Spectrum Disorder: A Multisite Study. Schizophr Bull. 2017;43:914-924.
Figures