4664
Modulation of Perfusion and Functional Connectivity by Intermittent Theta Burst Stimulation1Biomedical Engineering, University of Arizona, Tucson, AZ, United States, 2Psychology, University of Arizona, Tucson, AZ, United States
Synopsis
Transcranial magnetic stimulation produces a noninvasive stimulation that excites or inhibits regions of the brain. Theta burst stimulation(TBS), has been considered the most efficient protocol. The impact of TBS on brain perfusion and intrinsic functional connectivity networks of human brains has not been systematically evaluated. Perfusion values were measured with pCASL and resting state fMRI was performed to compare connectivity networks using seed based analysis and matrix based analysis. Perfusion was measured as increased after iTBS. Analysis of seed based data generated from the left dorsolateral prefrontal cortex showed connectivity network changes before and after TBS.
Introduction
Transcranial magnetic stimulation (TMS) produces a noninvasive stimulation in the brain through the creation of magnetic fields that induce electrical currents in the brain. These currents are able to excite or inhibit regions of the brain, which is helpful for studying certain aspects of brain physiology or, more recently, as a tool in the treatment of certain neuropathologies. A specialized form of repetitive TMS (rTMS), theta burst stimulation (TBS), has been considered the most efficient protocol in terms of number of impulses and intensity required during a given stimulation (1). The TBS utilizes a three-pulse burst to stimulate the region of interest and has been investigated as a potential tool for the treatment of clinical populations including depression (2). However, the impact of TBS on brain perfusion as well as intrinsic functional connectivity networks of human brains has not yet been systematically evaluated. In this pilot project, we aimed to study the effect of intermittent TBS (iTBS, excitatory stimulation) on perfusion and resting-state functional connectivity in healthy adults.Methods
iTBS was applied to the left dorsal lateral prefrontal cortex (DLPFC), in conjunction with functional imaging before and after the stimulation. We used a MagVenture system with a Localite TMS Navigator system to guide stimulation site and ensure repeatability. A single pulse was applied to the primary motor cortex to induce a response at the abductor pollicis brevis which could be analyzed using electromyography (EMG) to determine resting and active motor thresholds. The iTBS was applied with an intensity set to 80% of the active motor threshold. Functional MRI was measured right before and immediately after the iTBS.
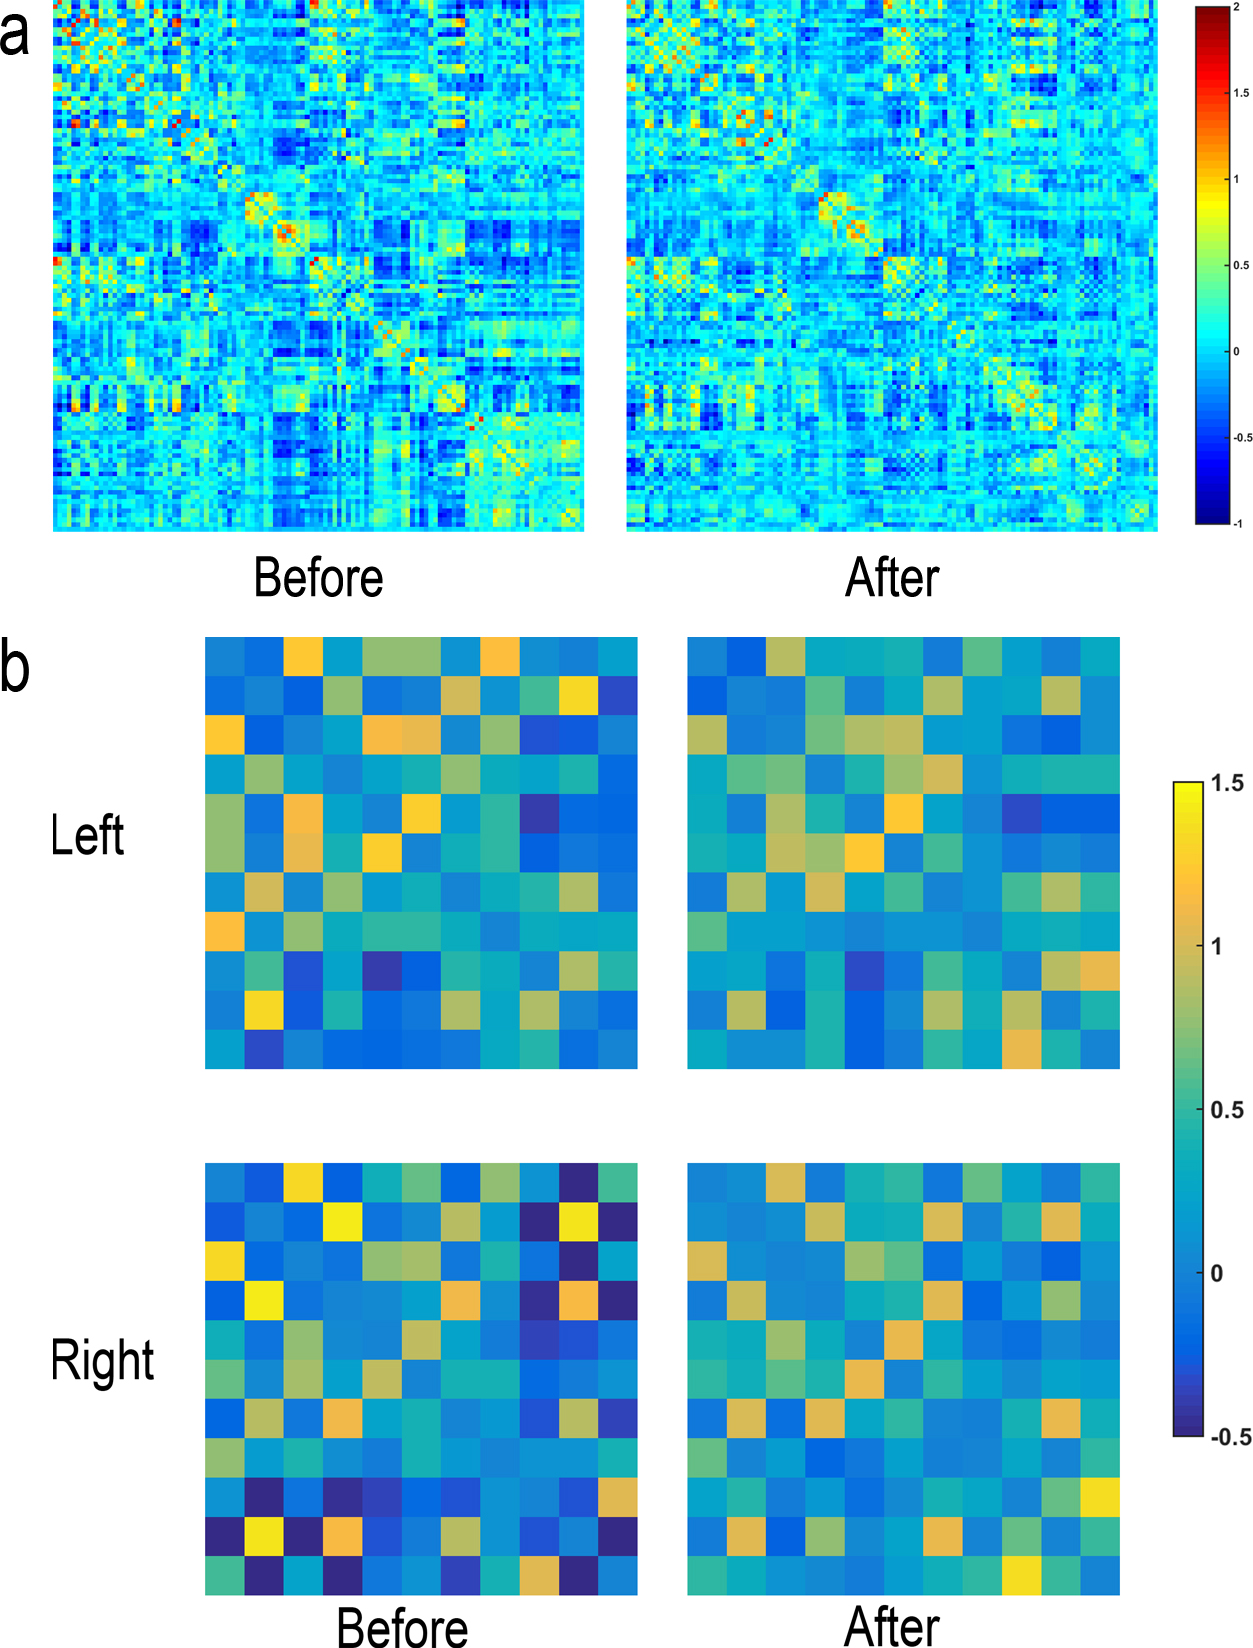
Imaging was performed on a 3T scanner (Siemens, Skyra). Structural T1 weighted images using an MPRAGE sequence were also acquired for registration. Echo-planar resting state functional MRI images were acquired with TR/TE=3000/36 msec, FOV=240mmx240mmx108mm, FA= 90, acquisition matrix=160x80x72, voxel size=1.5mm3, and multi-band factor=2. Data were preprocessed using FSL and Matlab with registration to MNI (Montreal Neurological Institute) standard space. Seed based analysis was performed with seed placed at the left DLPFC. Pre- and post-iTBS correlation matrices were calculated based on the AAL atlas (Figure 1a). We calculated whole-brain asymmetry measures and inter-regional connectivity within the frontal cortex.
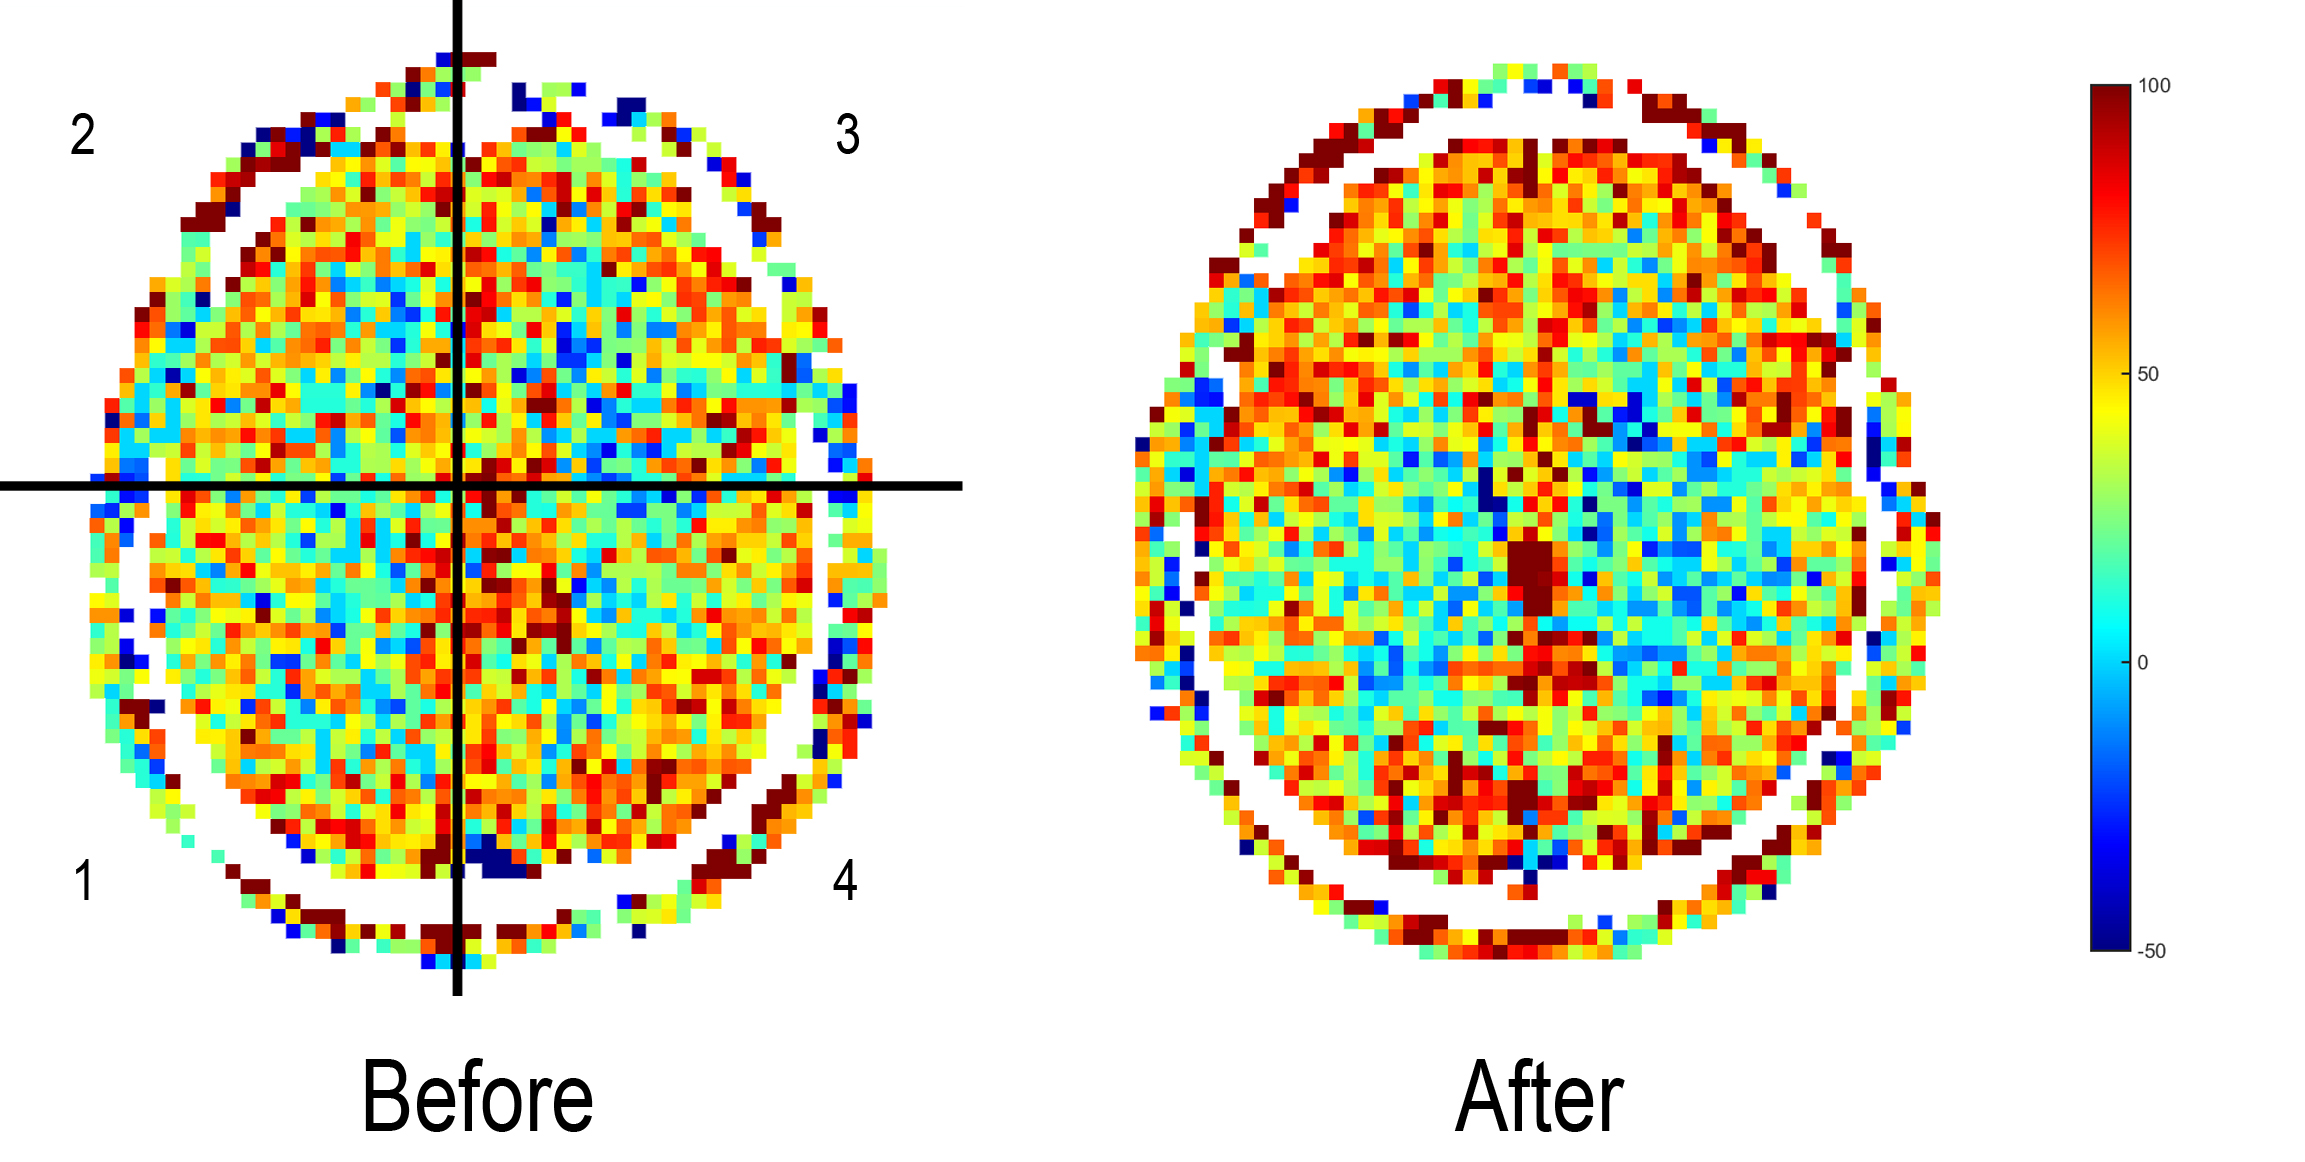
Arterial spin labelling (ASL) was performed using pseudo continuous ASL (pCASL) to determine if rTMS had caused a change in perfusion. pCASL was acquired with imaging parameters of TR/TE=5000/15.64 msec, acquisition matrix=64x64x42, slice thickness=3mm, bolus duration =1800ms and bolus delay = 1800ms.
Results
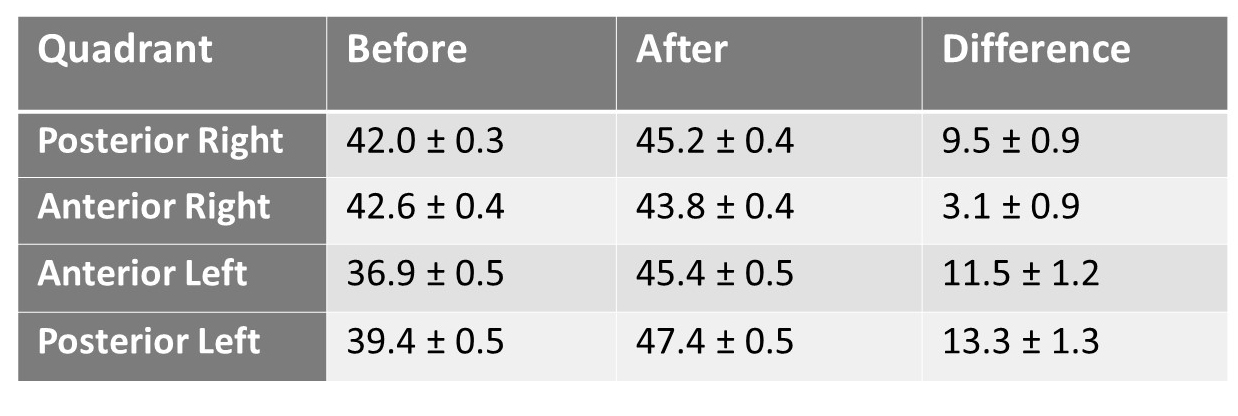
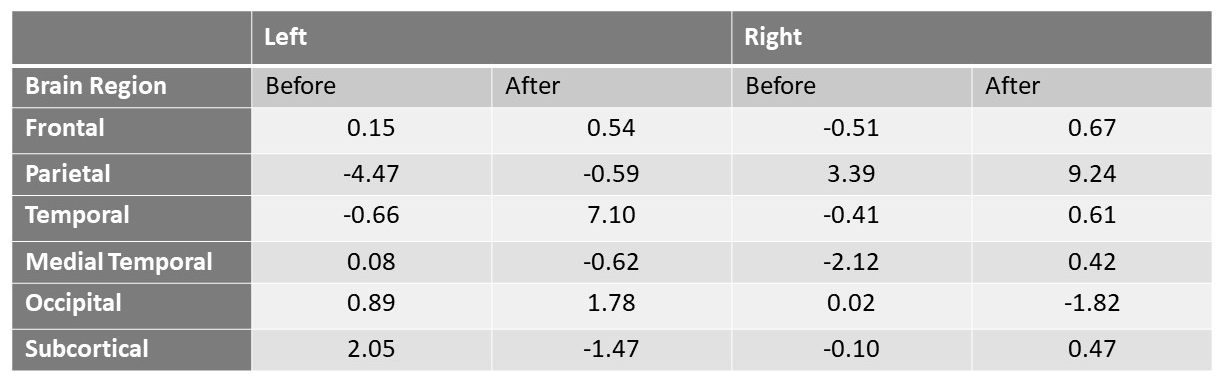
Perfusion results showed that an increase in perfusion in all quadrants of the brain (Figure 2) with the largest increase in perfusion being observed in the left hemisphere (Table 1).
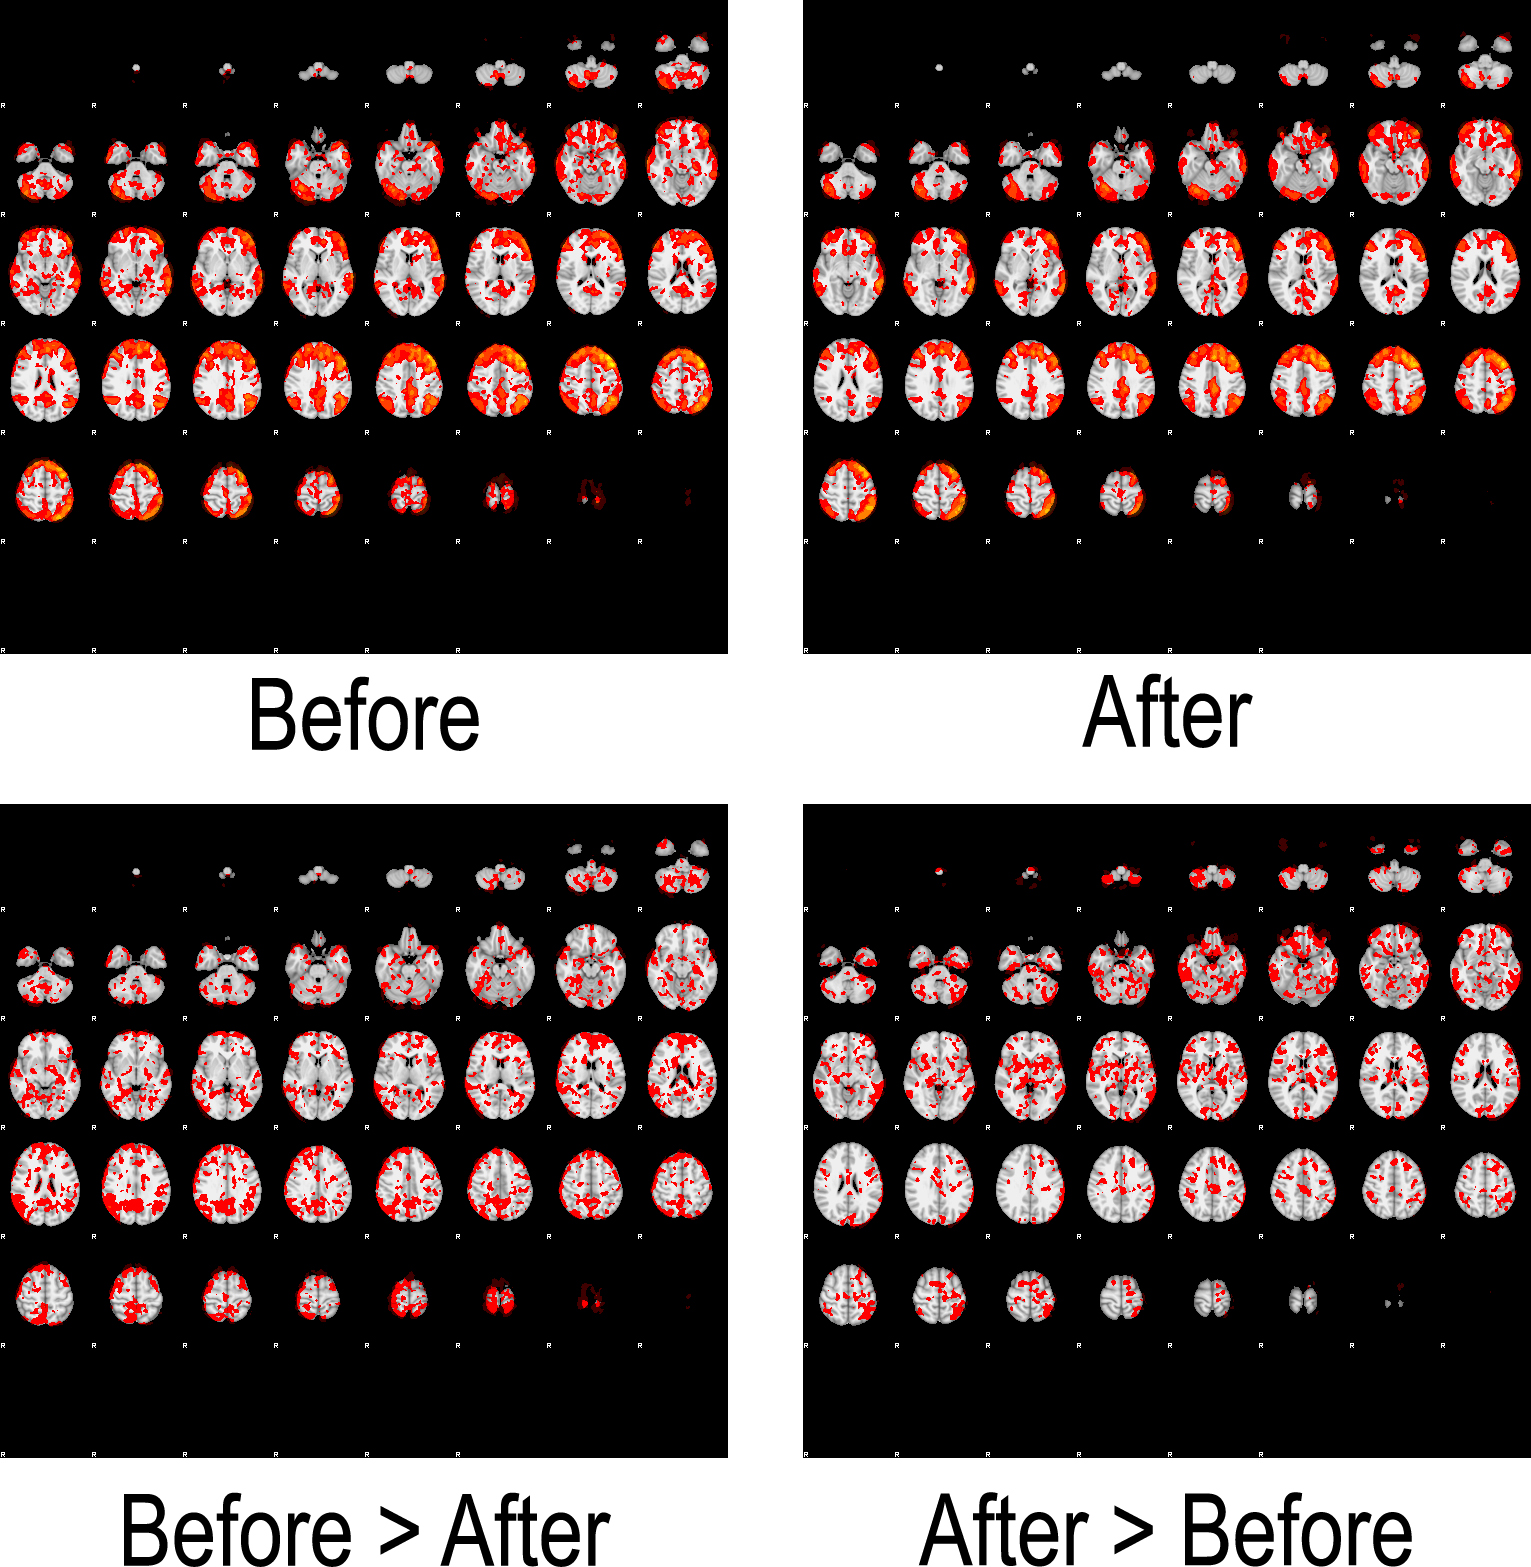
The seed-based analysis exhibited significant iTBS effect (Figure 3). The right supramarginal area, superior parietal, and posterior cingulate cortex, as well as the left fusiform showed stronger connectivity to the left DLPFC after the iTBS. The left ventral prefrontal cortex, inferior temporal area, and frontal eye field, as well as the right angular gyrus exhibited weaker connectivity to the left DLPFC after the iTBS.
The matrix-based analysis revealed a change in asymmetry measure after iTBS (Table 2). The inter-region correlations within the frontal lobe are illustrated in Figure 1b.
Discussion
The left DLPFC is one of the major rTMS targets for treating symptoms of depression. In this pilot project, we demonstrated asymmetrical changes in perfusion as well as connectivity changes in the left DLPFC. Further evaluation of the impact of TBS (including both iTBS and continuous TBS) as well as different stimulation targets on perfusion and functional connections of the brain is warranted. Additionally, further study with high-resolution ASL and resting-state fMRI in a larger cohort would be beneficial to pinpoint where potential changes are occurring.Acknowledgements
References
1. Huang Y-Z, Edwards MJ, Rounis E, Bhatia KP, Rothwell JC. Theta Burst Stimulation of the Human Motor Cortex. Neuron 2005;45:201–206. doi: 10.1016/j.neuron.2004.12.033.
2. Chung SW, Hoy KE, Fitzgerald PB. THETA-BURST STIMULATION: A NEW FORM OF TMS TREATMENT FOR DEPRESSION? Depress. Anxiety 2015;32:182–192. doi: 10.1002/da.22335.
Figures