4662
Alterations in resting-state functional connectivity in patients with Crohn’s disease in remission1Radiology, UW-Madison, Madison, WI, United States, 2RADIOLOGY, UW-MADISON, MADISON, WI, United States, 3Medicine, UW-Madison, Madison, WI, United States, 4Neurology, UW-Madison, Madison, WI, United States, 5Neuroscience Training Program, UW-Madison, Madison, WI, United States
Synopsis
Crohn’s disease (CD) is a chronic inflammatory disorder that commonly affects the small intestine and is a phenotype of inflammatory bowel disease (IBD). Several studies have reported changes in cortical thickness and neurologic deficits in patients with IBD. Here we report alterations in resting state functional MRI connectivity in patients in CD in remission compared to healthy controls, specifically in the executive control and default mode networks. Alterations in resting state functional connectivity in patients with CD may explain some of the mechanisms underlying the development and progression of CD and associated deficits in cognitive and affective functioning.
INTRODUCTION
Crohn’s disease (CD) is one of the main phenotypes of inflammatory bowel disease (IBD). There is evidence of alterations in both cortical thickness1 and task associated functional brain activation patterns, in CD patients in remission2. Additionally, there is evidence from studies of other chronic pain disorders that persistent pain can impact patients' cognitive and affective functions due to a heightened sensitivity to the environment and an inadequate ability to modulate their cognitive and emotional states3. However few studies have investigated the underlying brain functional connectivity patterns that could likely be leading to the heightened sensitivity to the environment. We therefore investigated the resting state functional MR connectivity (FC) patterns in 19 patients with CD and compared with 19 age matched healthy control (HC) subjects, with a specific focus on networks involved in cognitive and affective function. We focused on the cingular-opercular (CO), fronto-parietal (FP) networks, both involved in executive control and salience, and the default mode network (DMN).METHODS
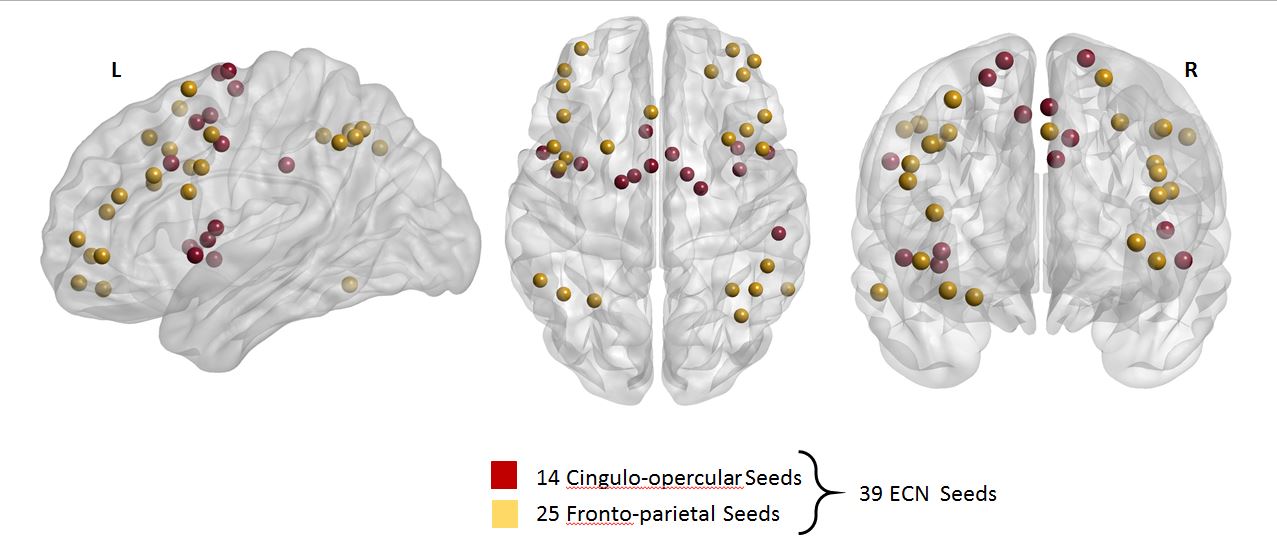
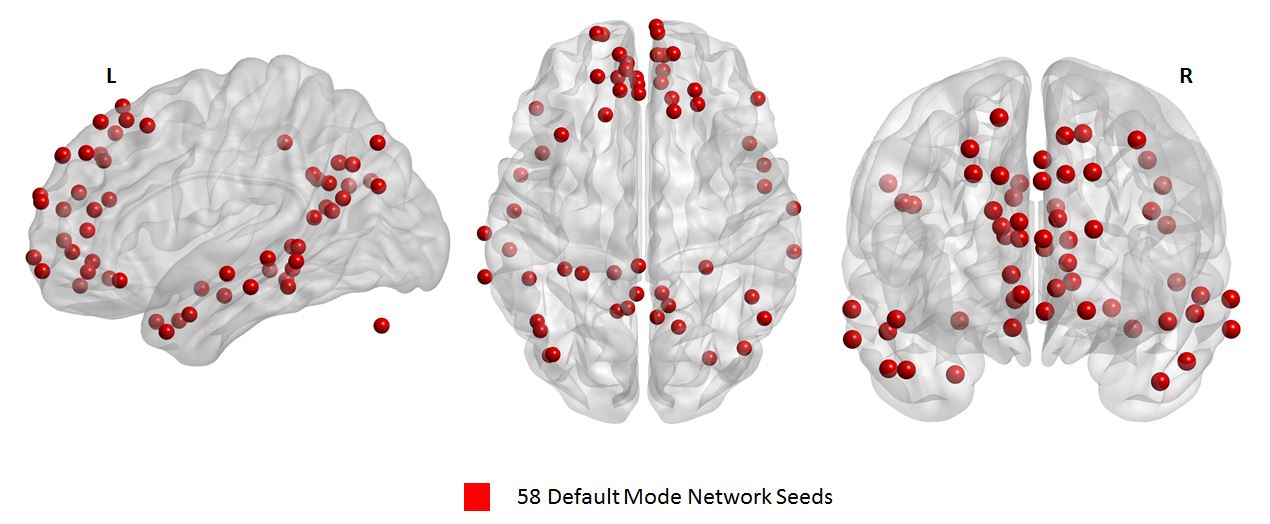
A cohort of 38 subjects comprising of 19 CD patients (11 males and 8 females, mean age=36.21, SD=16.14) and 19 HC (11 males and 8 females, mean age=38.47, SD=18.76) were tested. Five minutes eyes closed resting-state functional MRI and T1 structural MRI were collected on a 3T GE scanner. The acquisition parameters were: TR/TE/θ = 2600 ms/22 ms/60°, FOV = 100 × 100 mm, slice thickness = 3.5mm isotropic. Anatomical MRI data were acquired using a T1-weighted, three-dimensional, gradient-echo pulse-sequence (MPRAGE) with TR/TE/θ = 8160 ms/ 3.18 ms/12°, FOV = 100 × 100 mm, slice thickness = 1 mm. Seed based FC analysis was performed using the Data Processing Assistant for Resting-state fMRI Basic Edition (DPARSF) toolbox, which is part of the Data Processing and Analysis of Brain Imaging (DPABI) toolbox version 3.1 (http://rfmri.org/dpabi)4. Data preprocessing (including slice timing, realignment, normalization, smoothing (4 mm FWHM), regressing out head motion parameters) were conducted using DPARSF and SPM8. Seed regions in two brain networks5 were utilized in this study: (1) 39 seed regions in executive control network (ECN) consisted of 14 seeds from the CO network and 25 seeds from the FP network as illustrated in Figure 1 and (2) 58 seed regions in the DMN as shown in Figure 2. We calculated the temporal correlations as spontaneous neuronal connectivity to quantify FC and generated a 39x39 correlation matrix for ECN and a 58x58 correlation matrix for DMN per subject for CD and HC groups. From these matrices, a total of 741 and 1653 unique pairwise functional connections were extracted from ECN and DMN respectively for each subject.
Group differences between functional connections of CD and HC groups were examined using independent two-sample t-test. Multiple comparisons correction was performed by estimating the false discovery rate (FDR) based on the Benjamini & Hochberg6 procedure in Matlab R2016b (The MathWorks, Inc., Natick, Massachusetts, United States). After correction of type I error, specific functional connections with corrected p-value < 0.05 were deemed to be significantly different between CD and HC groups for each network. Results were visualized with the BrainNet Viewer Toolbox7.
RESULTS
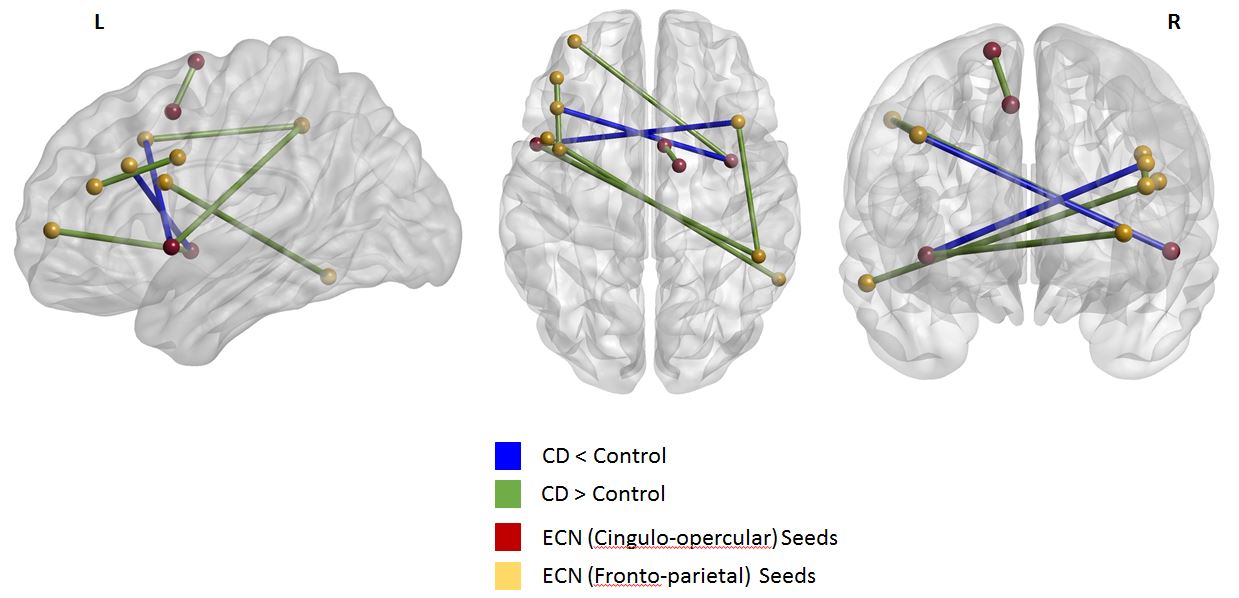
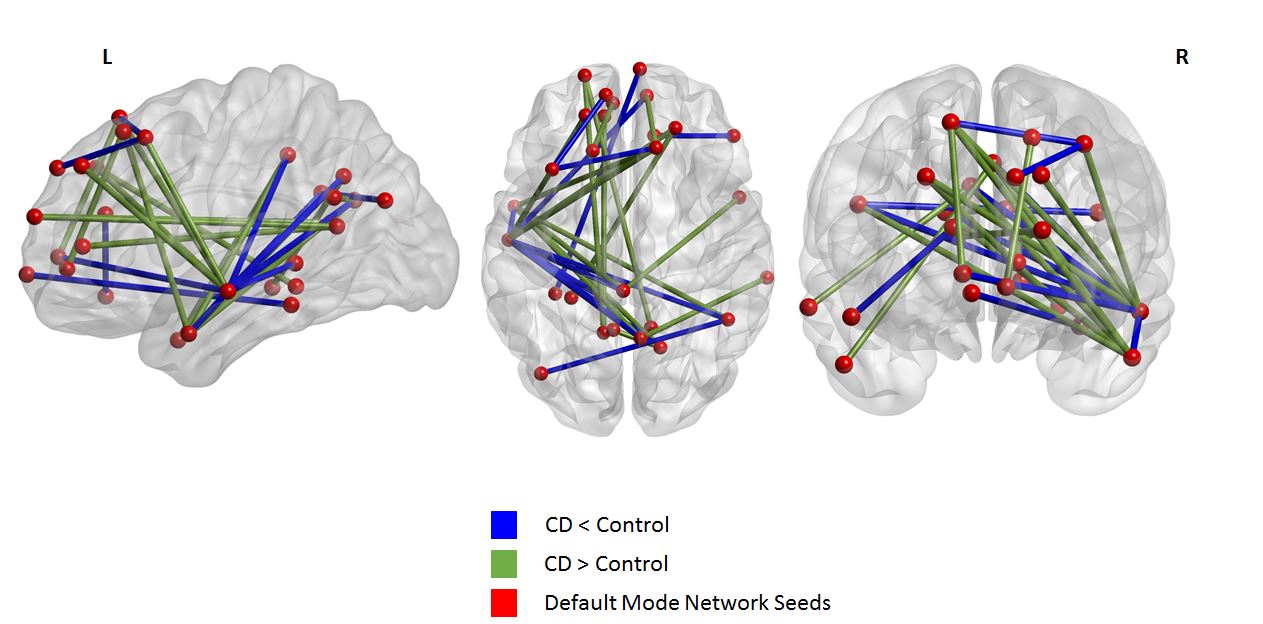
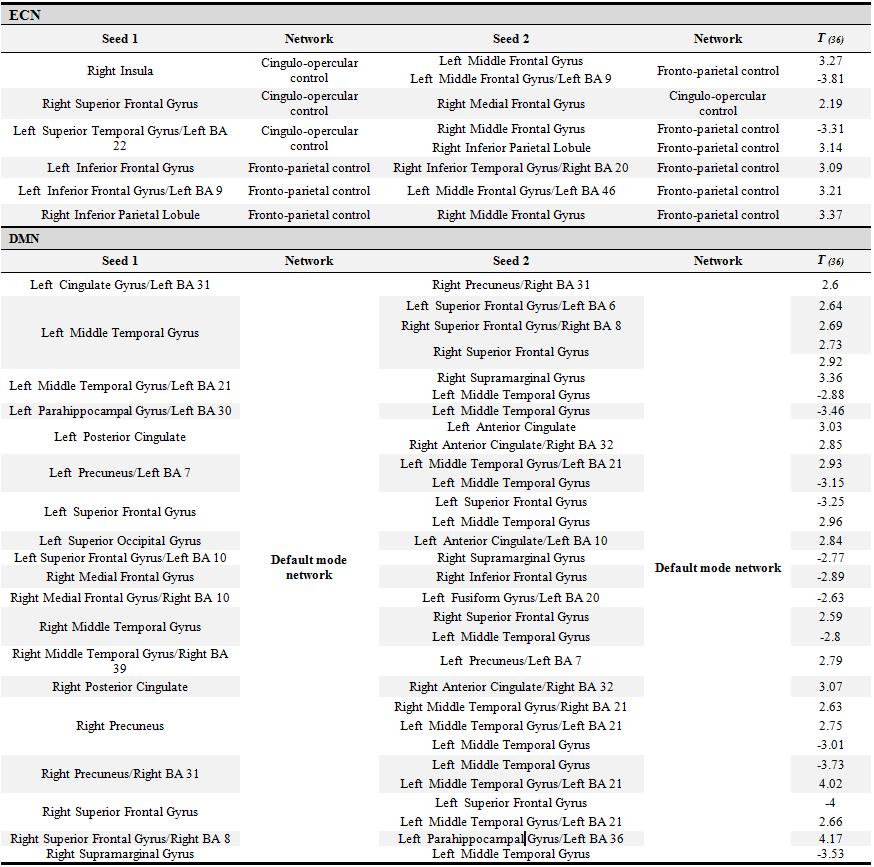
CD patients were not different in age (p = .71), handedness (p = .21), and education (p = .39) compared to the HCs. For FC results: (1) in ECN, CD patients had increased values within FP network, within CO network, and between CO and FP networks (8 significant connections). (2) In DMN, CD patients had all increased as well as decreased values with default mode network (31 significant connections). Individual functional connections are enlisted in Table 1. Connections exhibiting significant differences in each network are visualized in Figures 3 and 4.DISCUSSION
Our results suggest alterations in resting-state connectivity patterns in CD patients in remission. All the patients in this study were in stable remission and had a relatively low pain score. Notably, increased FC within components of the executive control network suggest a likely reason for previously reported deficits in performance on cognitive tasks when compared to HCs1. Alterations in the FC within the DMN, which includes regions associated with self-referential processing, may explain patients’ increased sensitivity to pain and greater self-monitoring.CONCLUSION
Our results suggests that CD patients, although currently in remission, suffer from the long term effects of chronic discomfort and pain which may lead to changes in the connectivity patterns in the executive control and the default mode networks. Future studies will need to explore the relationship between these altered FC patterns and performance on cognitive and affective tasks within the same sample.Acknowledgements
This work was supported by the National Institute of Child Health and Human Development (grant number K12HD055894 to SS), and pilot funding from the UW-Madison Department of Radiology R&D (to SS) and the UW-Madison Department of Medicine (to SS), by the National Institute of Neurological Disorders and Stroke (grant number K23NS086852 to VP), American Heart Association (AHA) 2015 Innovation and AHA 2015 Midwest Affiliate Grant-in-Aid award (VP), by the National Institute of Health (grant numbers T32GM008692, UL1TR000427, T32EB011434). The content of this paper is solely the responsibility of the authors and does not necessarily represent the official views of the NIH.
The authors wish to thank our patients, and coordinators Jenny Vue and Jill Surfus for their help with patient recruitment and data collection, and the MR staff of the Wisconsin Institutes for Medical Research (WIMR) center.
Conflict of Interest Statement
Dr. SS is a consultant for UCB Biosciences, Inc. All the other authors declare that the research was conducted in the absence of any commercial or financial relationships that could be construed as a potential conflict of interest.
References
1. Nair V, Beniwal-Patel P, Mbah I, et al. Structural imaging changes and behavioral correlates in patients with crohn’s disease in remission. Front Hum Neurosci. 2016;10:460.
2. Beniwal-Patel P, Nair V, Mbah I, et al. Sa1886 altered brain functional activation and connectivity patterns in patients with crohn's disease in remission. Gastroenterology. 2016;150(4):S392.
3. Bushnell M, Ceko M, Low L. Cognitive and emotional control of pain and its disruption in chronic pain. Nat. Rev. Neurosci. 2013;14:502 – 511.
4. Yan C, Zang Y. Z. DPARSF: A MATLAB toolbox for pipeline data analysis of resting-state fMRI. Front Syst Neurosci., 2010; 4:13.
5. Power J, Cohen A, Nelson S, et al. Functional network organization of the human brain. Neuron, 2011;72(4):665 – 678.
6. Benjamini Y, Hochberg Y. (1995). Controlling the false discovery rate: A practical and powerful approach to multiple testing. Journal of the Royal Statistical Society 1995;57:289 – 300.
7. Xia M, Wang
J, He Y. (2013). BrainNet Viewer: A network visualization tool for human brain
connectomics. PloS one, 2013;8(7):e68910.
Figures