4660
Resting State fcMRI Reveals Distinc Connectivity Patterns for Core-Belt-Parabelt Subfields of Human Auditory Cortex1Medical Image Analysis Center (MIAC), Basel, Switzerland, 2Department of Radiology, University Hospital of Basel, Basel, Switzerland, 3Department of Neuroradiology, University of Heidelberg Medical School, Heidelberg, Germany, 4School of Music, Music-Academy Basel, Basel, Switzerland, 5Department of Neuroradiology, Section of Biomagnetism, University of Heidelberg Medical School, Heidelberg, Germany
Synopsis
Converging evidence supports the hypothesis that human auditory cortex (AC) follows the core-belt-parabelt organization found in non-human primates. In the study presented here, we assessed the functional connectivity of the core (medial Heschl’s gyrus, mHG), belt (posterior-lateral HG, plHG) and parabelt subfields (anterior-lateral HG, alHG and planum temporale, PT) by applying resting state functional connectivity MRI (fcMRI) on a cohort of 84 musicians. Assessing inter-hemispheric connectivity, we found significant differences between right and left plHG as well as in right and left PT. The contrast between the different subfields revealed highly differentiated neuronal networks, especially between mHG and plHG.
Introduction
Converging evidence1 supports the hypothesis that the human auditory cortex (AC) follows the core-belt-parabelt organization found in non-human primates2. In a recent work combining fMRI and MEG, we were able to disentangle the spatial and temporal organization of the presumed subfields of AC3. In the study presented here, we assessed the functional connectivity of the core, belt and parabelt AC subfields by applying resting state functional connectivity MRI (fcMRI) in a cohort of 84 musicians.Subjects and Methods
In this study, 84 musicians (43 female) including 42 professionals from Music-Academy Basel were recruited. Professionals and amateurs were matched with respect to age (median: 21 years, range 18-29) and musical aptitude (AMMA; Advanced Measures of Music Audiation4; median tonal raw score: 32/40, range 25-40).
The MR measurements were performed on a 3T scanner (Magnetom Verio, Siemens Healthineers) equipped with a 12-channel head-coil. The scanning protocol encompassed a T1-weighted 3D anatomical scan (MPRAGE; TR/TI/TE/α=1570ms/900ms/2.7ms/9°) with 1mm3 isotropic resolution, a resting-state fcMRI and a blocked-design fMRI experiment in this order. In both fMRI and fcMRI, identical 38 oblique slices parallel to the Sylvian fissure were scanned (slice thickness 3mm, gap 1mm, TR/TE=2500ms/30ms). In the fMRI scan, subjects underwent an attentive auditory stimulation (complex harmonic tones, block duration 20s); 104 volumes were acquired in 4:25min. In the fcMRI run, 170 volumes were acquired in 7:10min.
FMRI and fcMRI data evaluation was performed using AFNI5 and FSL6. The analysis included slice timing and motion correction, spatial smoothing and realignment to MNI space. To remove non-neuronal fluctuations from the fcMRI time-series, FMRIB's ICA-based X-noiseifier (FIX, v1.06)7 was applied (trained on 32 randomly chosen data sets from our cohort). After denoising, the fcMRI data were low-pass filtered in time (cut-off 0.08Hz).
In each brain hemisphere, the subfields of AC were identified by means of the statistical fMRI group maps, namely: medial Heschl’s gyrus (HG) – presumably core region, posterior-lateral HG (belt), anterior-lateral HG and planum temporale (PT) (parabelt regions). For each of these ROI (a sphere of 3mm radius), correlation analysis was performed on the individual fcMRI data of each subject. The resulting correlation maps were z-transformed8. Functional connectivity effects were calculated on these z-score maps by performing a three factor analysis-of-variance (ANOVA). Group (professionals/amateurs) and ROI were treated as fixed factors and the subjects as random factor (AxBxC(A) ANOVA). We assessed contrasts between groups, inter-hemispheric contrasts for each subfield and contrasts between the subfields.
Results
The MNI coordinates of the eight ROI (four for each hemisphere) used as seeds for the connectivity analysis are listed in Figure 1. In the ANOVA, no significant differences were found between professionals and amateurs for any contrast. Therefore, all subjects were pooled for further analysis.
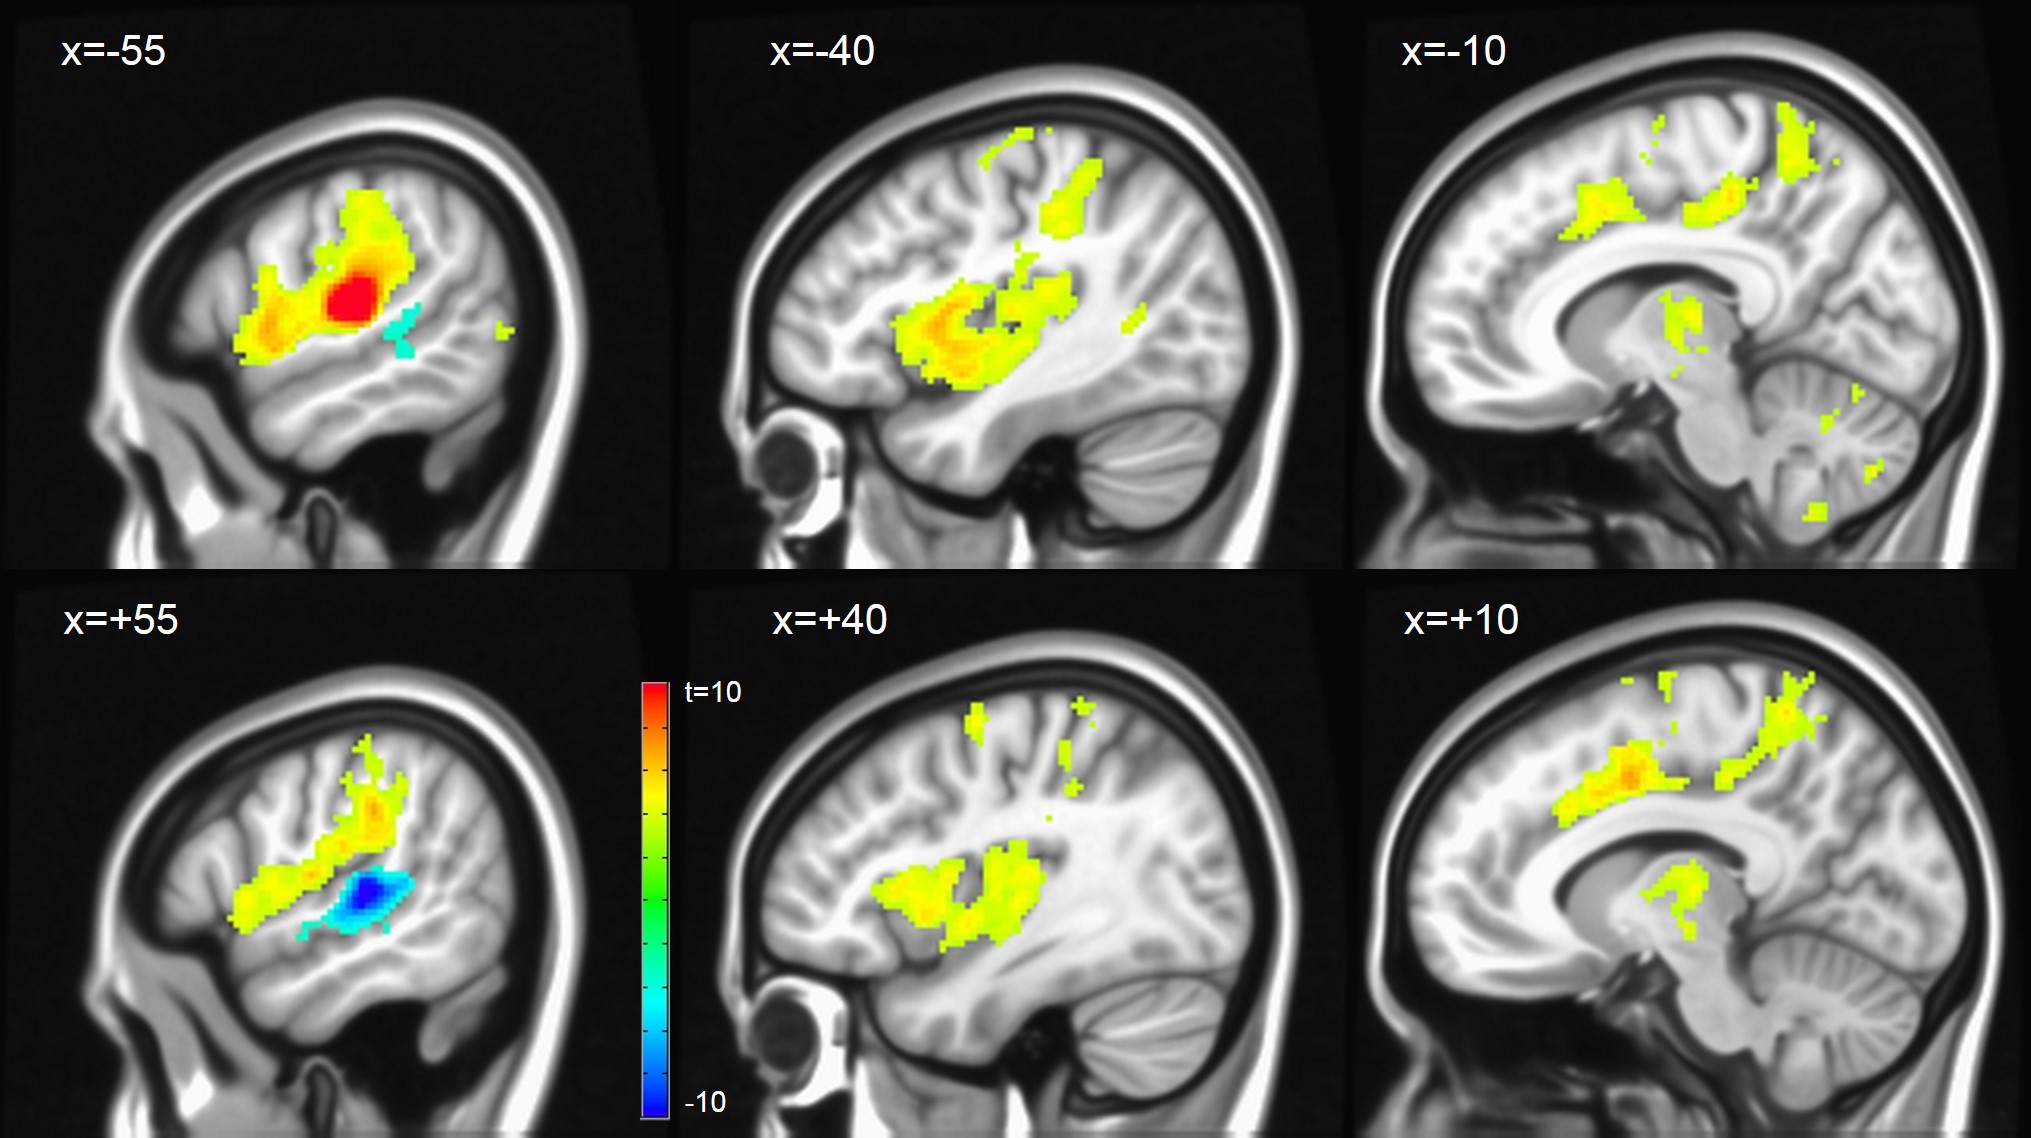
Assessing inter-hemispheric connectivity, no significant differences were found for the anterior-lateral HG (alHG). Left medial HG (mHG) showed higher connectivity to medial occipital cortex, whereas right mHG had higher connectivity to bilateral thalamus. Left posterior-lateral HG (plHG) demonstrated higher connectivity to bilateral sensorimotor network (Figure 2), whereas right plHG had higher connectivity to to medial portion of superior temporal gyrus. Left PT showed higher connectivity to the left fronto-parietal language network, right PT higher connectivity to the bilateral sensorimotor network (Figure 3).
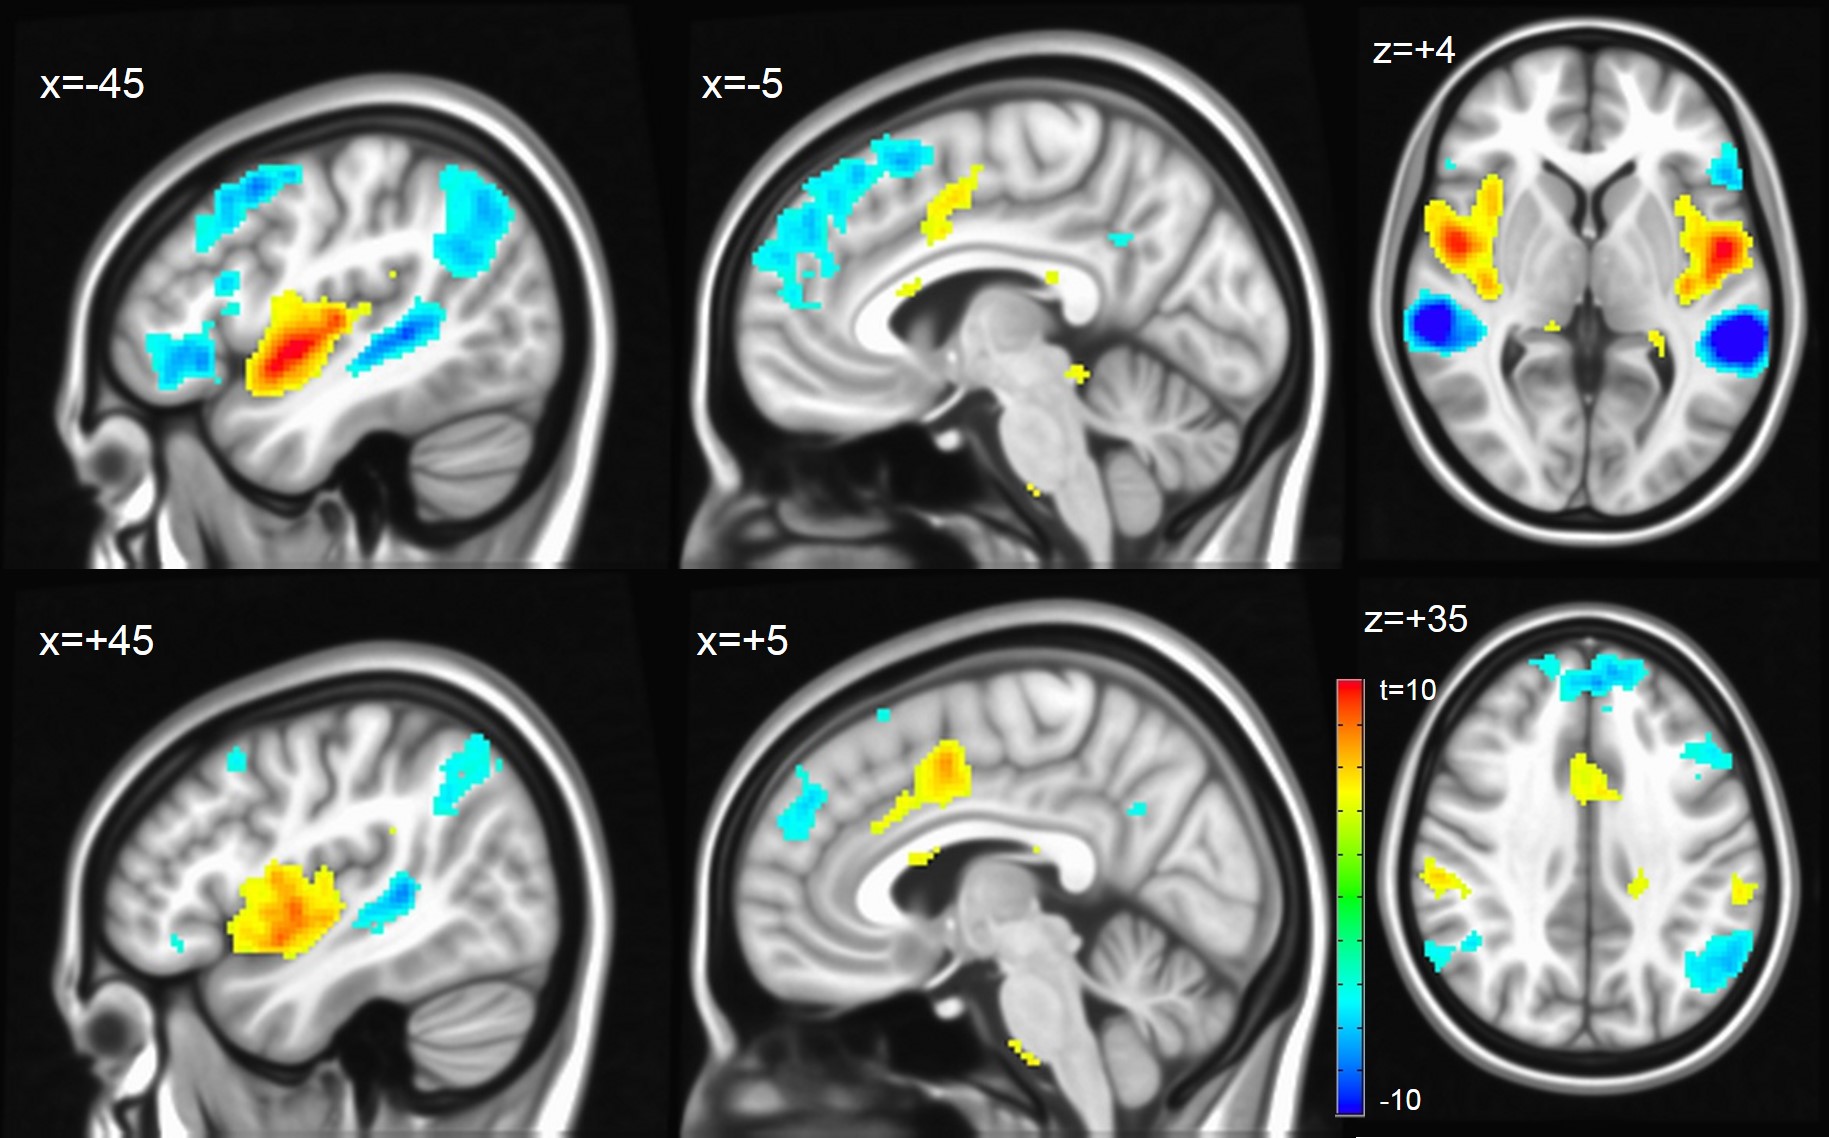
The contrasts between the different subfields revealed highly differentiated neuronal networks, especially between mHG (core) and plHG (belt). mHG was highly correlated with a subcortical network encompassing brain stem and midbrain, bilateral basal ganglia and thalamus as well as anterior cingulate cortex. In contrast, plHG showed higher connectivity to sensorimotor, parietal attentional and occipital visual areas (Figure 4). Contrasting alHG and PT (both presumably parabelt), strong left lateral connectivity of PT with the language network was demonstrated, whereas alHG showed bilateral connectivity to anterior temporal and insular regions as well as to bilateral sensorimotor areas (Figure 5).
Discussion
In the present study, we were able to identify the subfields of the auditory cortex using a blocked-design fMRI experiment with attentive auditory stimulation. Furthermore, fMRI-seeded (ROI-based) resting-state fcMRI analysis revealed corresponding functional networks for each specific subfield. Besides well-known functional connections (e.g. the left-lateralized connectivity of planum temporale with the language network) we found strong evidence that the medial HG as putative core region is part of a subcortical network, whereas the “belt” posterior lateral HG connects to higher cortical areas as sensorimotor and visual networks. The combination of the presented results with the MEG experiments assessing the temporal hierarchy of auditory processing3 will give more insight into the organization and processing of human auditory cortex.Acknowledgements
This project was partly funded by the Swiss National Foundation (SNF) and the Deutsche Forschungsgemeinschaft (DFG)References
1. Chevillet M et al. J Neurosci 31 :9345-9352, 2011.
2. Sweet RA et al. J Comp Neurol. 491:270-289, 2005.
3. Benner J et al. ABIM, Champéry 2015.
4. Gordon EE. Chicago : GIA Publications, 1989.
5. Cox RW, Comput. Biomed. Res. 29 :162-173, 1996.
6. Smith SM et al., NeuroImage 23(S1) :208-219, 2004.
7. Griffanti L et al, NeuroImage 95 :232-247, 2014.
8. Lowe MJ et al, NeuroImage 7 :119-132, 1998.
Figures