4659
Assessing the functional connectivity of hippocampal subfields in healthy controls and TLE: a resting state fMRI study at 7T1Department of Radiology and Nuclear Medicine, Maastricht University Medical Center, Maastricht, Netherlands, 2School for Mental Health and Neuroscience, Maastricht University, Maastricht, Netherlands, 3Department of Neurology, Maastricht University Medical Center, Maastricht, Netherlands, 4Epilepsy Center Kempenhaeghe, Heeze, Netherlands, 5Faculty of Electrical Engineering, University of Technology Eindhoven, Eindhoven, Netherlands
Synopsis
It has been suggested that hippocampal subfields show functional specialization. Resting-state functional MRI studies have improved our understanding of brain function. Using rs-fMRI, we examined the possibility of segmenting the hippocampal subfields at 7T and assessed the functional correlations between the hippocampal subfields with other cortical regions. This method was tested in both healthy controls and temporal lobe epilepsy patients. Only small differences in functional connectivity between healthy controls and epilepsy patients were found. This study demonstrated the potential of assessing the resting-state functional connectivity of the hippocampal subfields with other regions of interest in the cortex.
Introduction
Previous studies have suggested that the hippocampal subfields exhibit functional specialization.1,2 As their precise function has not been elucidated as of yet, and since resting-state functional MRI (rs-fMRI) studies have improved our understanding of brain function and network organization3,4, studying the functional correlations between the hippocampal subfields with the cortex provide valuable information. Recently, automatic segmentation of the hippocampal subfields has become possible due to an increased resolution of structural MRI and advances in segmentation software.5 The aim of this study was to examine whether hippocampal subfields exhibit distinct functional organization. This was tested in both healthy controls and temporal lobe epilepsy patients, which is known to affect hippocampal functional connectivity.6Methods
Seven MRI-negative localization-related temporal lobe epilepsy patients (3 female, 6 male, mean age 41.4 years) and fourteen healthy subjects (6 female, 8 male, average age 39.6 years) were included in this study. MR data were acquired using a 7T Magnetom Siemens MRI System (Siemens Medical Systems, Erlangen, Germany) and a 32-channel phased-array head coil. Before scanning, dielectric pads were placed proximal to the temporal lobe to improve the B1 field homogeneity across the brain. Whole-brain T1-weigthed images (0.9 mm cubic) were obtained with a 3D MP2RAGE sequence with the following parameters: TR/TE = 4500/2.39 ms, TI1/TI2 = 900/2750 ms, α1/α2 = 5°/3°. Furthermore, rs-fMRI data (1.5 mm cubic) were acquired with an EPI sequence, using : TR/TE = 1700/19.0 ms, number of measurements = 200 and TA = 6:00 min.
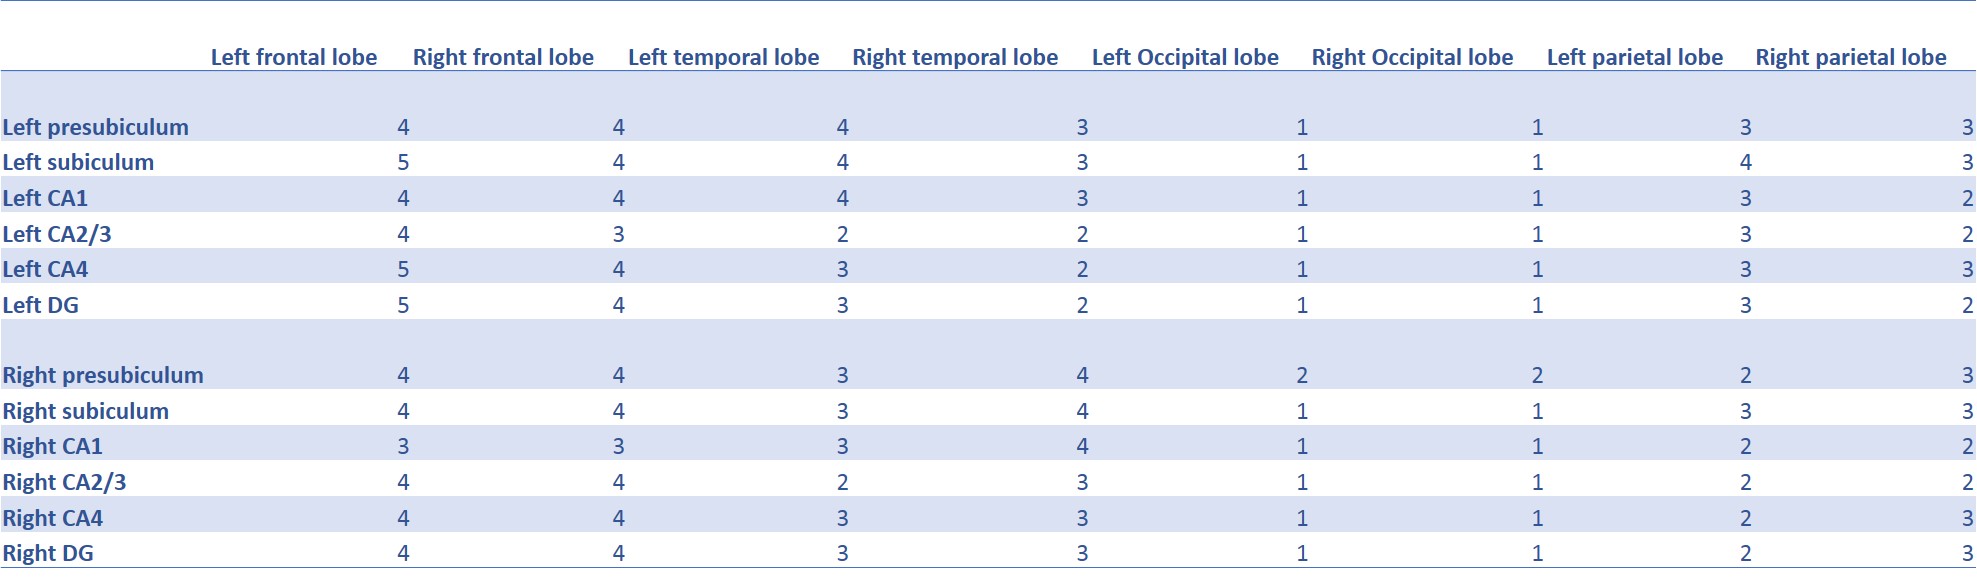
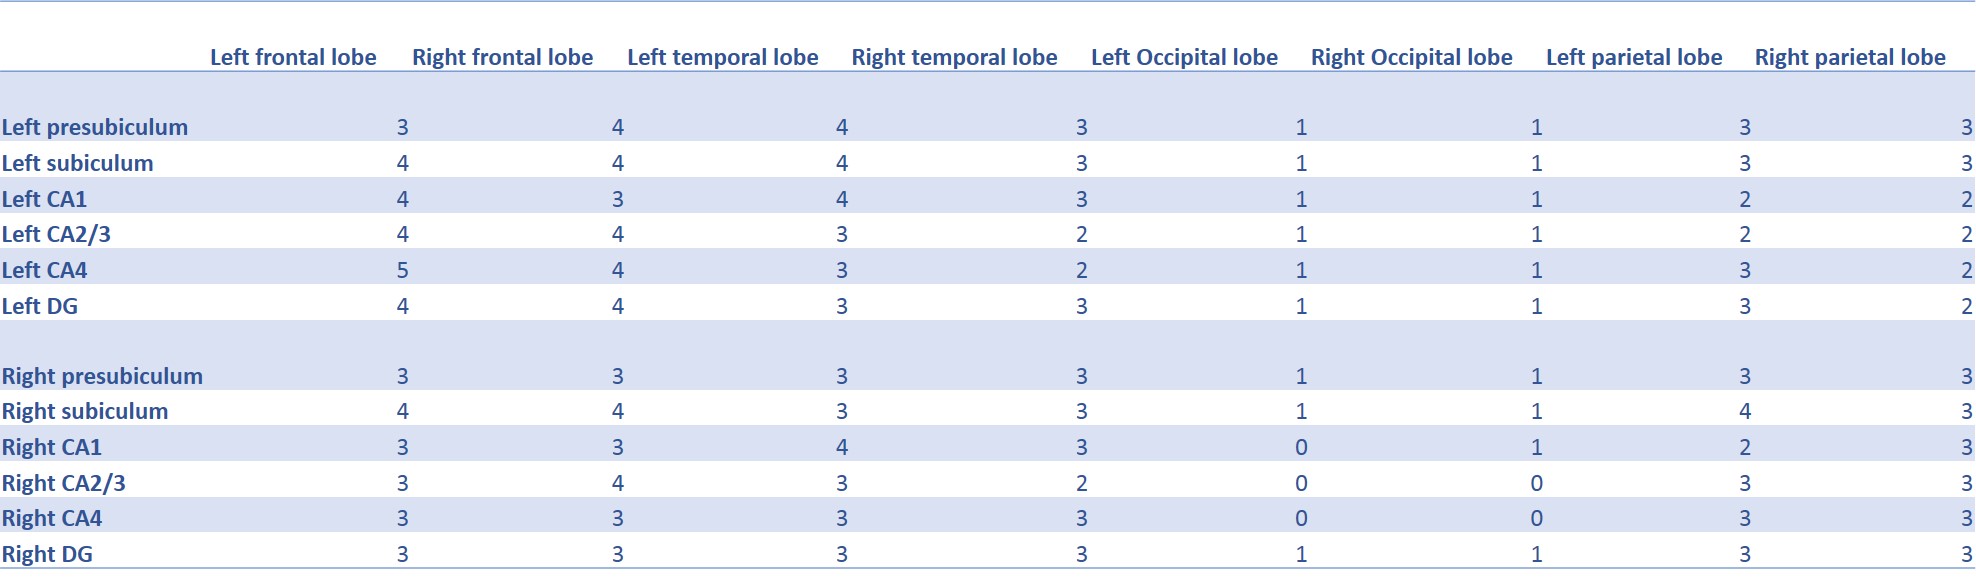
Data preprocessing steps were performed to prepare MP2RAGE data for segmentation. Preprocessing included: skull stripping yielding a mask to improve brain extraction and gradient distortion correction (fsl v5.0.1, www.fmrib.ox.ac.uk/fsl). Cortical and hippocampal subfield segmentation was performed with FreeSurfer v6.0. Functional data preprocessing included, bias field correction, brain extraction, motion correction, distortion correction, slice timing correction, spatial and temporal filtering and deregression of white matter and cerebrospinal fluid (FSL and SPM12). The functional, structural and segmented images were aligned (FLIRT in fsl). Seven regions of interest (ROIs) in the hippocampus were selected from the segmentation: presubiculum, subiculum, Cornu Ammonis 1 (CA1), CA2/3, CA4 and the Dentate Gyrus (DG). These regions were both selected in the left and right hippocampus. These ROIs were used for seed-based fMRI analysis. Correlations were assessed between these hippocampal subfields and different ROIs selected in the frontal, temporal, parietal and occipital lobes. The number of strong correlations between the hippocampal subfields and the different lobes was calculated by counting the number of strong connections. For this calculation, the ROIs within a lobe were combined. Strong connections were defined as the highest 20% of the found functional correlations. The average number of strong connections in the healthy controls was compared with those in the epilepsy patients.
Results
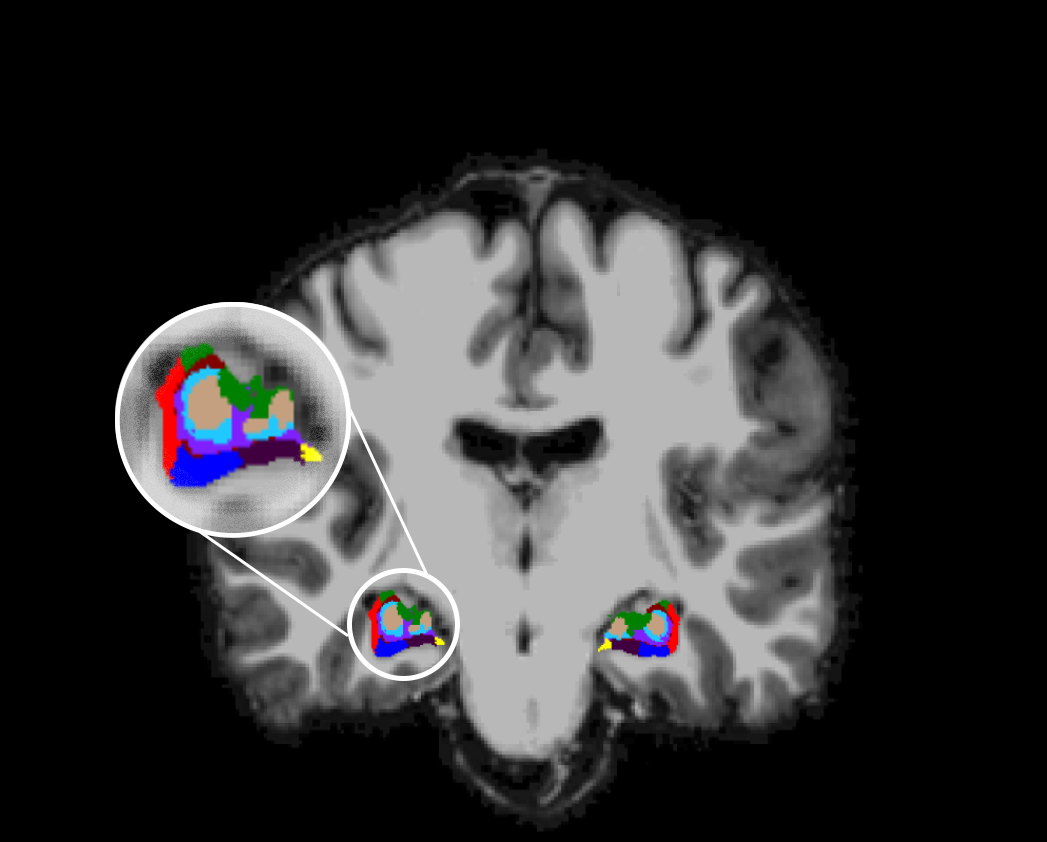
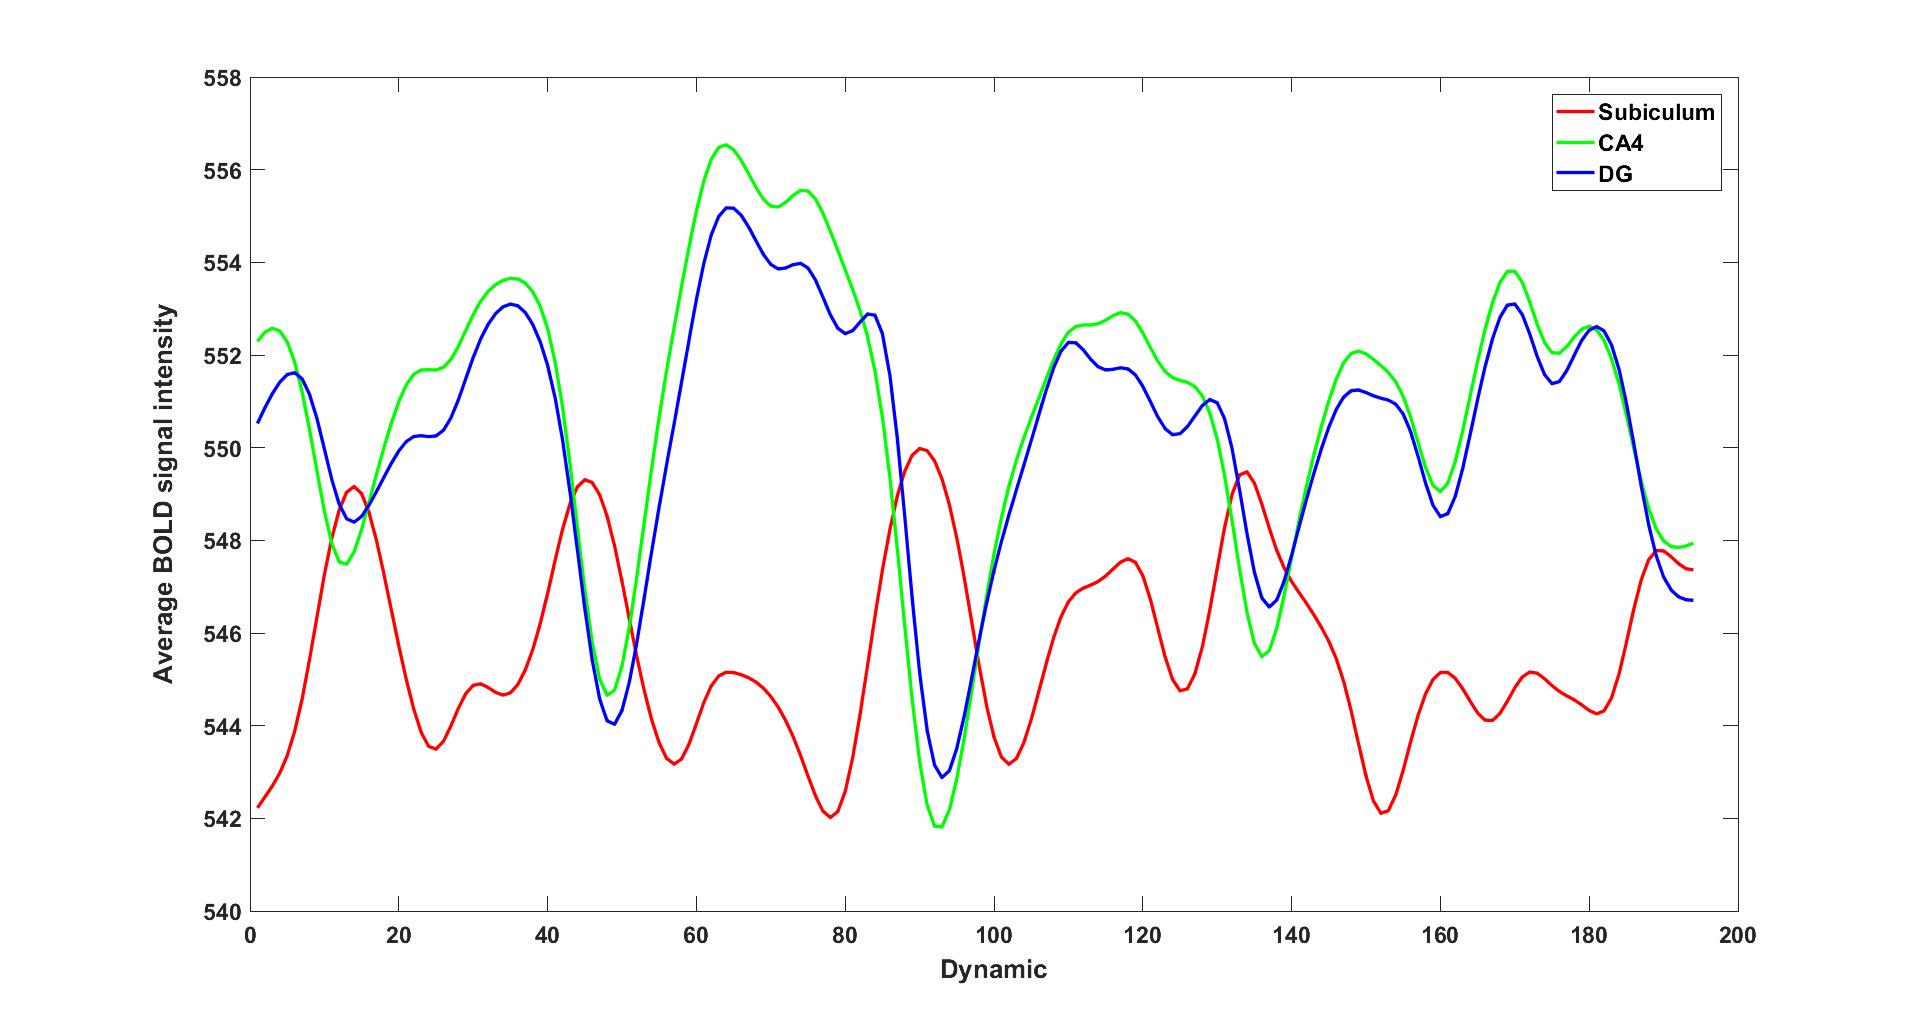
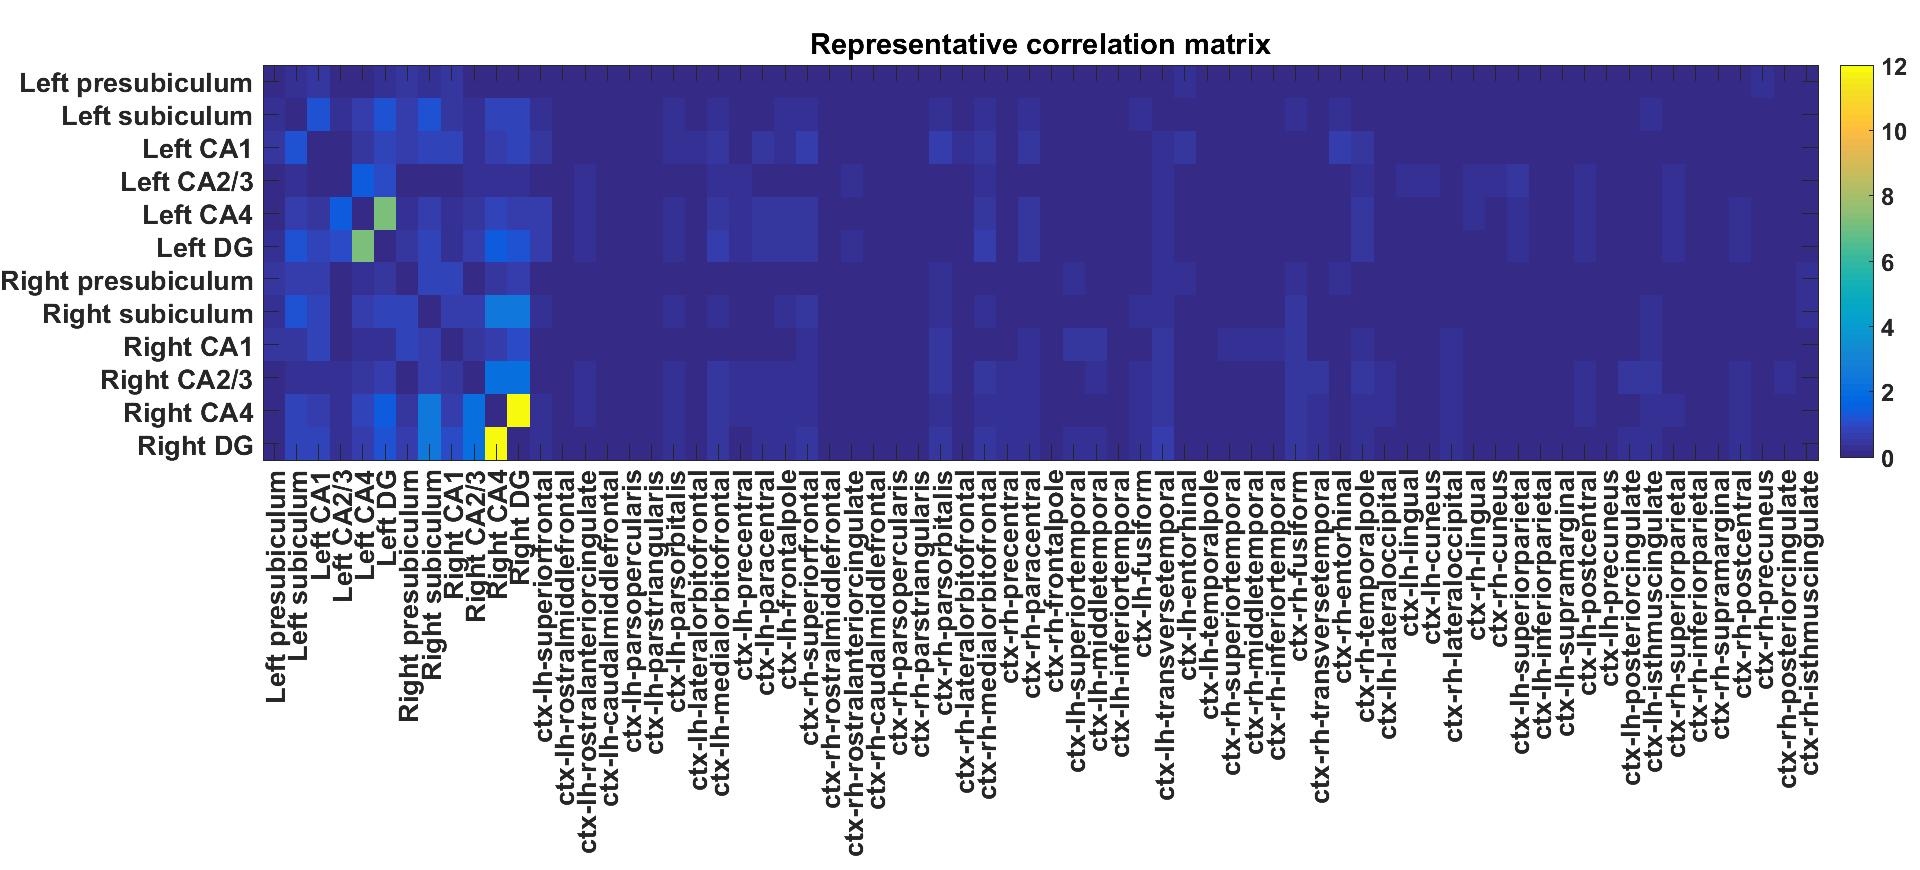
Cortical and hippocampal segmentation was successful in all subjects (figure 1). Typical BOLD signals already suggest a functional connectivity between the CA4 and DG (figure 2). In the correlation matrices, this strong functional connectivity was found as well (figure 3). Moreover, the correlation matrices showed the strongest correlations between the hippocampal subfields. Strong correlations were also found between the right DG and the right subiculum, between the left and right presubiculum and subiculum with the superior temporal lobe and the pars triangularis. Overall, the strongest correlations between the hippocampus and the frontal and temporal lobes were found, while the lowest correlations were found with the occipital lobe. Comparing the average functional correlations between the healthy controls and epilepsy patients (figure 4 and 5), in the control group a larger functional connectivity between the DG and the pars triangularis was found. In the epilepsy group, a higher number of strong correlations was found between the right subiculum and the interior parietal lobe.Discussion
Although most of the functional correlations between the hippocampal subfields and other cortical regions found were weak, this study showed the potential of assessing the functional connectivity of the hippocampal subfields with other cortical regions. In future work, in order to obtain stronger functional correlations, it might be useful to perform the analysis in a ROI-to-voxel based manner.Conclusion
The current study demonstrates the feasibility of segmenting the hippocampal subfields at 7T and of assessing the functional organization by calculating the functional correlation of these regions with other cortical regions.Acknowledgements
No acknowledgement found.References
1. Mueller, S. G. et al. Measurement of hippocampal subfields and age-related changes with high resolution MRI at 4 T. Neurobiol. Aging 28, 719–726 (2007).
2. Mueller, S. G., Chao, L. L., Berman, B. & Weiner, M. W. Evidence for functional specialization of hippocampal subfields detected by MR subfield volumetry on high resolution images at 4T. Neuroimage 56, 851–857 (2011).
3. Krakow, K. Imaging epileptic activity using functional MRI. Neurodegener. Dis. 5, 286–295 (2008).
4. Gupta, L. et al. Towards prognostic biomarkers from BOLD fluctuations to differentiate a first epileptic seizure from new-onset epilepsy. Epilepsia 58, 476–483 (2017).
5. Iglesias, J. E. et al. A computational atlas of the hippocampal formation using ex vivo, ultra-high resolution MRI: Application to adaptive segmentation of in vivo MRI , for the Alzheimer’s Disease Neuroimaging Initiative 1. Neuroimage 115, 117–137 (2015).
6. Das, S. R. et al. Structure specific analysis of the hippocampus in temporal lobe epilepsy. Hippocampus 19, 517–525 (2009).
Figures