4658
Comparison of Spatial Profiles of Activation and Resting State fMRI Signals Across Cortical DepthArabinda Mishra1, Feng Wang1, John C Gore1, and Li Min Chen1
1Vanderbilt University Institute of Imaging Science, Vanderbilt University, Nashville, TN, United States
Synopsis
FMRI at high spatial resolution is capable of resolving signals from different cortical layers providing the ability to examine local inter-layer information processing. In this study, we quantified the spatial profiles of BOLD fMRI activations and the point spread functions (PSF) of resting state correlations within layers. We found significantly broader extent of stimulus-evoked activity and resting state correlation profiles in the top layer than those in middle and lower layers. These differences may reflect differences in vasculature or neural activity between the layers.
Background
We recently reported the high spatial correspondence at the columnar level between fMRI and local field potential (LFP) signals during stimulation and at their correlation profiles at rest [1] in monkey primary somatosensory cortices (areas 3b and 1). Layers within a cortical column form their own local circuits and function as basic units to integrate input and output signals that are crucial for carrying out the specific functions of each cortical area. FMRI is capable of resolving signals from different cortical layers and provides the opportunity to examine local inter-layer information processing within and between brain regions at mesoscale (≈ 100 microns to several millimeter scale). To establish the spatial extents of activations and resting state fMRI correlation profiles at different cortical depths we acquired layer-resolved fMRI signals at high field and quantified the spatial profiles of BOLD responses during stimulus and in a resting state. We found significantly larger extent of stimulus-evoked activation in the top layer than those in middle and lower layers and broader correlation profiles.Methods
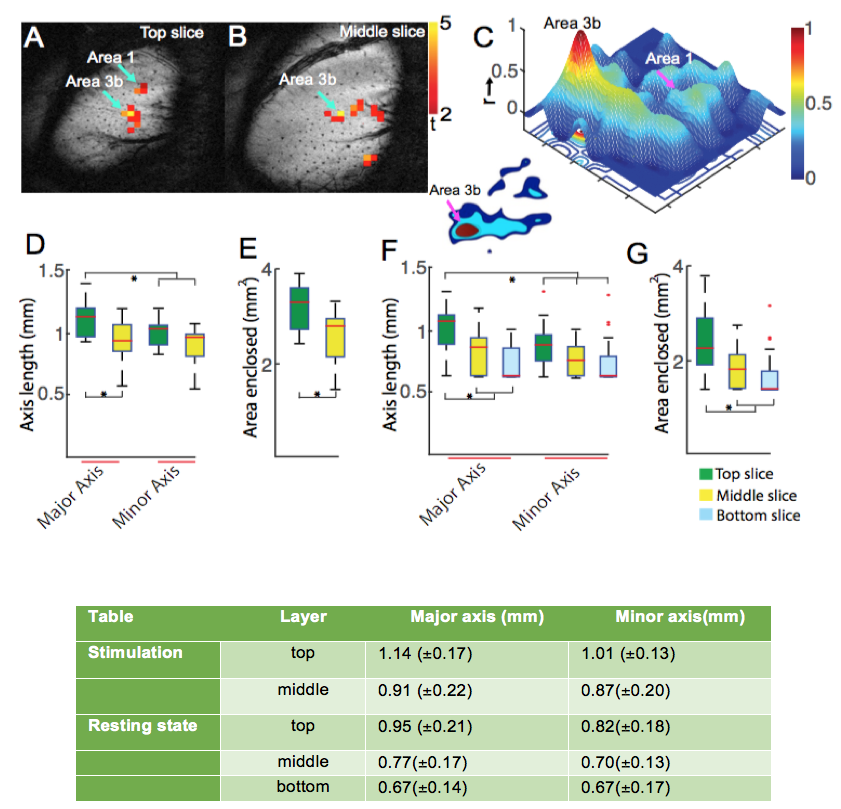
Three squirrel monkeys were included in the study. All scans were performed on a 9.4T, 21-cm bore magnet Varian INOVA MR imaging spectrometer, using 3cm surface transmit-receive coil covering somatosensory areas 3b and 1. Nine tangential (parallel to brain surface) BOLD EPI images (TR = 1.5s and TE = 16ms) were acquired with in-plane resolution of 547x547µm2 and 667µm thickness. High-resolution T2* weighted anatomic images (68x68x667µm3) were acquired with the same geometry. Resting state EPI data were acquired before the stimulus runs using an identical sequence (300 volumes in each run). We used alternating tactile stimulation (8 Hz vibration, 30s off/on) of distal finger pads to localize the digit activation foci. Major principal components from the muscle areas associated with the eigenvectors having 80% of the cumulative variance was used as a nuisance parameter for regression in both stimulation and resting state data. We used GLM analyses to evaluate stimulus driven activation using spm12. The voxel that exhibited the strongest response to stimuli (with peak t value) was used to define the seeds in area 3b for local voxel-wise correlation analysis in the upper three slices. The seed in the bottom layer was estimated based on the activation in the top two slices as we did not detect activations in most cases. Major and minor axis of the 2D ellipse at FWHM (full width at half maximum) was estimated using Gaussian fitting to the point spread function (PSF) and the area enclosed at half maximum were quantified. The statistical significance of difference between measures of each layer was evaluated using one-way analysis of variance (ANOVA1). The three estimated parameters in each layer were divided into two groups such as training and testing state to predict the layers using SVM. We performed supervised learning to train SVM (Support vector machine) to classify the layer specific parameters into two classes such as the upper layer (parameters estimated from the top slice) and lower layer (bottom two layers based on their similarity in observed parameters using one-way ANOVA1). The network was trained with 21 out of 29 resting state PSF parameters for each layer and then predicted the layers using the remaining PSF measures.Results and Discussion
Robust BOLD stimulus-evoked activations were consistently detected in top and middle layers (Fig.1A-B). 3D plot and contour maps at different r values of area 3b shows local correlation profiles around the seed in areas 3b and 1 (Fig. 1C). Group quantification of the activation maps (n= 3 animals, 12 runs) shows that the major axis of the top layer is significantly larger than that of middle layer and the minor axis of both top and middle layers (Fig 1D). The enclosed area is also larger for the top layer (Fig. 1E). In a resting state (n=29 runs), a similar inter-layer difference is observed. The major axis of correlation profiles of the top layer seed is significantly greater than those of middle and bottom layers and those minor axes of all three layers (Fig 1F). Table 1 summarizes the measures in both stimulation and resting states. In summary, we observed significant differences in layer specific spatial profiles (PSF) in both stimulation and resting states. The local activation and connectivity profiles were elongated only for the top layer of area 3b whereas those of middle and bottom layers seemed more circular. Resting state correlation profiles were less than 1 mm in extent, which sets the lower limit of the ability to resolve separate correlated regions.Acknowledgements
No acknowledgement found.References
1.Shi, Z., et al., High spatial correspondence at a columnar level between activation and resting state fMRI signals and local field potentials. Proc Natl Acad Sci U S A, 2017. 114(20): p. 5253-5258.Figures
Figure
1. (A-B) Tactile stimulus activation map (digit 2) overlaid on high-resolution
anatomic image top (A) and middle slice (B). (C) 3D Resting state connectivity
map using peak activation at area 3b. (D) Spatial extent of tactile stimulus in
area 3b (major and minor axes), FWHM of % BOLD signal. (E) Area enclosed (mm2)
at half maximum of the activation profile. (F-G) Corresponding measures of
spatial extent of resting state connectivity across three layer (F), and the
area enclosed at half maximum (G). The statistical significance of difference
in above parameters is represented by bar (* p < 0.05) using ANOVA1.