4657
Longitudinal Study Functional Reorganization within Resting-state Brain Networks in Subcortical Infarction Stroke Patients1Department of MRI, The First Affiliated Hospital of Zhengzhou University, Zhengzhou, China, 2GE Healthcare MR Research China, Beijing, China
Synopsis
In order to identify dynamic evolution model of functional reorganization in stroke patients during recovery process based on the large-scale brain network, eleven meaningful RSNs derived from resting-state data across four consecutive time points within six months in subcortical infarction stroke patients and healthy controls groups were identified using independent component analysis. The results revealed that stroke patients exhibited significantly dynamic functional connectivity changes in the right superior parietal lobule of the dorsal attention network and the cuneus of medial visual networks. Note that functional connectivity to some meaningful brain networks demonstrated consistent alterations over time. The findings may reflect the adaptive reorganization of the functional network in stroke patients.
Purpose
Numerous studies argue that cortical reorganization may contribute to the function restoration following stroke. In a previous study, we found the potential functional impairment and reorganization of large-scale brain networks in chronic stroke patients, however, the dynamic evolution of changes during the post-stroke reorganization remains to be further researched. This study sought to identify dynamic functional reorganization model of neurological rehabilitation during the stroke recovery process based on the large-scale brain network.
Method
Ten right-handed patients with subcortical ischemic stroke in the left hemisphere motor pathway (Fig 1), and twelve age-matched healthy controls were investigated to undergo imaging and behavioral tasks. All patients were first-onset stroke patients who showed motor deficits in both the upper and lower extremities. MR images were acquired using a 3.0 Tesla GE Discovery 750 MR scanner. Functional MRI data were obtained using a single-shot GRE-EPI sequence (TR/TE = 2000/41 ms; field of view = 220×220mm2; matrix = 64×64; flip angle = 90°; slice thickness = 4mm; 0.5mm gap; 32 slices; 190 time points). Anatomical images were acquired using a T1-weighted 3D SPGR sequence (TR/TE = 8.2/3.2 ms; FOV = 256×256 mm2; matrix = 256×256; slice thickness = 1.0 mm, no gap; 188 slices). Firstly, data were analyzed with standard preprocessed using SPM8 including removing the first 10 volumes, slice timing, head motion estimation, spatially normalization and spatial smoothing. Secondly, ICA was performed using the GICA program of the fMRI toolbox1 including three stages: (i) data reduction, (ii) application of the ICA algorithm, and (iii) back-reconstruction for each individual subject. Note that GICA was performed 100 times and obtained 25 independent components, 11 meaningful components of which were identified as RSNs via visual inspection. Then, each ICA component was acquired in a random-effect one-sample t-test using a FWE correction (P < 0.05) and a cluster size of 100 voxels to generate a sample-specific spatial map for each component. Finally, The group differences within the networks were compared using one way ANOVA-within subject manner. Multiple comparisons were corrected using a Monte Carlo simulation, resulting in a corrected threshold of P < 0.05 and a cluster size of at least 20 voxels. The intra-network functional connectivity of each region of interest that showed significant group differences were extracted and compared between groups using a general linear model with age and sex as covariates of no interest.Result
Eleven RSNs2 were identified via the Subject Order Independent Group ICA method. The RSNs were the ventral (vSMN) and dorsal (dSMN) SMNs, the medial (mVN) and lateral (lVN) visual networks, the auditory network (AN), the dorsal attention network (DAN), the anterior (aDMN) and posterior (pDMN) DMNs, the left (lFPN) and right (rFPN) FPNs, and Salience network (SN) (Fig2). Stroke patients exhibited significantly dynamic functional connectivity changes in the right superior parietal lobule of the DMN (Fig 3A) and the cuneus of mVN (Fig 3B). First, compared the healthy subjects, the stroke patients displayed significantly decreased intra-network FCs within one week, and on first month the functional connectivity was significantly increased, then the functional connectivity of stroke patients were gradually decreasing from first month to sixth month, and there were no significantly group differences between stroke patients and healthy controls on sixth month.Discussion
In the current study, we used ICA to investigate the altered network reorganization during stroke recovery. We observed the dynamic evolution model of network reorganization beyond the motor system, which in multiple functional networks over time during stroke recovery process. To our knowledge, the brain is a complex network consisting of multiple subnetworks serving different functions. The subcortical lesion may impair a certain subnetwork, thus affecting the functional organization of the subnetworks. In the study, the results may reflect the adaptive reorganization of the functional network in stroke patients.Conclusion
In conclusion, this study suggests that multiple function networks underwent dynamic reorganization during stroke recovery after motor pathway subcortical stroke. The stroke patients displayed that increased functional connectivity within one week after stroke and then gradually decreased, which may be predictive of the impairment and restoration evolution model of function over time. Taken together, the study expands our understanding of the lesion-induced network plasticity model occurring in the brain.Acknowledgements
This study was supported by the Natural Science Foundation of China (Nos. 81601467)References
1. Zhang H, Zuo XN, Ma SY, Zang YF, Milham MP, Zhu CZ. Subject order-independent group ICA (SOI-GICA) for functional MRI data analysis. Neuroimage 2010; 51: 1414–1424.
2. Smith SM, Fox PT, Miller KL, Glahn DC, Fox PM, Mackay CE et al. Correspondence of the brain’s functional architecture during activation and rest. Proc Natl Acad Sci USA 2009; 106: 13040–13045.
Figures
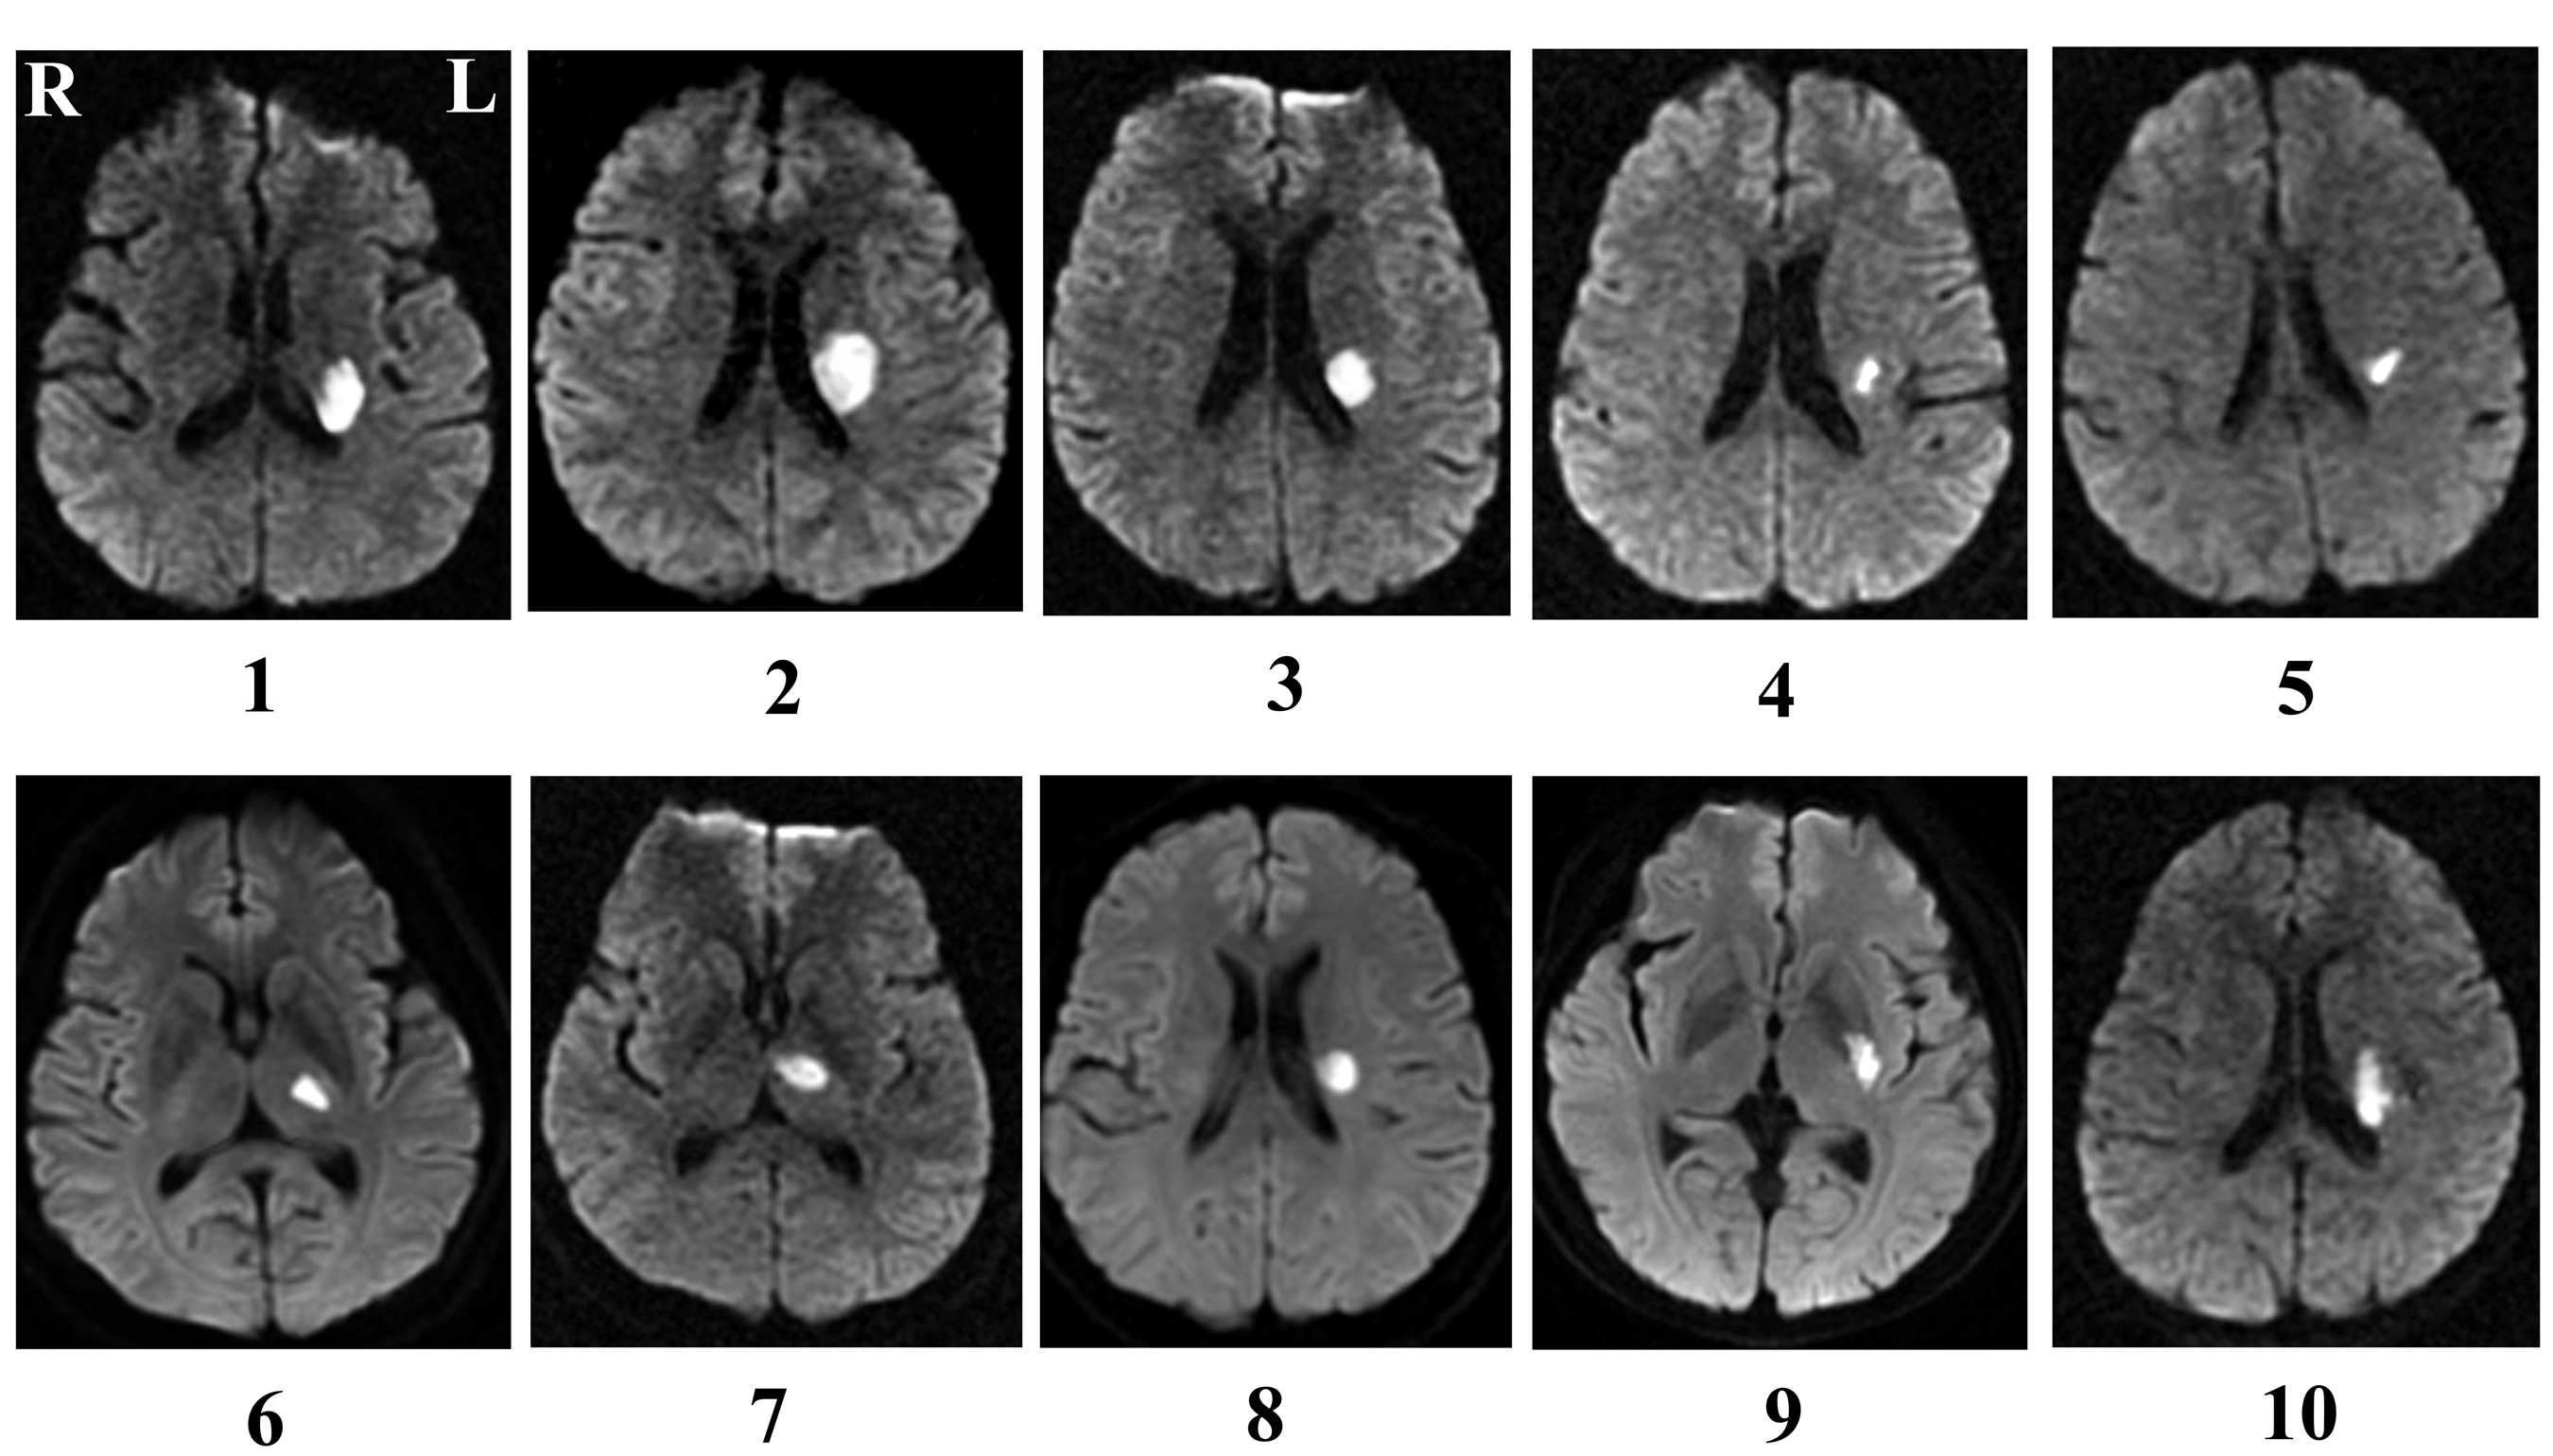
Fig 1: Lesion locations map of patients with stroke
Lesion locations of stroke patients are displayed on axial slices of diffusion-weighted images. The panel shows the slice with maximum infarct volume.
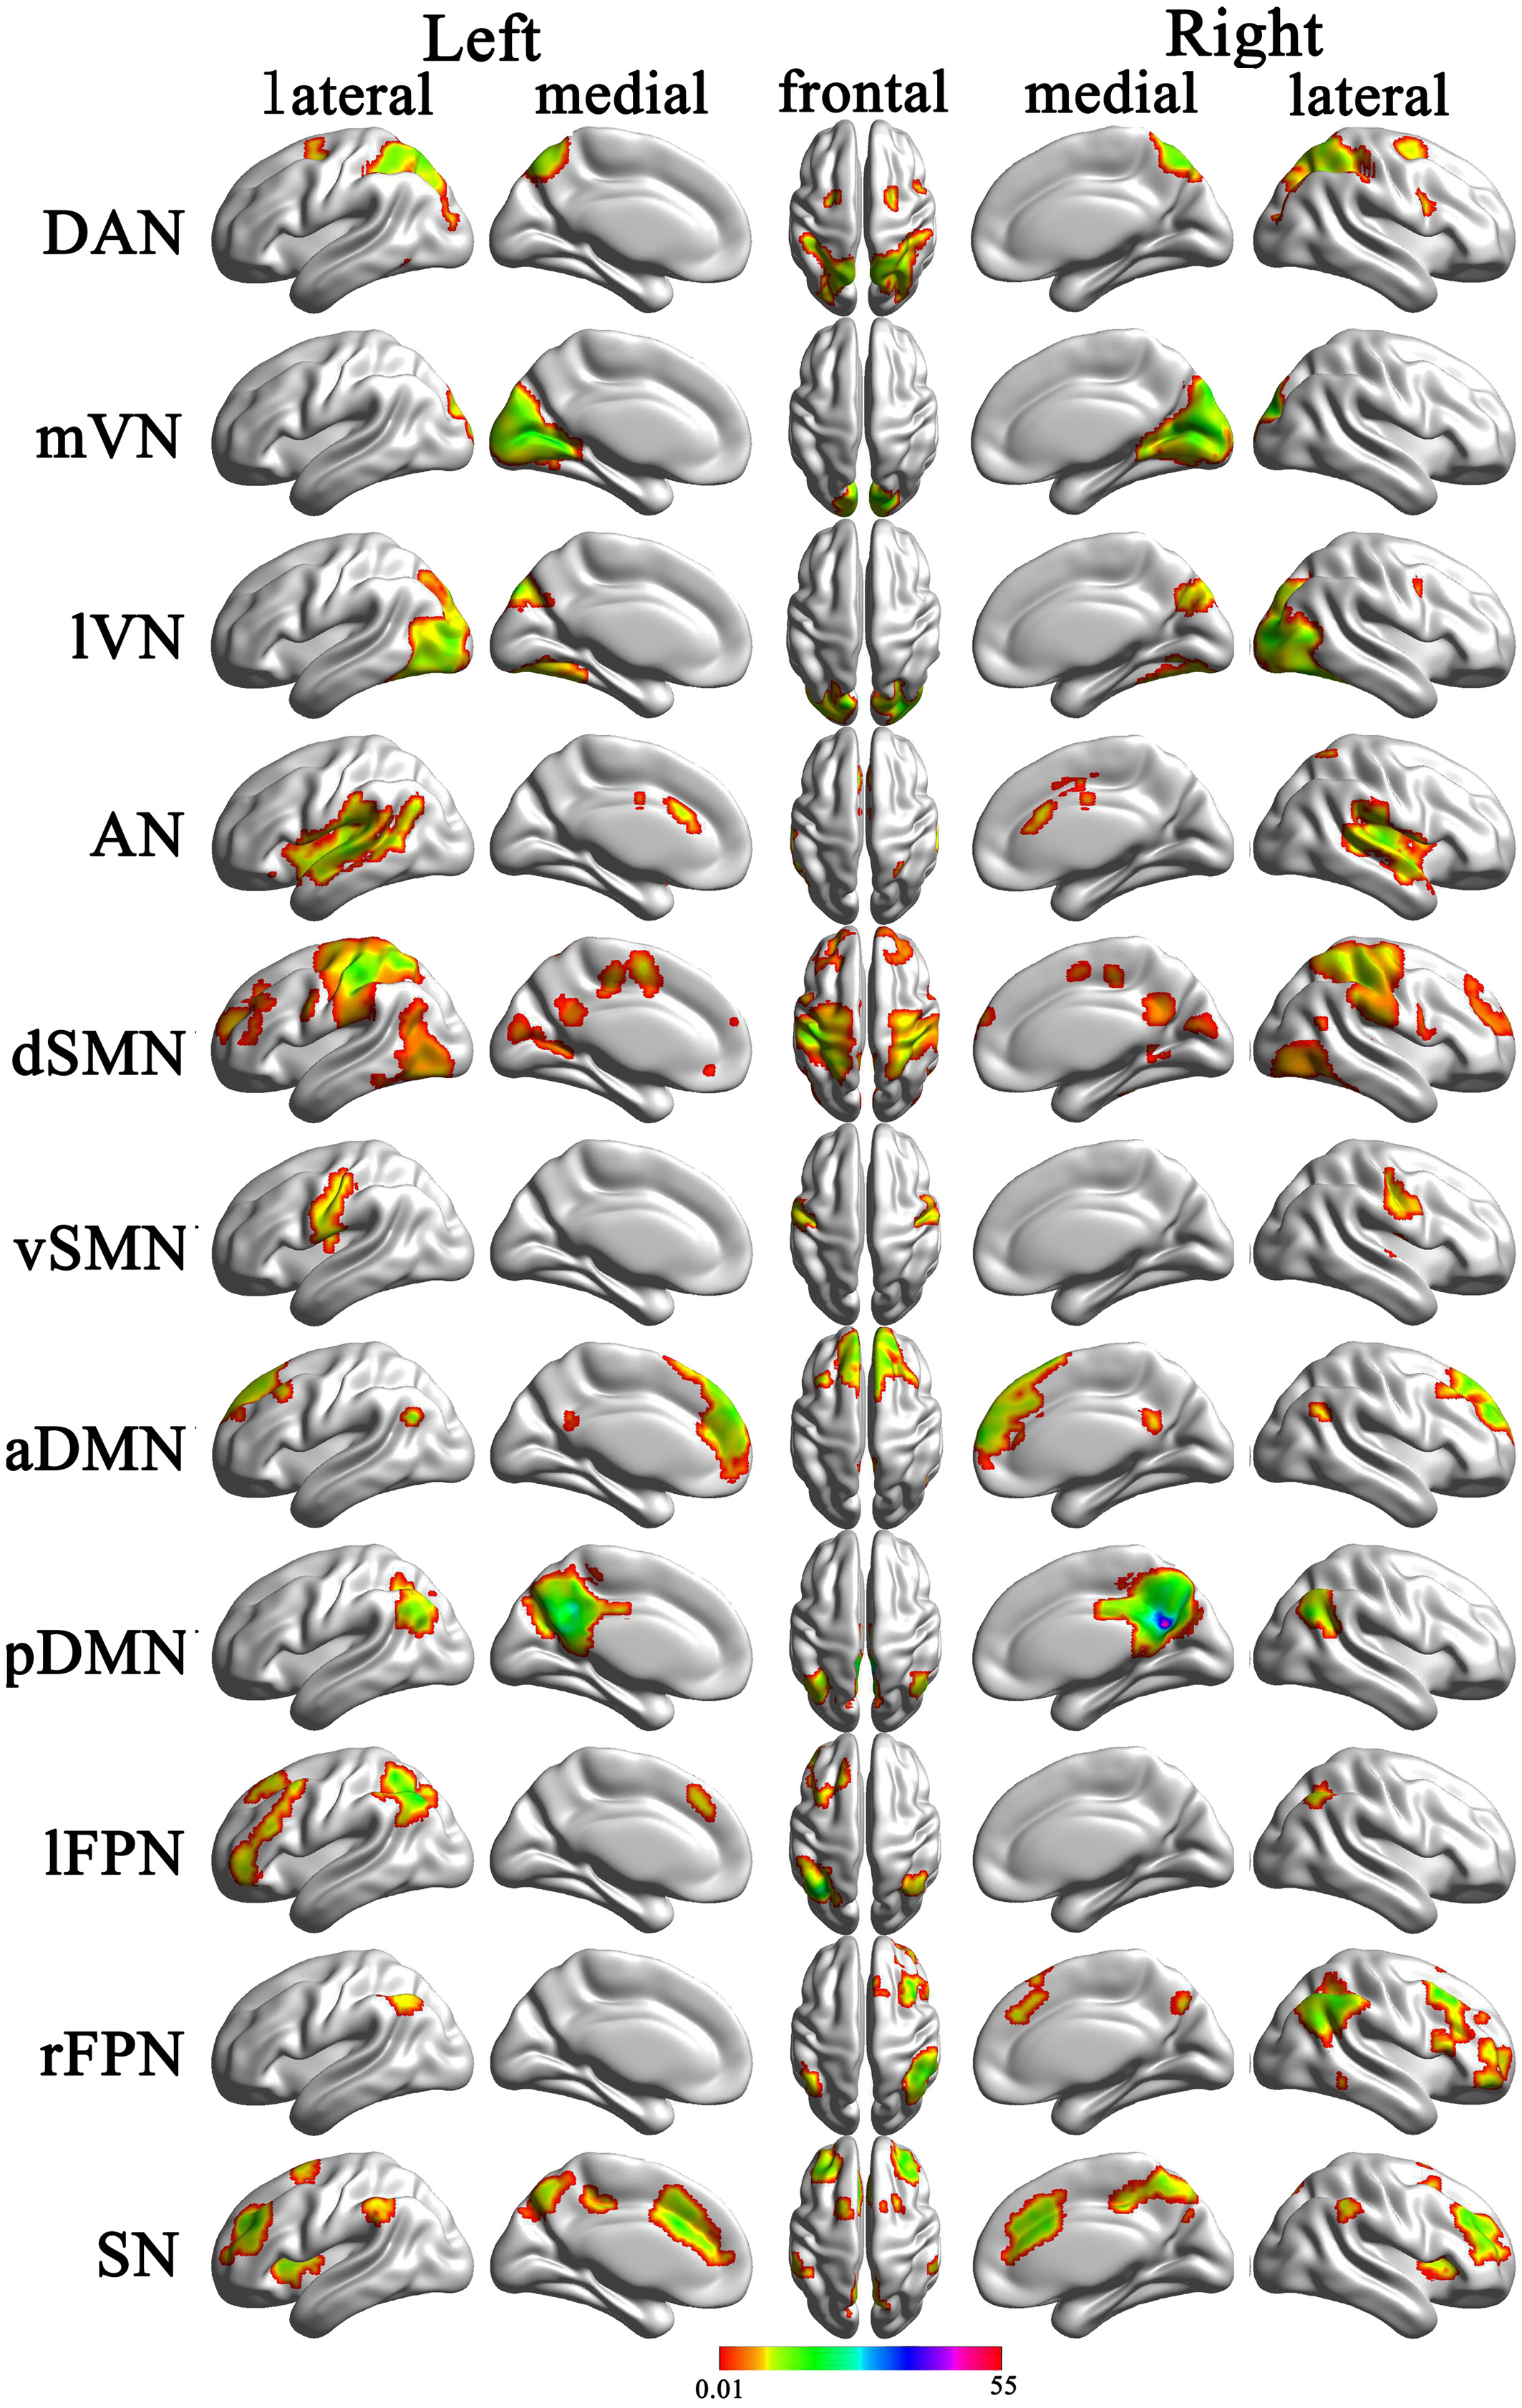
Fig 2: Cortical representation of the resting state networks (RSNs) identified by independent component analysis
Data are displayed on the lateral and medial surfaces of the left and right hemispheres of a brain surface map. The color scale represents the t values in each RSN. aDMN, anterior default mode network; AN, auditory network; DAN, dorsal attention network; dSMN, dorsal sensorimotor network; lFPN, left frontoparietal network; lVN, lateral visual network; mVN, medial visual network; pDMN, posterior default mode network; rFPN, right frontoparietal network; SN, salience network; vSMN, ventral sensorimotor network.
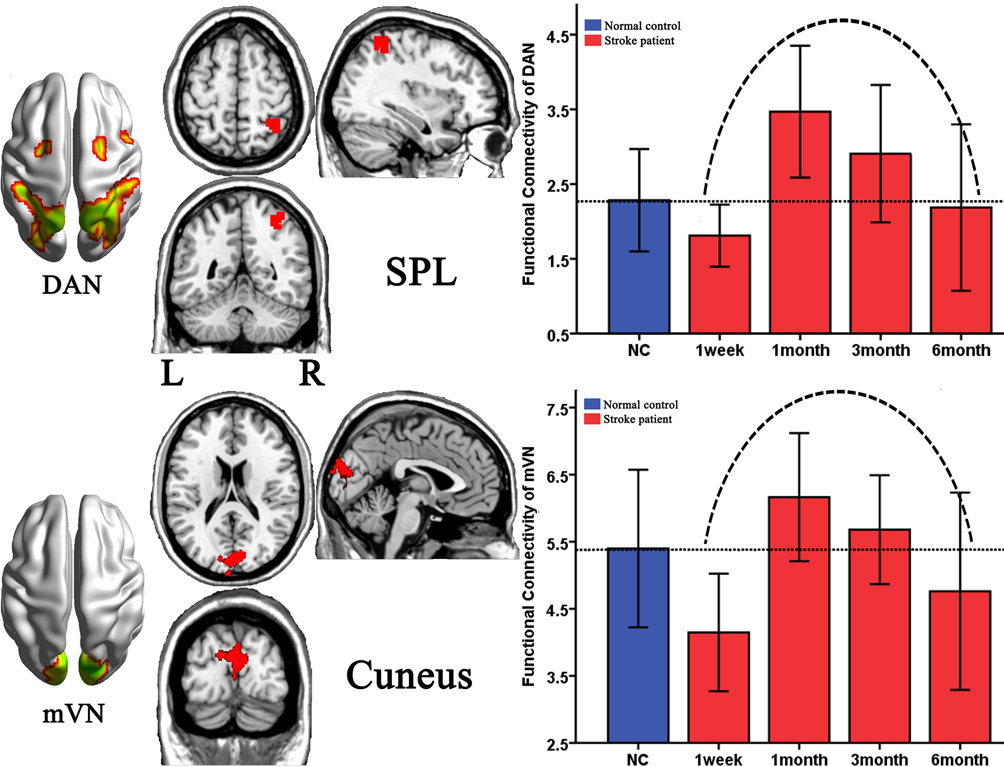
Fig 3: Brain regions with dynamic altered functional network over the time during stroke recovery
DAN, dorsal attention network; mVN, medial visual network; SPL, superior parietal lobule