4656
Frequency preference and tuning width dependent intrinsic functional connectivity within and across cortical depths in the human auditory cortex1Institute of Biomedical Engineering, National Taiwan University, Taipei, Taiwan, 2Institute of Applied Physics, National Chengchi University, Taipei, Taiwan, 3Institute of Neuroscience, National Yang Ming University, Taipei, Taiwan, 4Department of Neuroscience and Biomedical Engineering, Aalto University, Espoo, Finland
Synopsis
This study revealed the frequency preference as well as tuning width dependent intrinsic functional connectivity (iFC) within and across cortical depths in the human auditory cortex. We demonstrated that both the within-depth and cross-depth feature dependent iFC have a higher selectivity in the core than noncore region as we moved from superficial to deep cortical depths. We also found that the selectivity of cross-depth feature dependent iFC decreases when two cortical depths were farther away from each other. Taken together, our findings provide the direct evidence of a cortical depth specific feature dependent iFC in the human auditory cortex.
Introduction
At early stages of auditory processing, acoustic stimuli are decomposed into components at separate frequency bands1, and transmitted from the periphery to the cortex in spatially segregated channels2. This processing is supported by a topographic organization at the auditory cortical surface, where neural ensembles with similar frequency preference3-5 or spectral tuning6-8 are spatially clustered. However, sound should not only be processed in separate frequency bands, because information needs to be integrated to be meaningful. Previous studies showed that integrating information may be facilitated by feature dependent anatomical9,10 and functional connections11-13, where neurons with similar functional properties were connected to each other. Concerting with diverse anatomical connections across auditory laminar layers14-16, electrophysiological recordings reported laminar layer specific functional connectivity patterns in the cat auditory cortex17-19. However, how auditory information is integrated across cortical depths in human remains unclear. Using a tailored RF receiver array20 and surface-based laminar depth analysis21, here we specifically examined how iFC depends on the difference in frequency preference and tuning width within and across cortical depths, respectively, at both core and noncore regions of the human auditory cortex.
Methods
Twenty healthy participants joined this study with written informed consents after the approval of the Institute Reviewing Board. All data were acquired on a 3T MRI (Skyra, Siemens). Structural and functional images were acquired with a 1-mm isotropic resolution MPRAGE and a 1.5-mm isotropic resolution gradient-echo EPI sequence, respectively. Following previously published procedures20, we presented participants with a tone chirp auditory stimuli, and did the phase-encoded frequency preference and tuning width mapping at each cortical depth. iFC was computed as Pearson’s correlation of the residual fMRI signal at each cortical location. To obtain the iFC as a function of frequency preference difference, correlation as calculated between voxel pairs with the difference between their preferred frequencies matched to a specified Δ frequency, which were then binned with bin edges of 0, 0.125, 0.25, 0.5, 1, and 2 octaves. We quantified the selectivity of iFC by the time constant (λ) of an exponential decay model fitted to Δ frequency-iFC data. λ's were calculated for each cortical depth separately. The Δ tuning width-iFC data was similarly calculated. The cross-depth iFC was also estimated by data from different cortical depths.Results
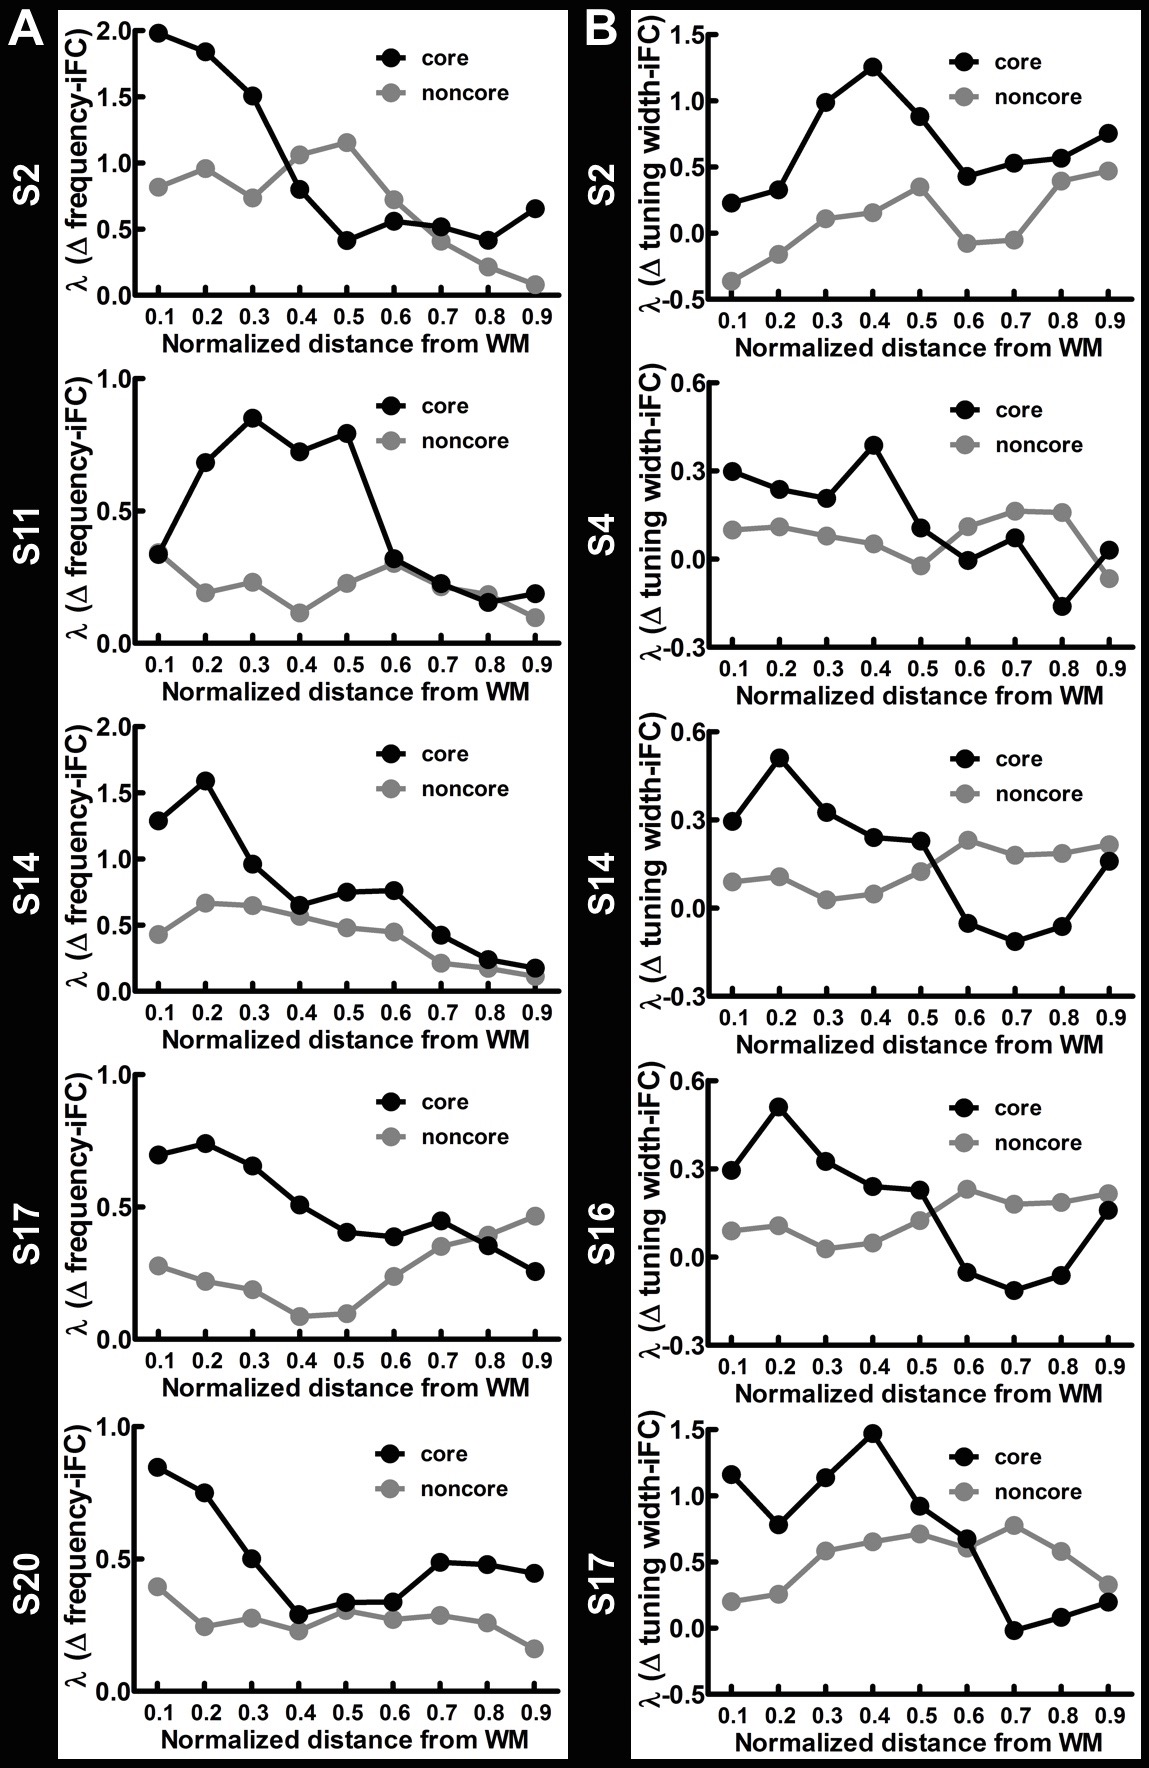
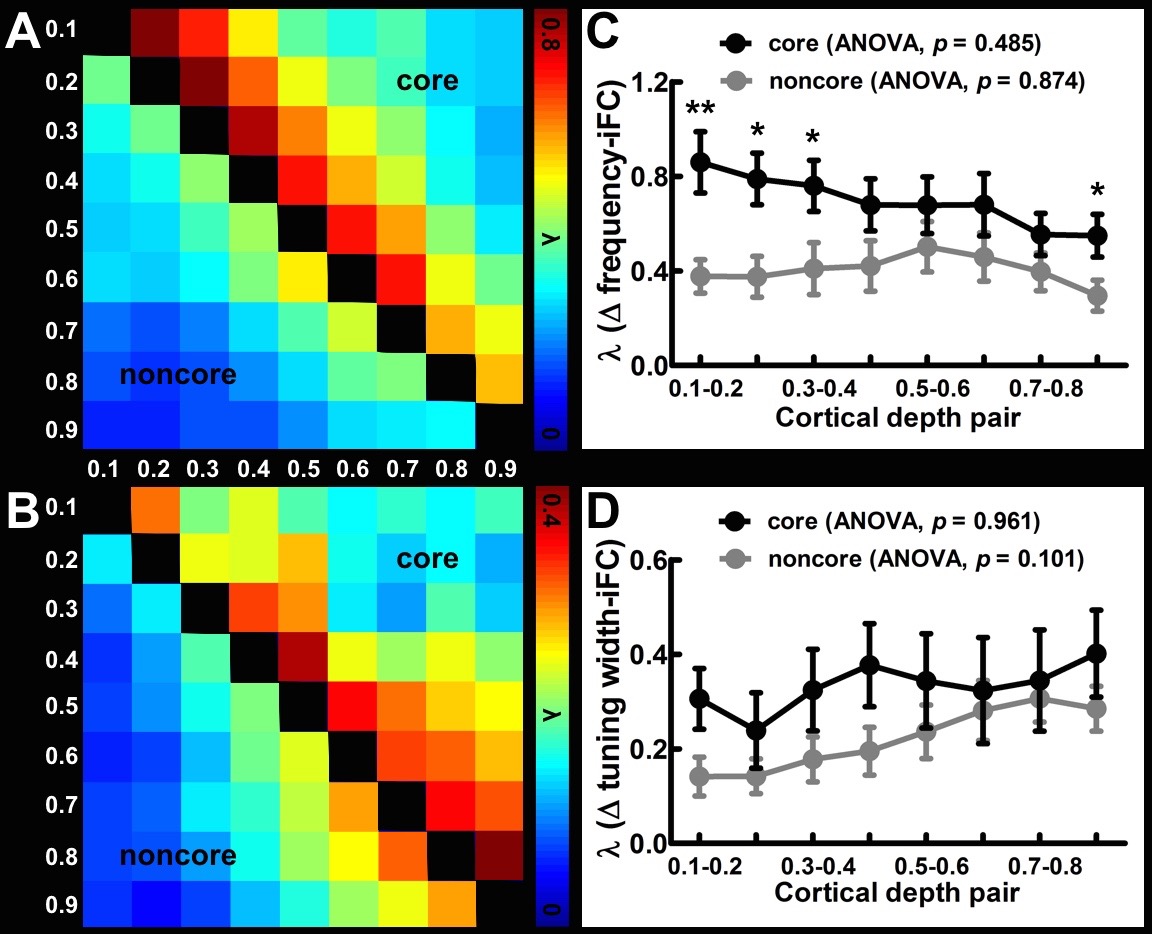
Figure 1A shows the within-depth iFC as a function of difference in the frequency preference. iFC significantly decreased as Δ frequency increased in both core and noncore regions at all depths (Page’s trend test: p < 0.0001). Figure 1B shows λ’ s fitted to Δ frequency-iFC data. Quantitatively, while the selectivity of frequency dependent iFC was constant across depths in the noncore region, it varied significantly across depths in the core region. In particular, the maximum λ (highest selectivity) was found at deep depth. The selectivity of frequency dependent iFC was significantly higher in the core than noncore region at deep and relatively deep intermediate depths, while one of the superficial depths also shows a significant difference. Figure 2A shows the Δ tuning width-iFC data. iFC significantly decreased as Δ tuning width increased in both core and noncore regions and at all depths (Figure 2A, Page’s trend test: p < 0.0001). The selectivity of tuning width dependent iFC was significantly higher in the core than noncore region only at deep depths (Figure 2B). Figure 3 shows the selectivity of within-depth feature dependent iFC from five representative participants, demonstrated the consistency of results in individual participants. Furthermore, we analyzed cross-depth iFC. Figure 4A and B shows λ’ s fitted to Δ frequency- and Δ tuning width-iFC data between distinct depths, respectively. The selectivity of cross-depth feature dependent iFC decreased as the distance between two cortical depths increases. Figure 4C and D shows how λ from neighboring depth pairs varied across cortical depths. Similarly, the selectivity of frequency dependent iFC was significantly higher in the core than noncore region at deep and one of the superficial depth pairs.Discussion
This study delineated the functional connectivity within and across cortical depths in the human auditory cortex. Our results corroborated with electrophysiological animal studies17,19 by demonstrating a stronger selectivity of both within-depth and cross-depth feature dependent iFC in the core region than in the noncore region as we moved from superficial to deep cortical depths. Additionally, we found that the selectivity of cross-depth feature dependent iFC decreased when two cortical depths were farther away from each other. These findings thus pave the way to unravel neuronal mechanisms of the acoustic information integration in the human auditory cortex using non-invasive measurements.Acknowledgements
This work was partially supported by Ministry of Science and Technology, Taiwan (103-2628-B-002-002-MY3, 105-2221-E-002-104), and the Academy of Finland (No. 298131).References
1. Robles L, Ruggero MA. Mechanics of the mammalian cochlea. Physiol Rev. 2001;81(3):1305-1352.
2. King AJ, Nelken I. Unraveling the principles of auditory cortical processing: can we learn from the visual system? Nat Neurosci. 2009;12(6):698-701.
3. Merzenich MM, Brugge JF. Representation of the cochlear partition of the superior temporal plane of the macaque monkey. Brain Res. 1973;50(2):275-296.
4. Formisano E, Kim DS, Di Salle F, van de Moortele PF, Ugurbil K, Goebel R. Mirror-symmetric tonotopic maps in human primary auditory cortex. Neuron. 2003;40(4):859-869.
5. Humphries C, Liebenthal E, Binder JR. Tonotopic organization of human auditory cortex. Neuroimage. 2010;50(3):1202-1211.
6. Rauschecker JP, Tian B, Hauser M. Processing of complex sounds in the macaque nonprimary auditory cortex. Science. 1995;268(5207):111-114.
7. Wessinger CM, VanMeter J, Tian B, Lare JV, Pekar J, Rauschecker JP. Hierarchical organization of the human auditory cortex revealed by functional magnetic resonance imaging. J Cogn Neurosci. 2001;13(1):1-7.
8. Moerel M, De Martino F, Formisano E. Processing of natural sounds in human auditory cortex: tonotopy, spectral tuning, and relation to voice sensitivity. J Neurosci. 2012;32(41):14205-14216.
9. Reale RA, Brugge JF, Feng JZ. Geometry and orientation of neuronal processes in cat primary auditory cortex (AI) related to characteristic-frequency maps. Proc Natl Acad Sci USA. 1983;80(17):5449-5453.
10. Read HL, Winer JA, Schreiner CE. Modular organization of intrinsic connections associated with spectral tuning in cat auditory cortex. Proc Natl Acad Sci USA. 2001;98(14):8042-8047.
11. Rothschild G, Nelken I, Mizrahi A. Functional organization and population dynamics in the mouse primary auditory cortex. Nat Neurosci. 2010;13(3):353-360.
12. Fukushima M, Saunders RC, Leopold DA, Mishkin M, Averbeck BB. Spontaneous high-gamma band activity reflects functional organization of auditory cortex in the awake macaque. Neuron. 2012;74(5):899-910.
13. Cha K, Zatorre RJ, Schönwiesner M. Frequency selectivity of voxel-by-voxel functional connectivity in human auditory cortex. Cereb Cortex. 2016;26(1):211-224.
14. Mitani A, Shimokouchi M. Neuronal connections in the primary auditory cortex: an electrophysiological study in the cat. J Comp Neurol. 1985;235(4):417-429.
15. Matsubara JA, Phillips DP. Intracortical connections and their physiological correlates in the primary auditory cortex (AI) of the cat. J Comp Neurol. 1988;268(1):38-48.
16. Wallace MN, Kitzes LM, Jones EG. Intrinsic inter- and intralaminar connections and their relationship to the tonotopic map in cat primary auditory cortex. Exp Brain Res. 1991;86(3):527-544.
17. Atencio CA, Schreiner CE. Columnar connectivity and laminar processing in cat primary auditory cortex. PLoS One. 2010;5(3):e9521.
18. Atencio CA, Schreiner CE. Auditory cortical local subnetworks are characterized by sharply synchronous activity. J Neurosci. 2013;33(47):18503-18514.
19. Atencio CA, Schreiner CE. Functional congruity in local auditory cortical microcircuits. Neuroscience. 2016;316:402-419.
20. Wu PY, Chu YH, Lin JL, Tsai SY, Kuo WJ, Lin FH. Characterization of laminar profiles in human auditory cortex using a dense 24-channel temporal lobe array at 3T. Proc ISMRM 25th. 2017:5243 [abstract].
21. Polimeni JR, Fischl B, Greve DN, Wald LL. Laminar analysis of 7 T BOLD using an imposed spatial activation pattern in human V1. Neuroimage. 2010;52(4):1334-1346.
Figures