4654
Tract-specific footprint of functional interhemispheric connectivity in the brain1Donders Institute for Brain, Cognition and Behaviour, Department of Anatomy, Radboud University Medical Centre, Nijmegen, Netherlands, 2Wellcome Centre for Integrative Neuroimaging, FMRIB, Nuffield Department of Clinical Neurosciences, University of Oxford, Oxford, United Kingdom
Synopsis
Linking the anatomy of neuronal connections to brain function is fundamental to our understanding of how brain architecture underpins human cognition. In this work, we hypothesized that the microstructural features of a white matter pathway relate to functional connectivity between the brain regions it connects. In a large cohort of subjects from UK Biobank, we demonstrate that the functional connectivity of homotopic brain regions from the two hemispheres can be predicted from the microstructure of the tract that connects them.
Introduction
Interhemispheric connections in the human brain are established by commissural fibres, which run primarily via the corpus callosum. In this study, we combined functional and diffusion MRI to study the relationship between functional connectivity (FC) of homotopic pairs (i.e. the same region in both hemispheres) and tract-specific features of the neuronal pathways connecting these areas. Although these concepts are fundamentally linked to each other, there is surprisingly little literature demonstrating the ability to directly relate functional and structural connectivity in the human brain. Nevertheless, a number of functionally relevant features in white matter are known to alter the diffusion MRI signal. For example, fractional anisotropy (FA) is influenced by axon density, size and myelination1. Here, we test the hypothesis that there is a footprint that can be found in the FC that reflects microstructure of the tract underlying this connection. We not only demonstrate such a link between FC and tract microstructure, but further show that this link is driven by the unique microstructural footprint of the given tract.Methods
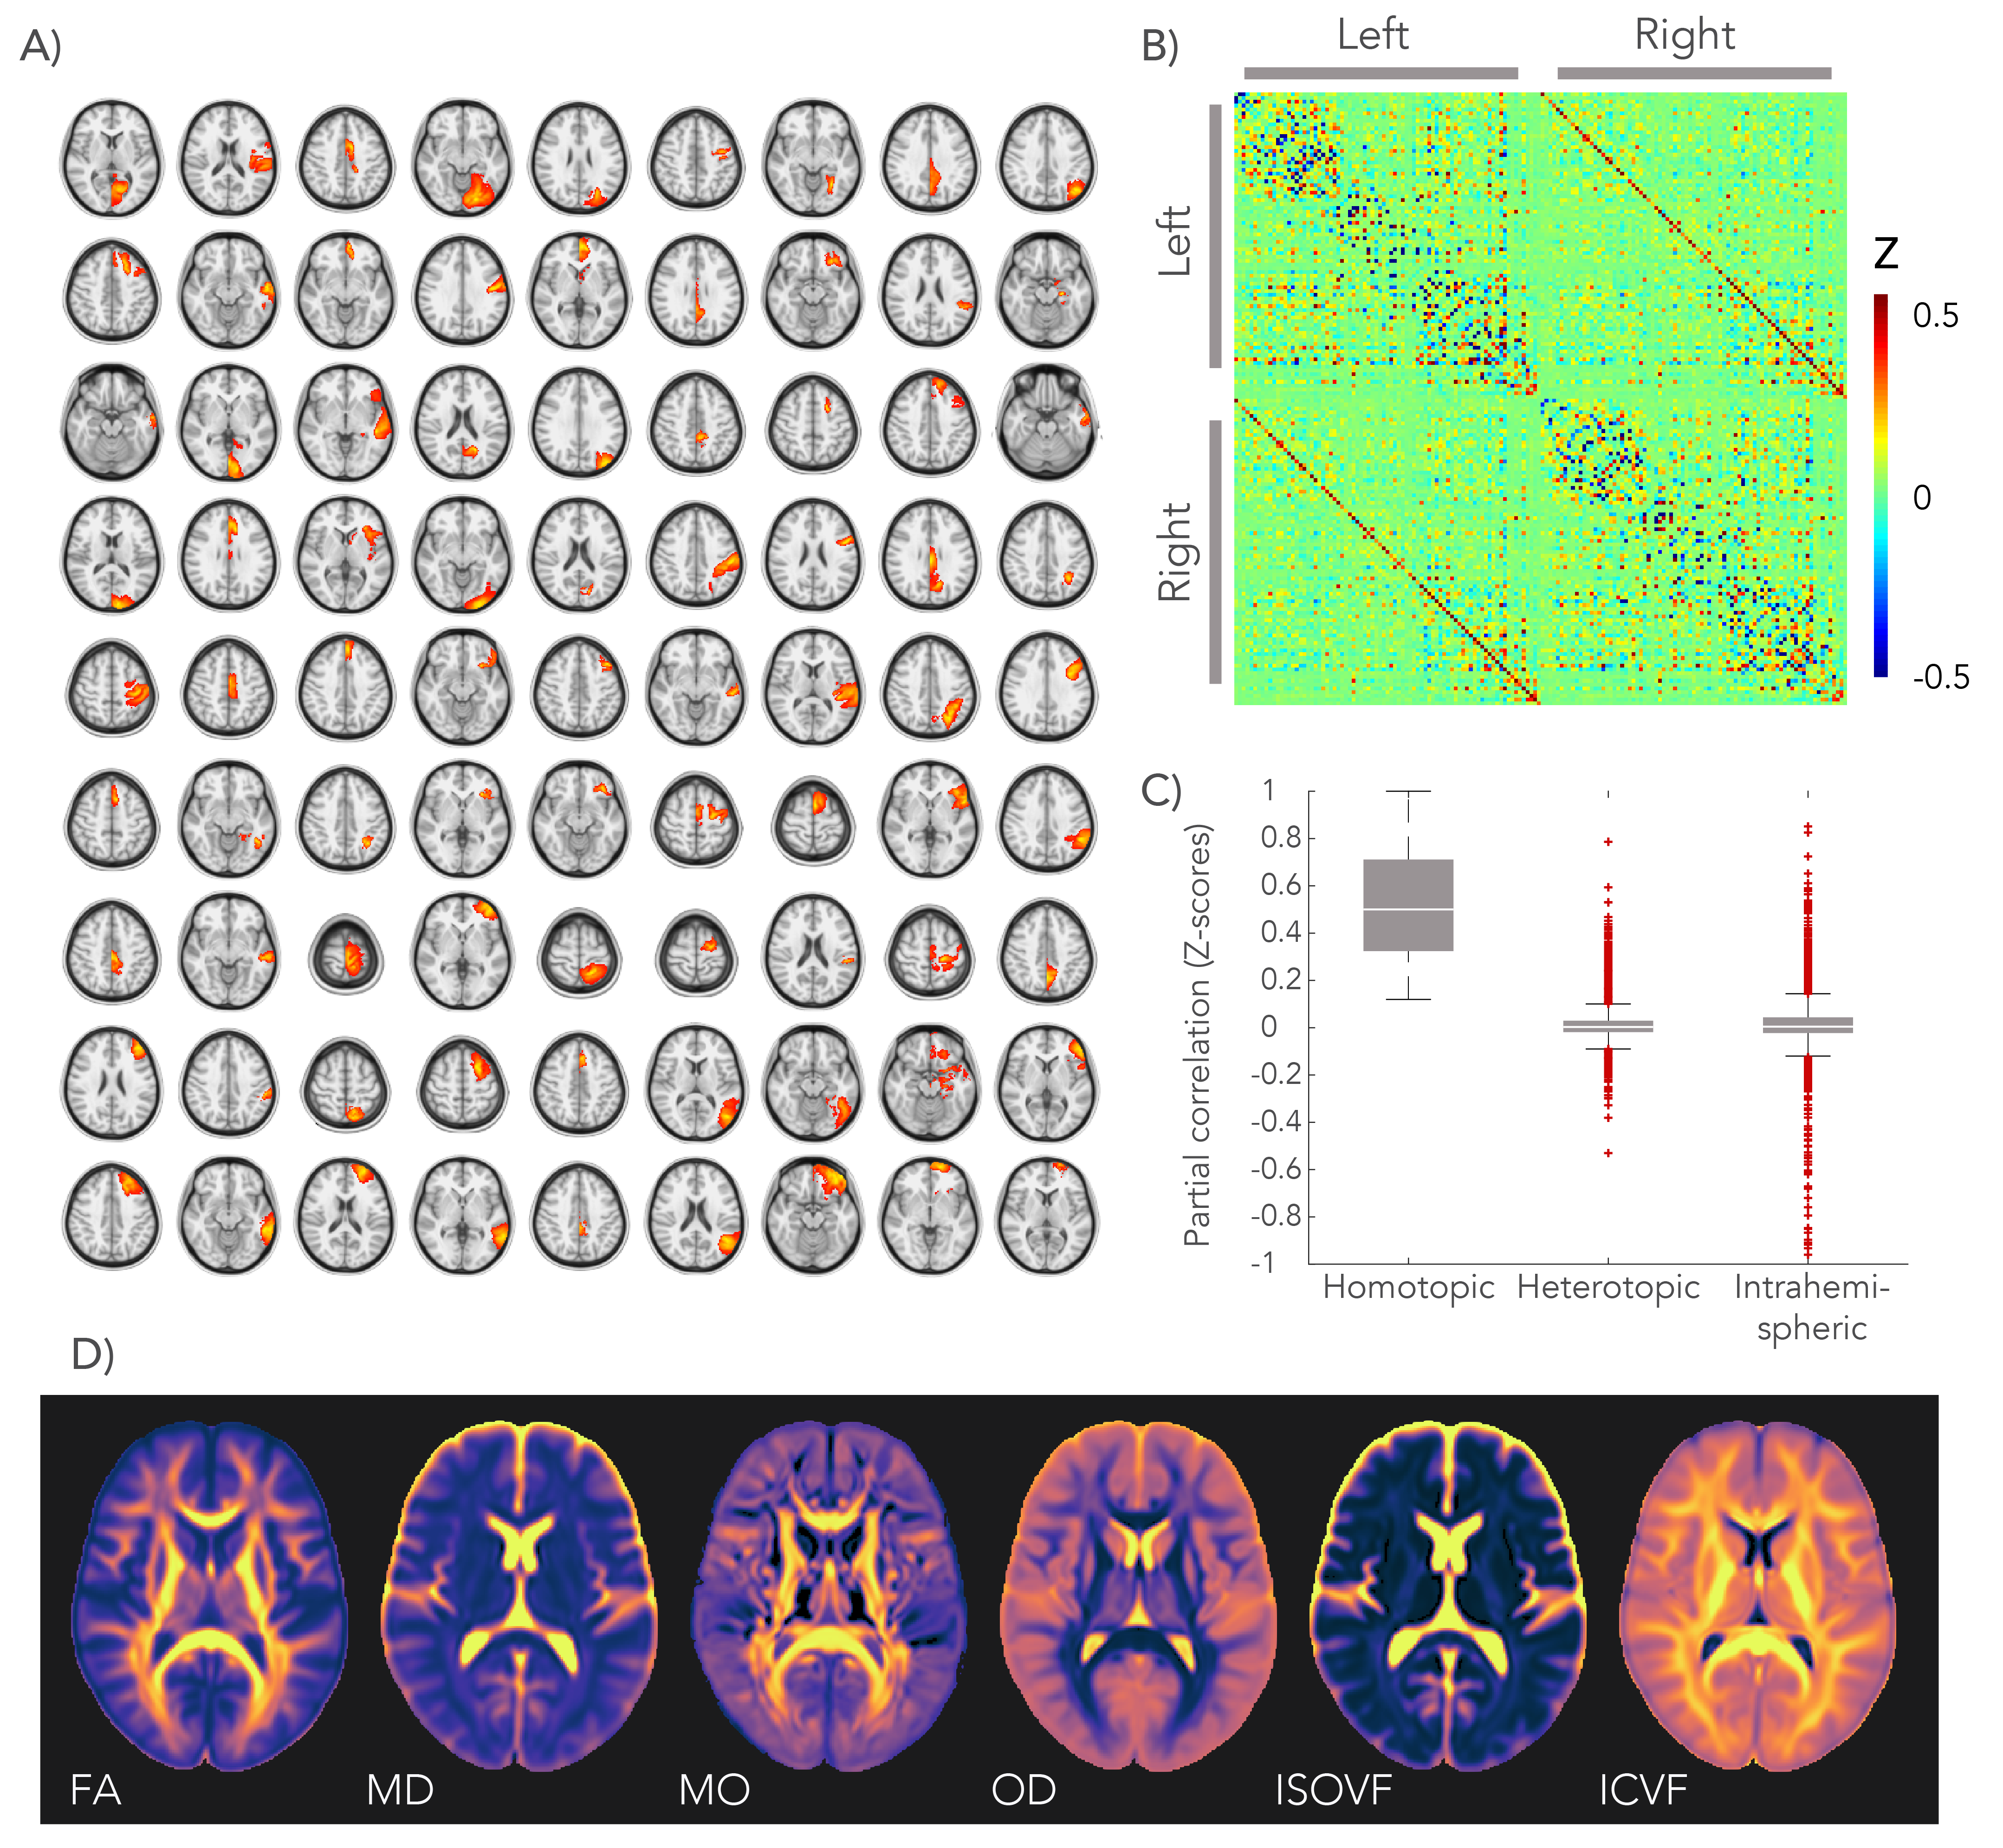
We analysed diffusion MRI and resting-state fMRI data from 4903 subjects in the UK Biobank project2. A group-average decomposition of FC using ICA yielded 55 components. A total of 81 homotopic pairs were obtained by splitting the ICA components for each hemisphere and separating non-contiguous areas (Figure 1.A). FC was computed with partial correlation using the regions’ average time-series (Figure 1.B).
The microstructural metrics were estimated from the diffusion MRI data using the diffusion tensor and the NODDI models. We used the following metrics: FA, mean diffusivity (MD), tensor mode (MO), orientation dispersion (OD), isotropic volume-fraction (IsoVF), and intracellular volume-fraction (ICVF). All metrics were projected onto a white matter skeleton using TBSS4.
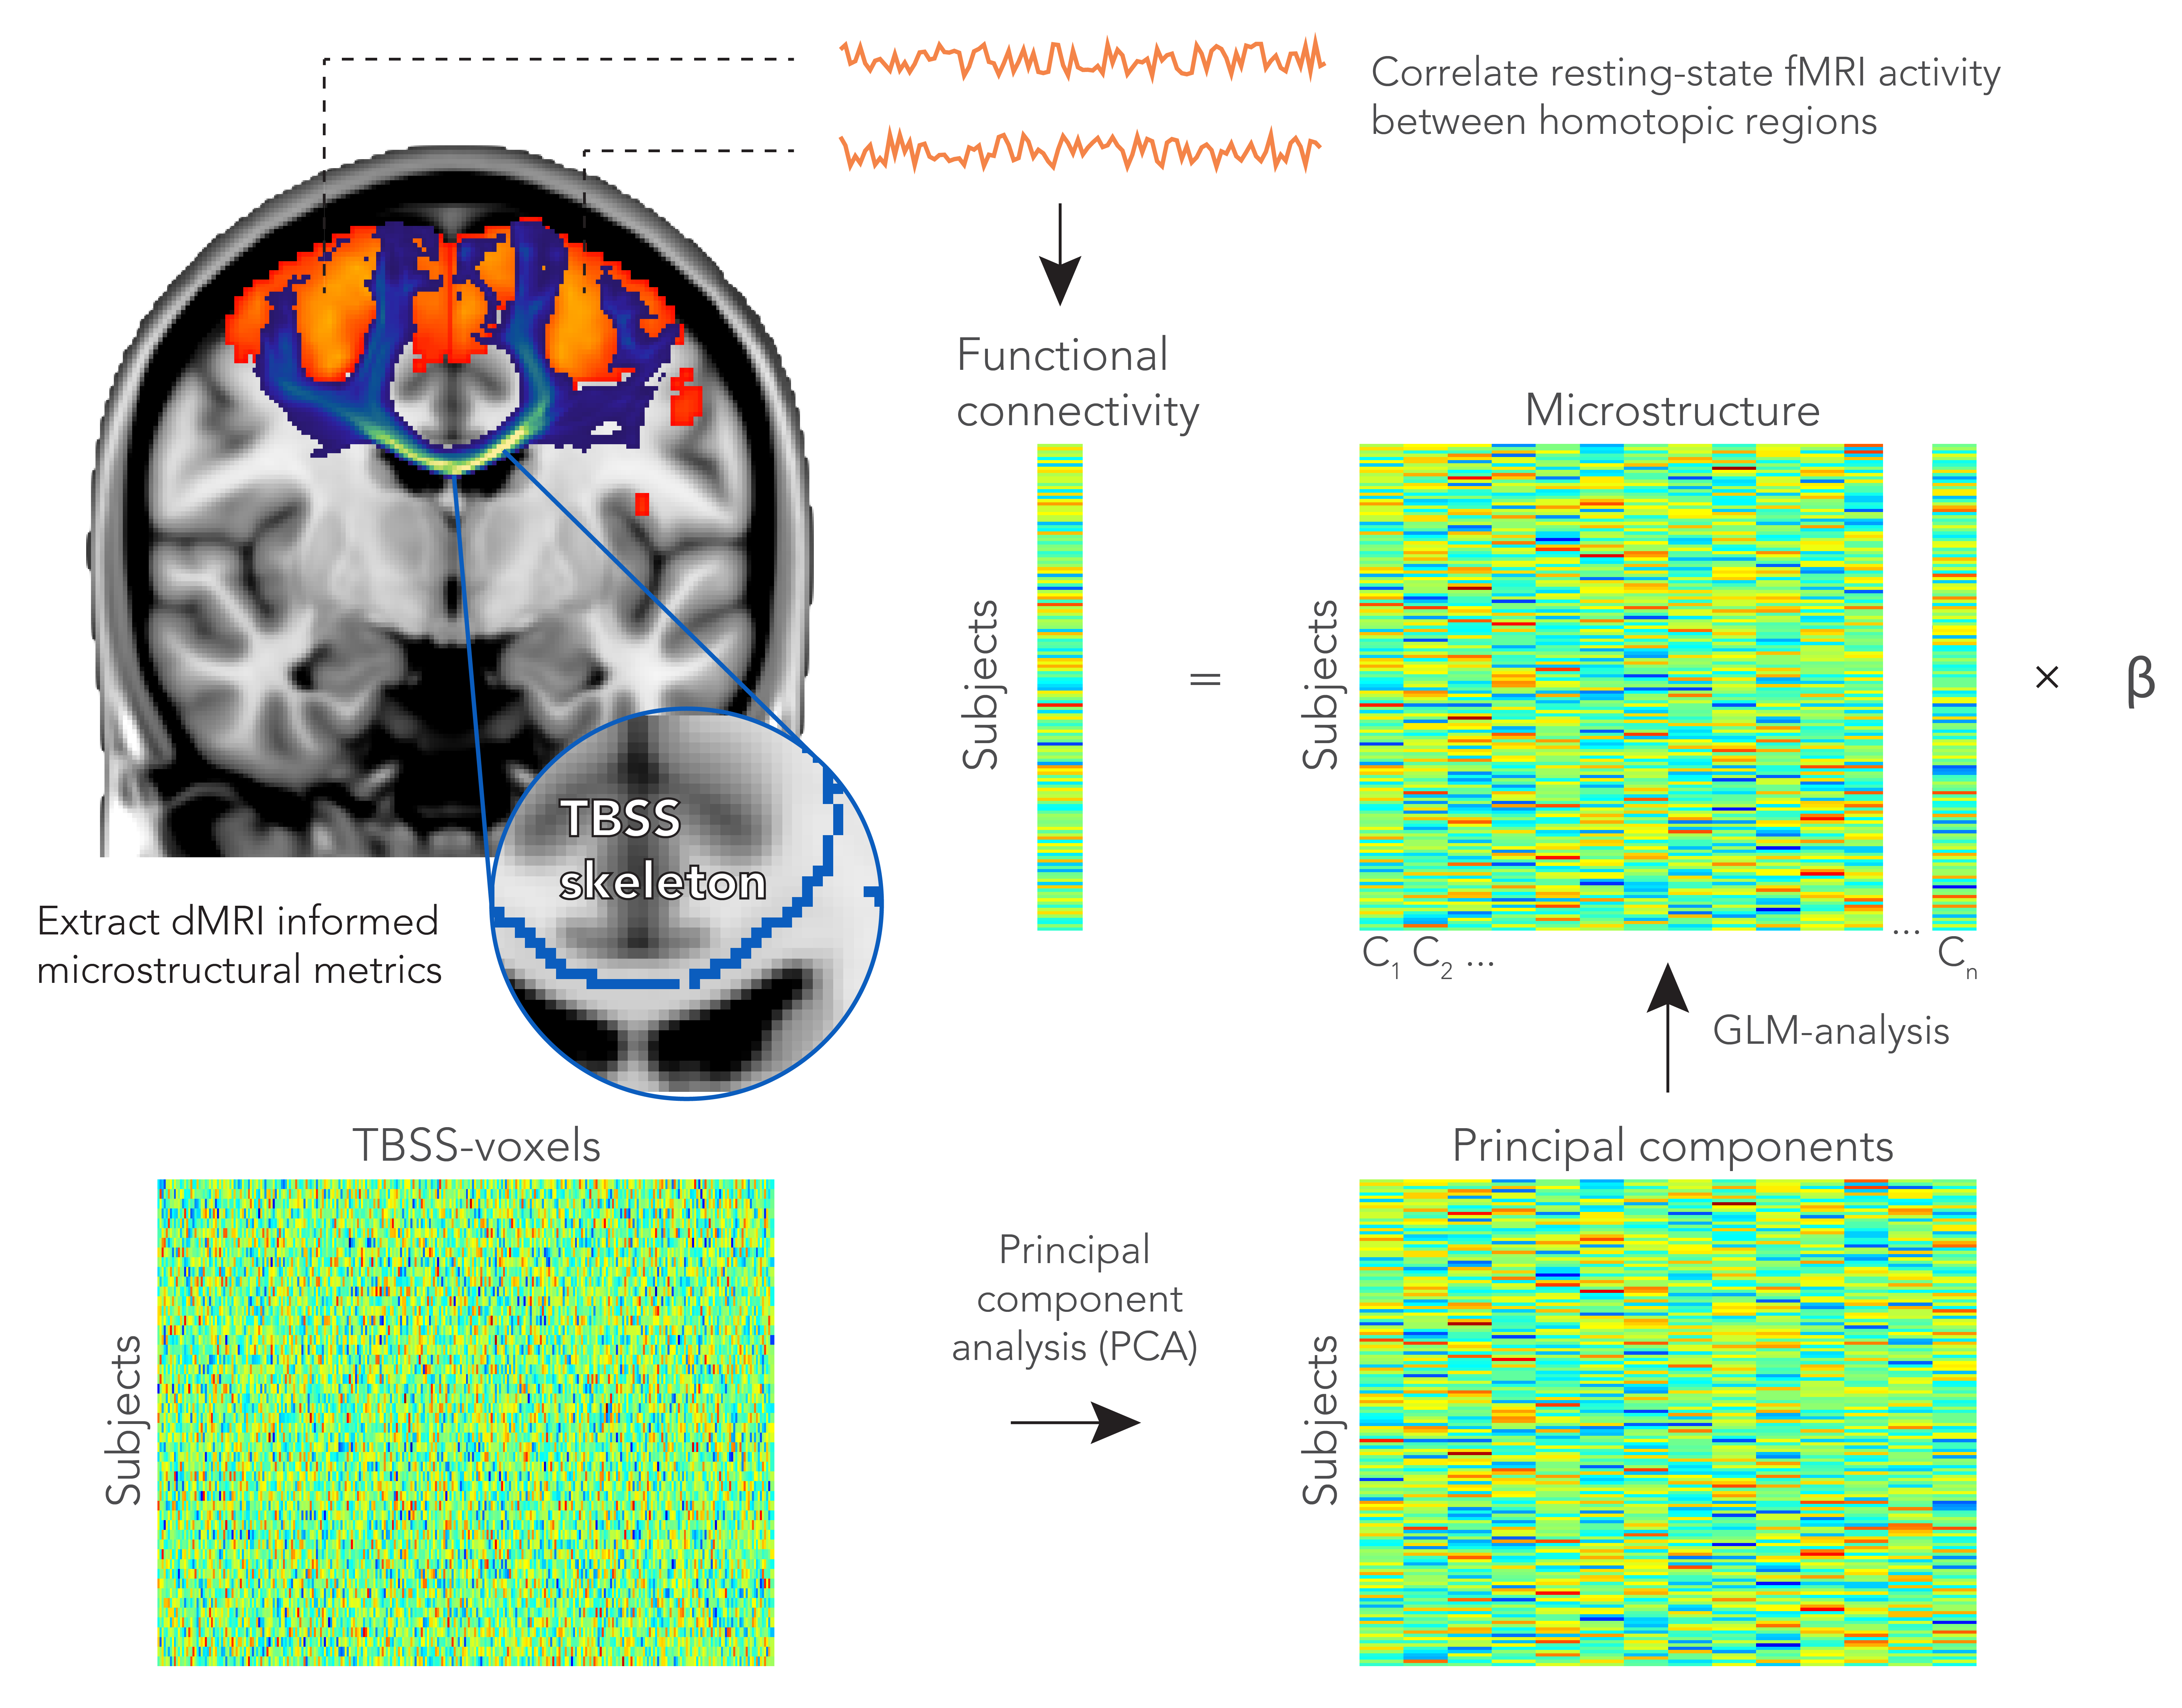
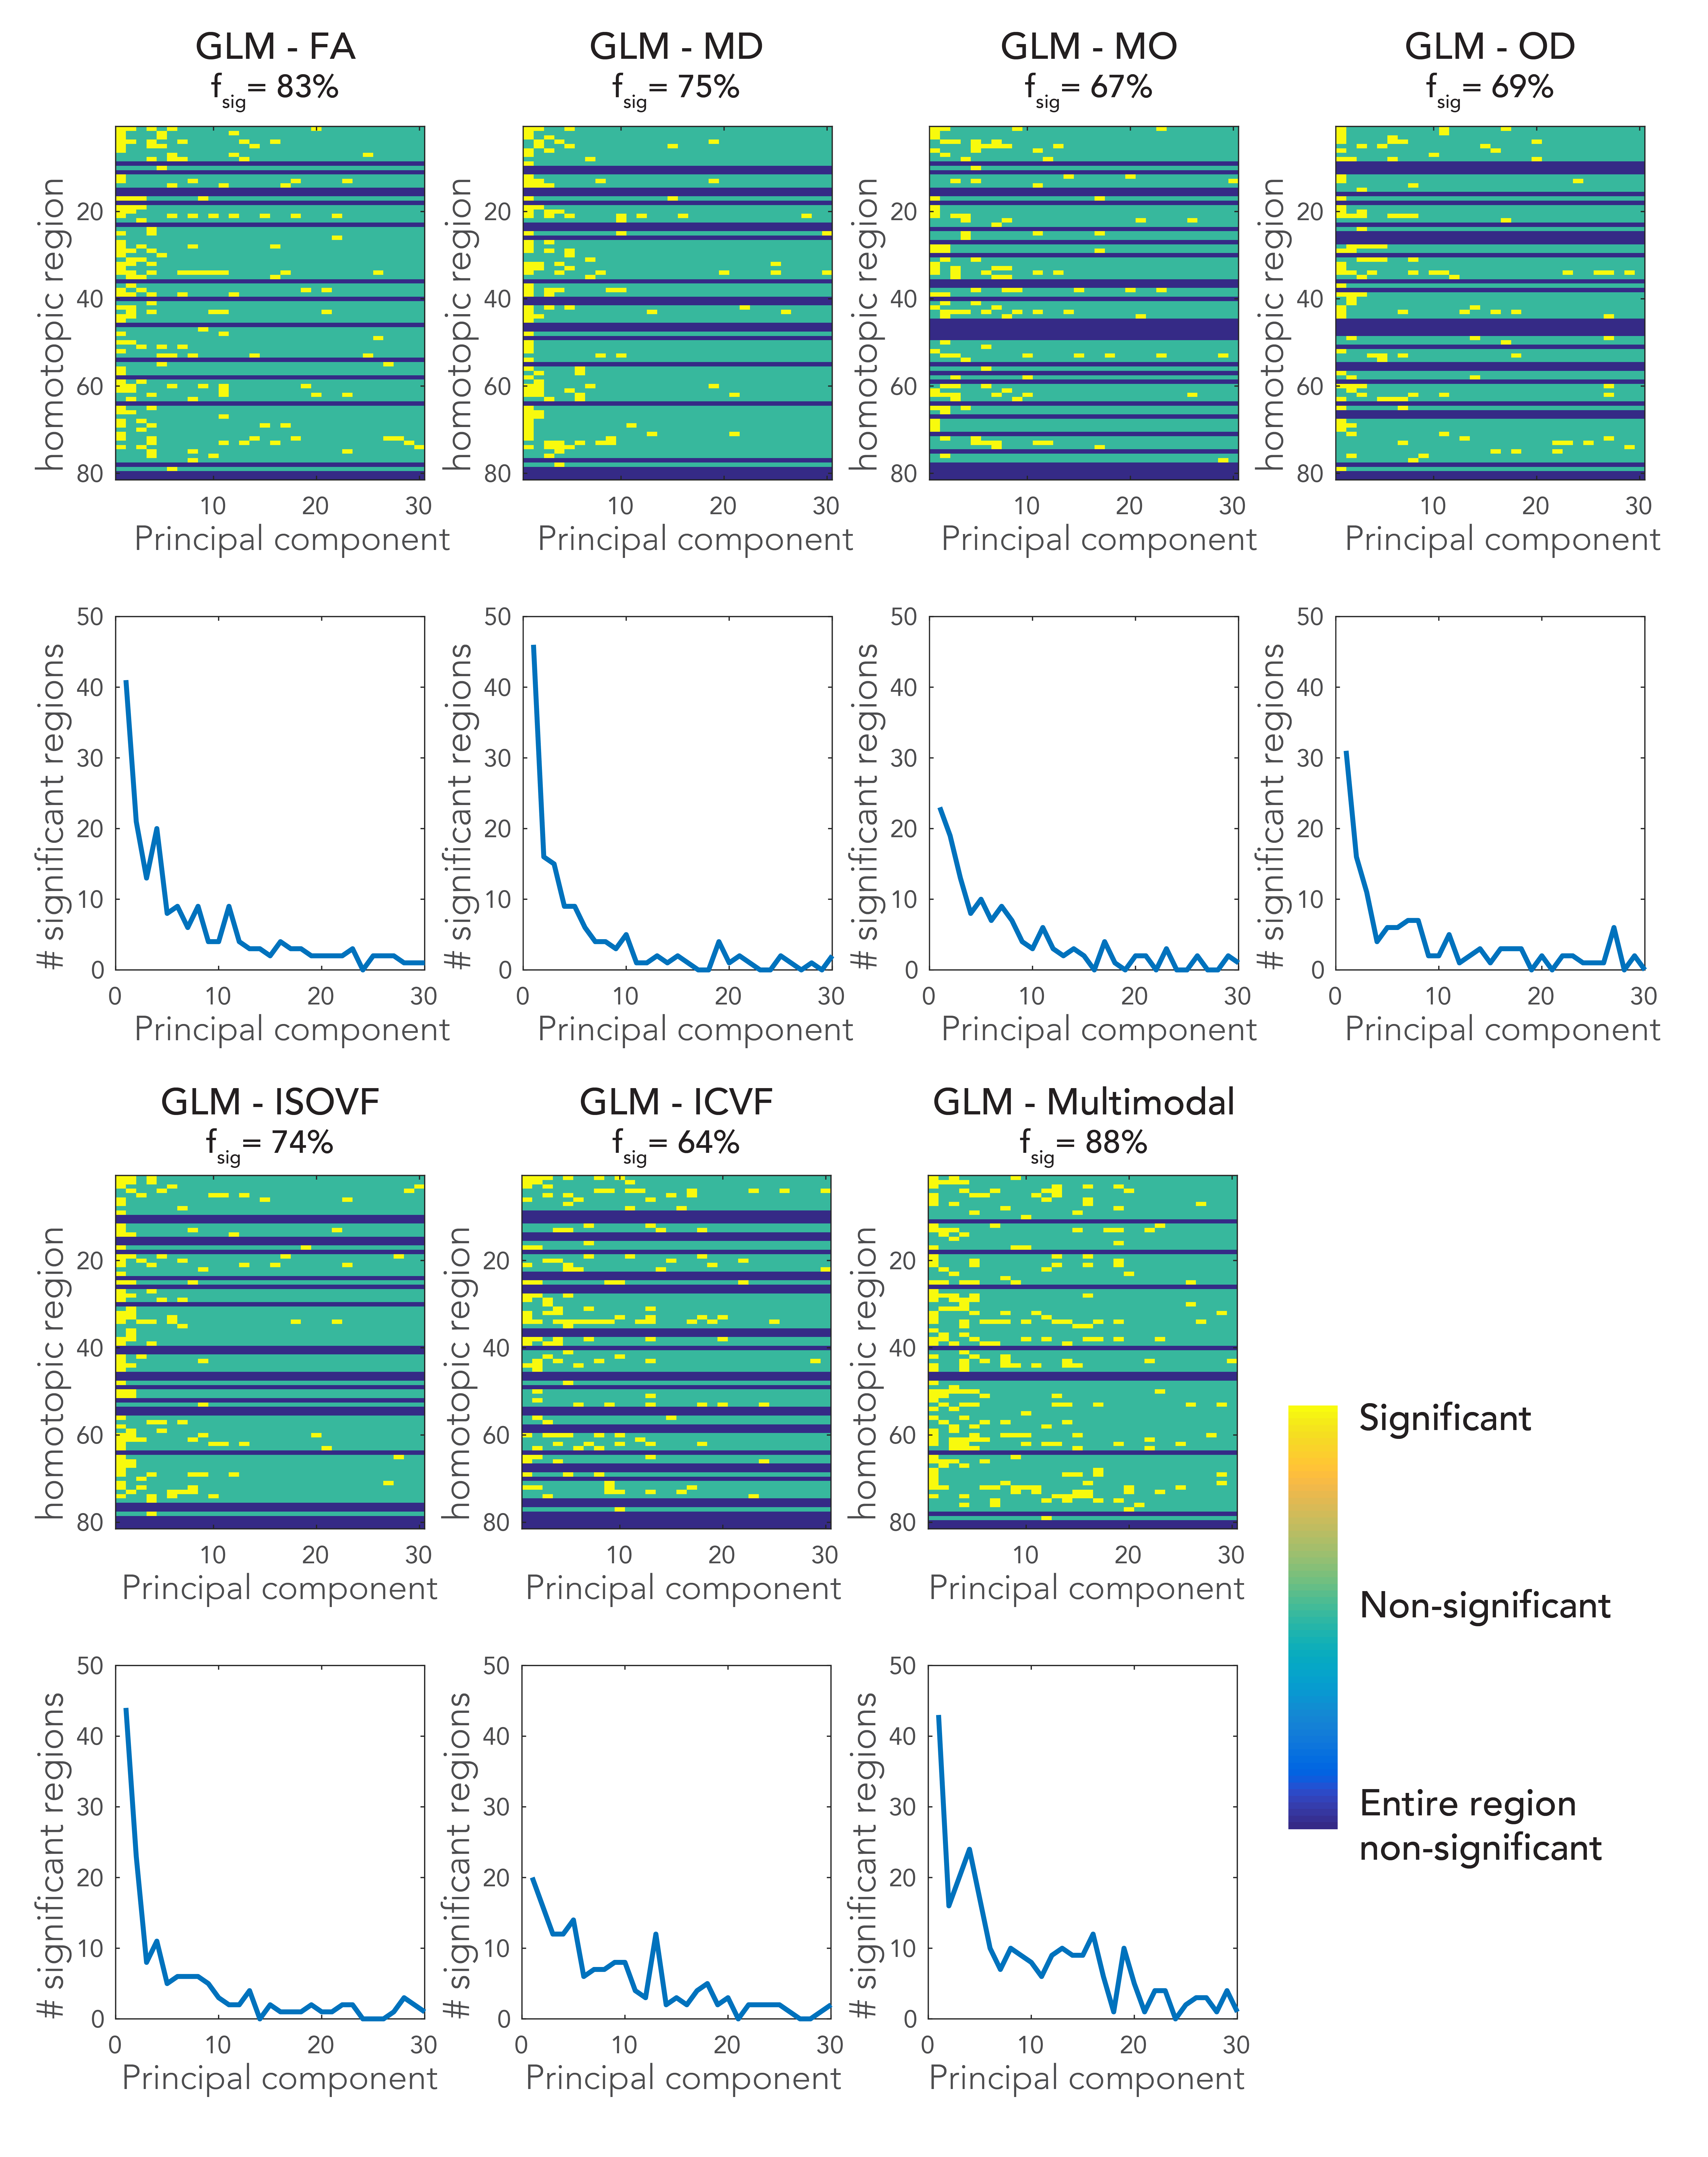
A GLM was constructed to predict FC from the tract microstructure. The FC values of all subjects were stored as entries in a vector (nsubjectsx1). The corresponding tract connecting the homotopic pair was delineated using probabilistic tractography5. Each microstructural metric was extracted from TBSS-voxels within the tracked pathway and stored in a metric matrix (nsubjectsxnvoxels). The large number of voxels in this model would make direct inversion ill-conditioned. We therefore used a principal component analysis (PCA) to perform a dimensionality reduction. The top 30 principal components were used as a reduced design matrix (nsubjectsx30) and hence served as explanatory variables for FC (Figure 2). Similarly, we generated an additional design matrix that combined all metrics. Each metric matrix was normalized by its first singular value, these six matrices were then concatenated (nsubjectsx6nvoxels), and finally a joint PCA was used to generate a multimodal design matrix (nsubjectsx30). The significance of the fit (F-test expressed as Z-score) was determined with permutation testing (Figure 3).
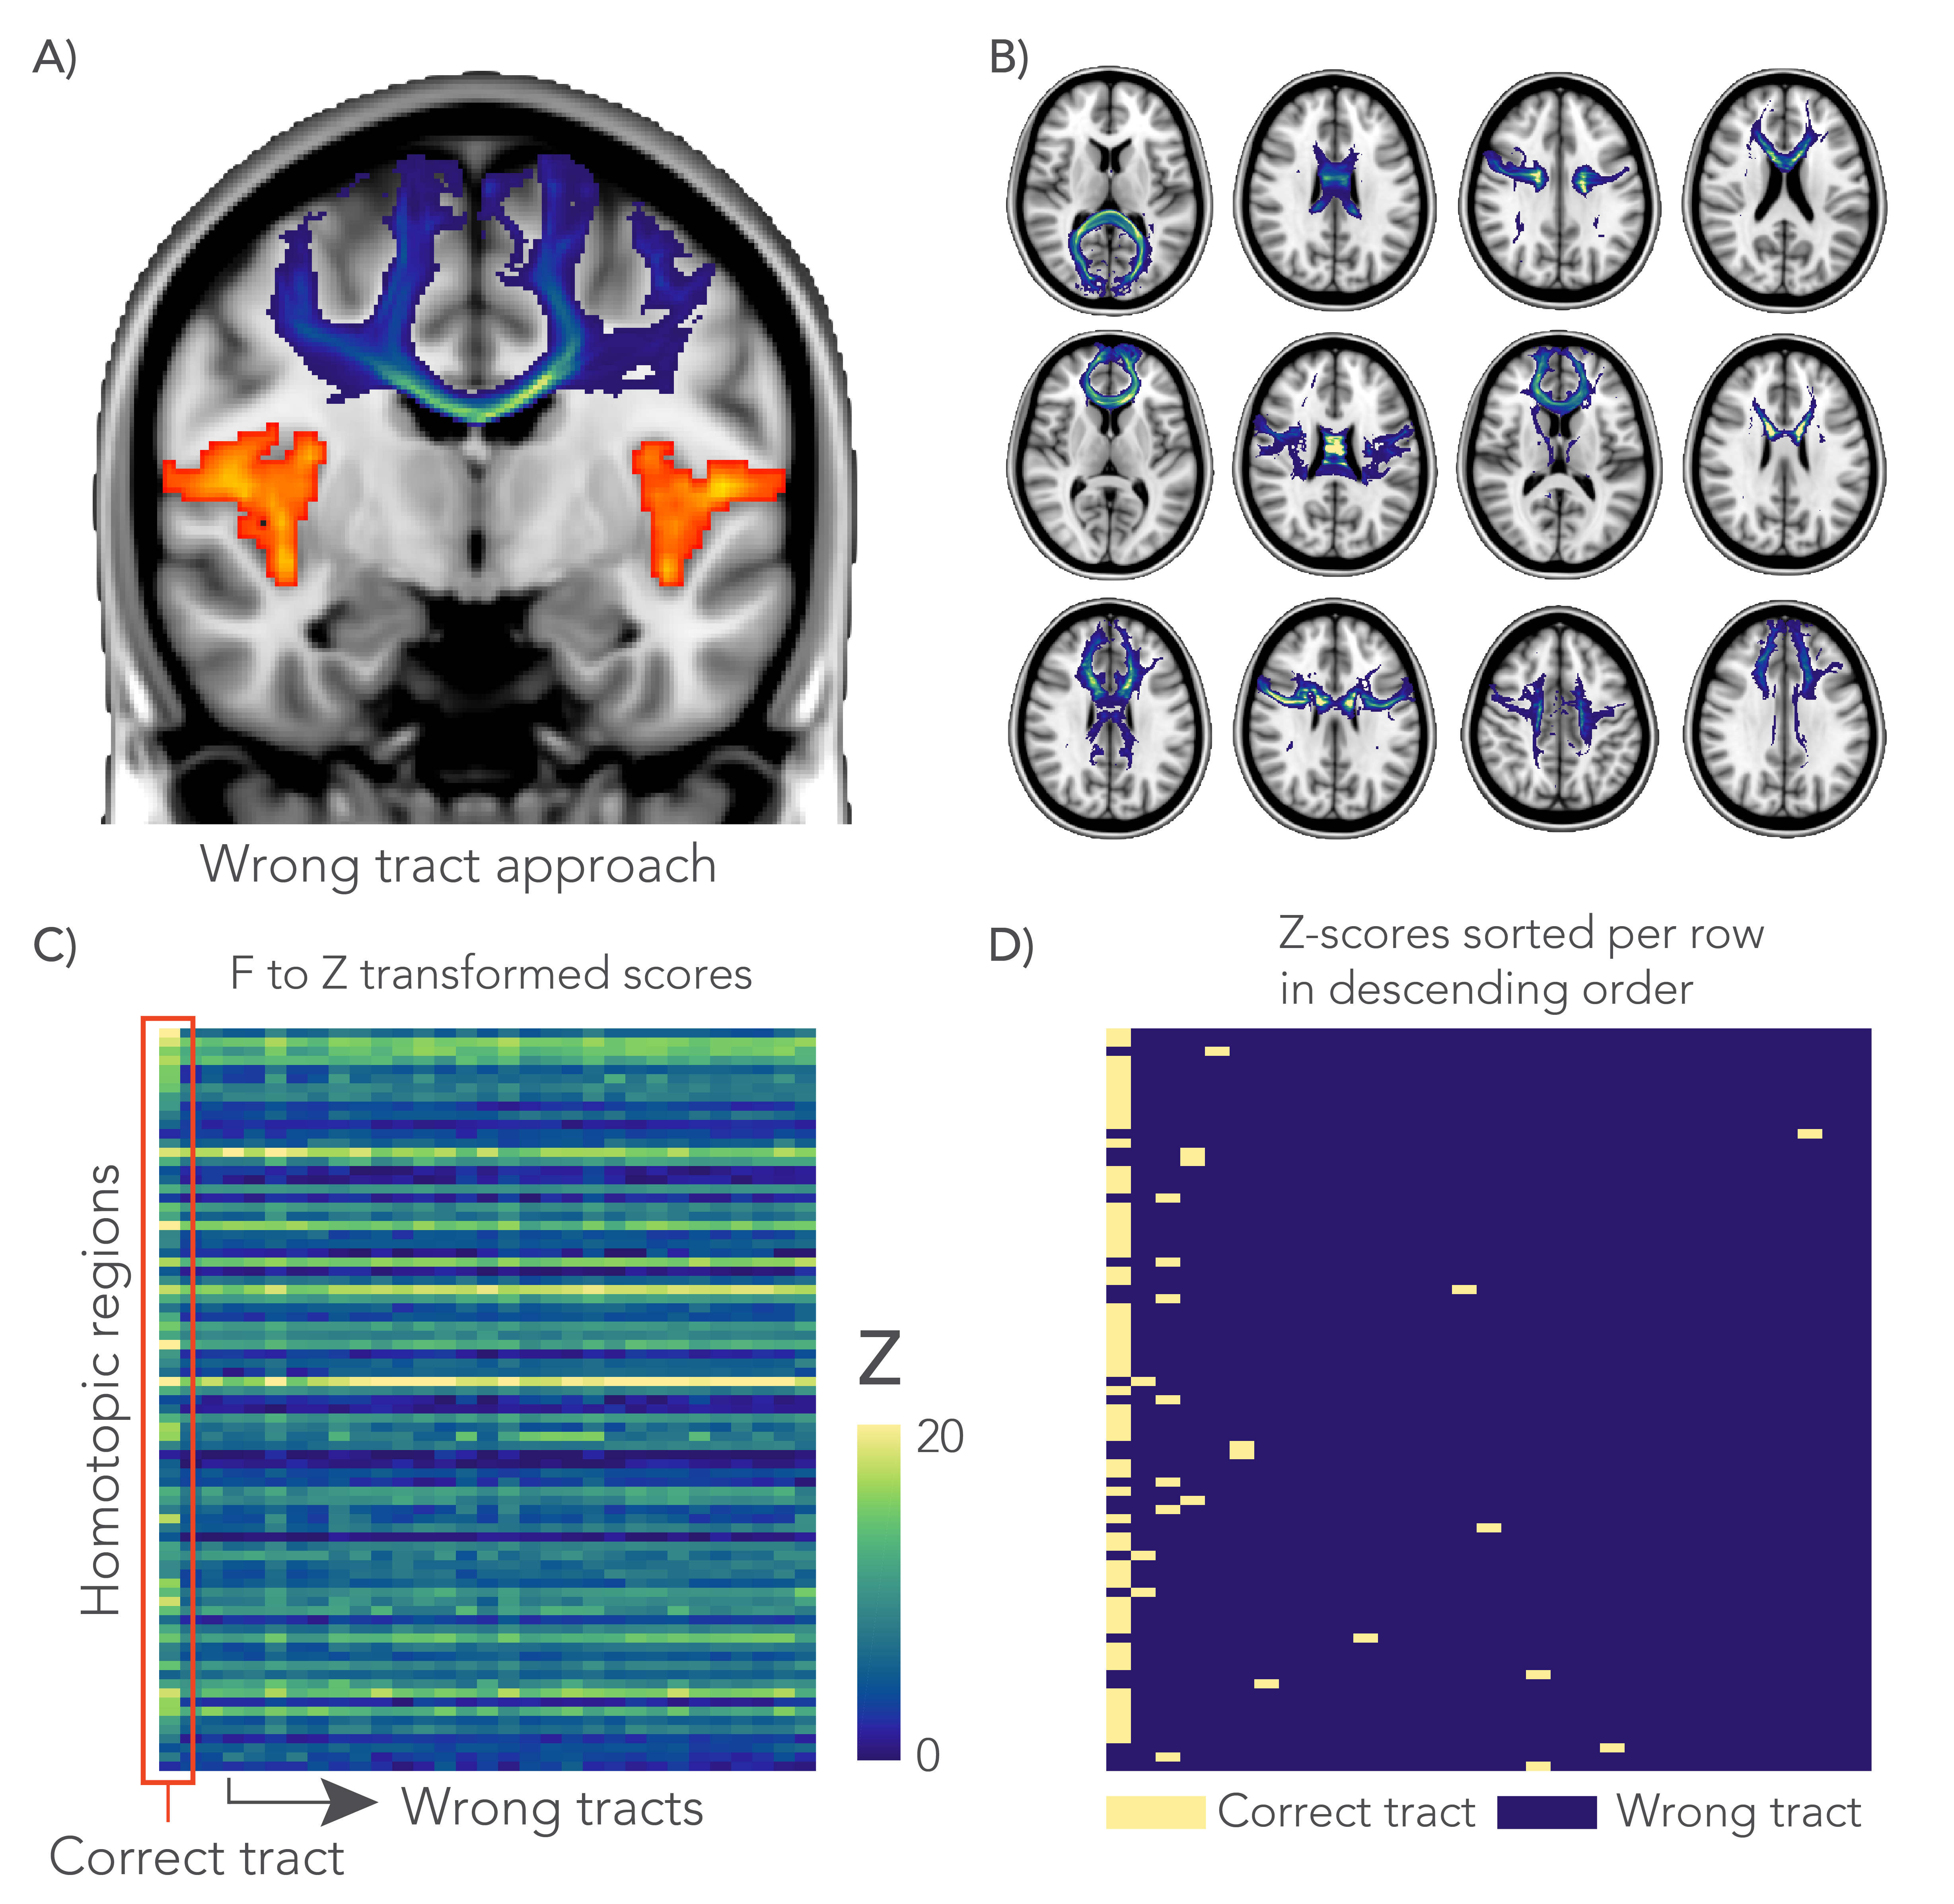
Finally, we performed a negative control analysis to assess whether an association between FC and tract microstructure was driven by unique features of a given tract and not for example by global variance in microstructure. For this analysis, 30 non-overlapping “wrong” tracts were selected and used as alternative design matrices. The performance of these GLMs were compared to the correct tract GLM to ascertain whether “wrong” tracts ever gave better predictions than the anatomically accurate tract (Figure 5).
Results
The model predictions were statistically significant for most of the tested brain regions, and using most of the microstructural features (Figure 3). Most significant associations come from the top principal components in the GLM. The multimodal GLM yielded most significant associations.
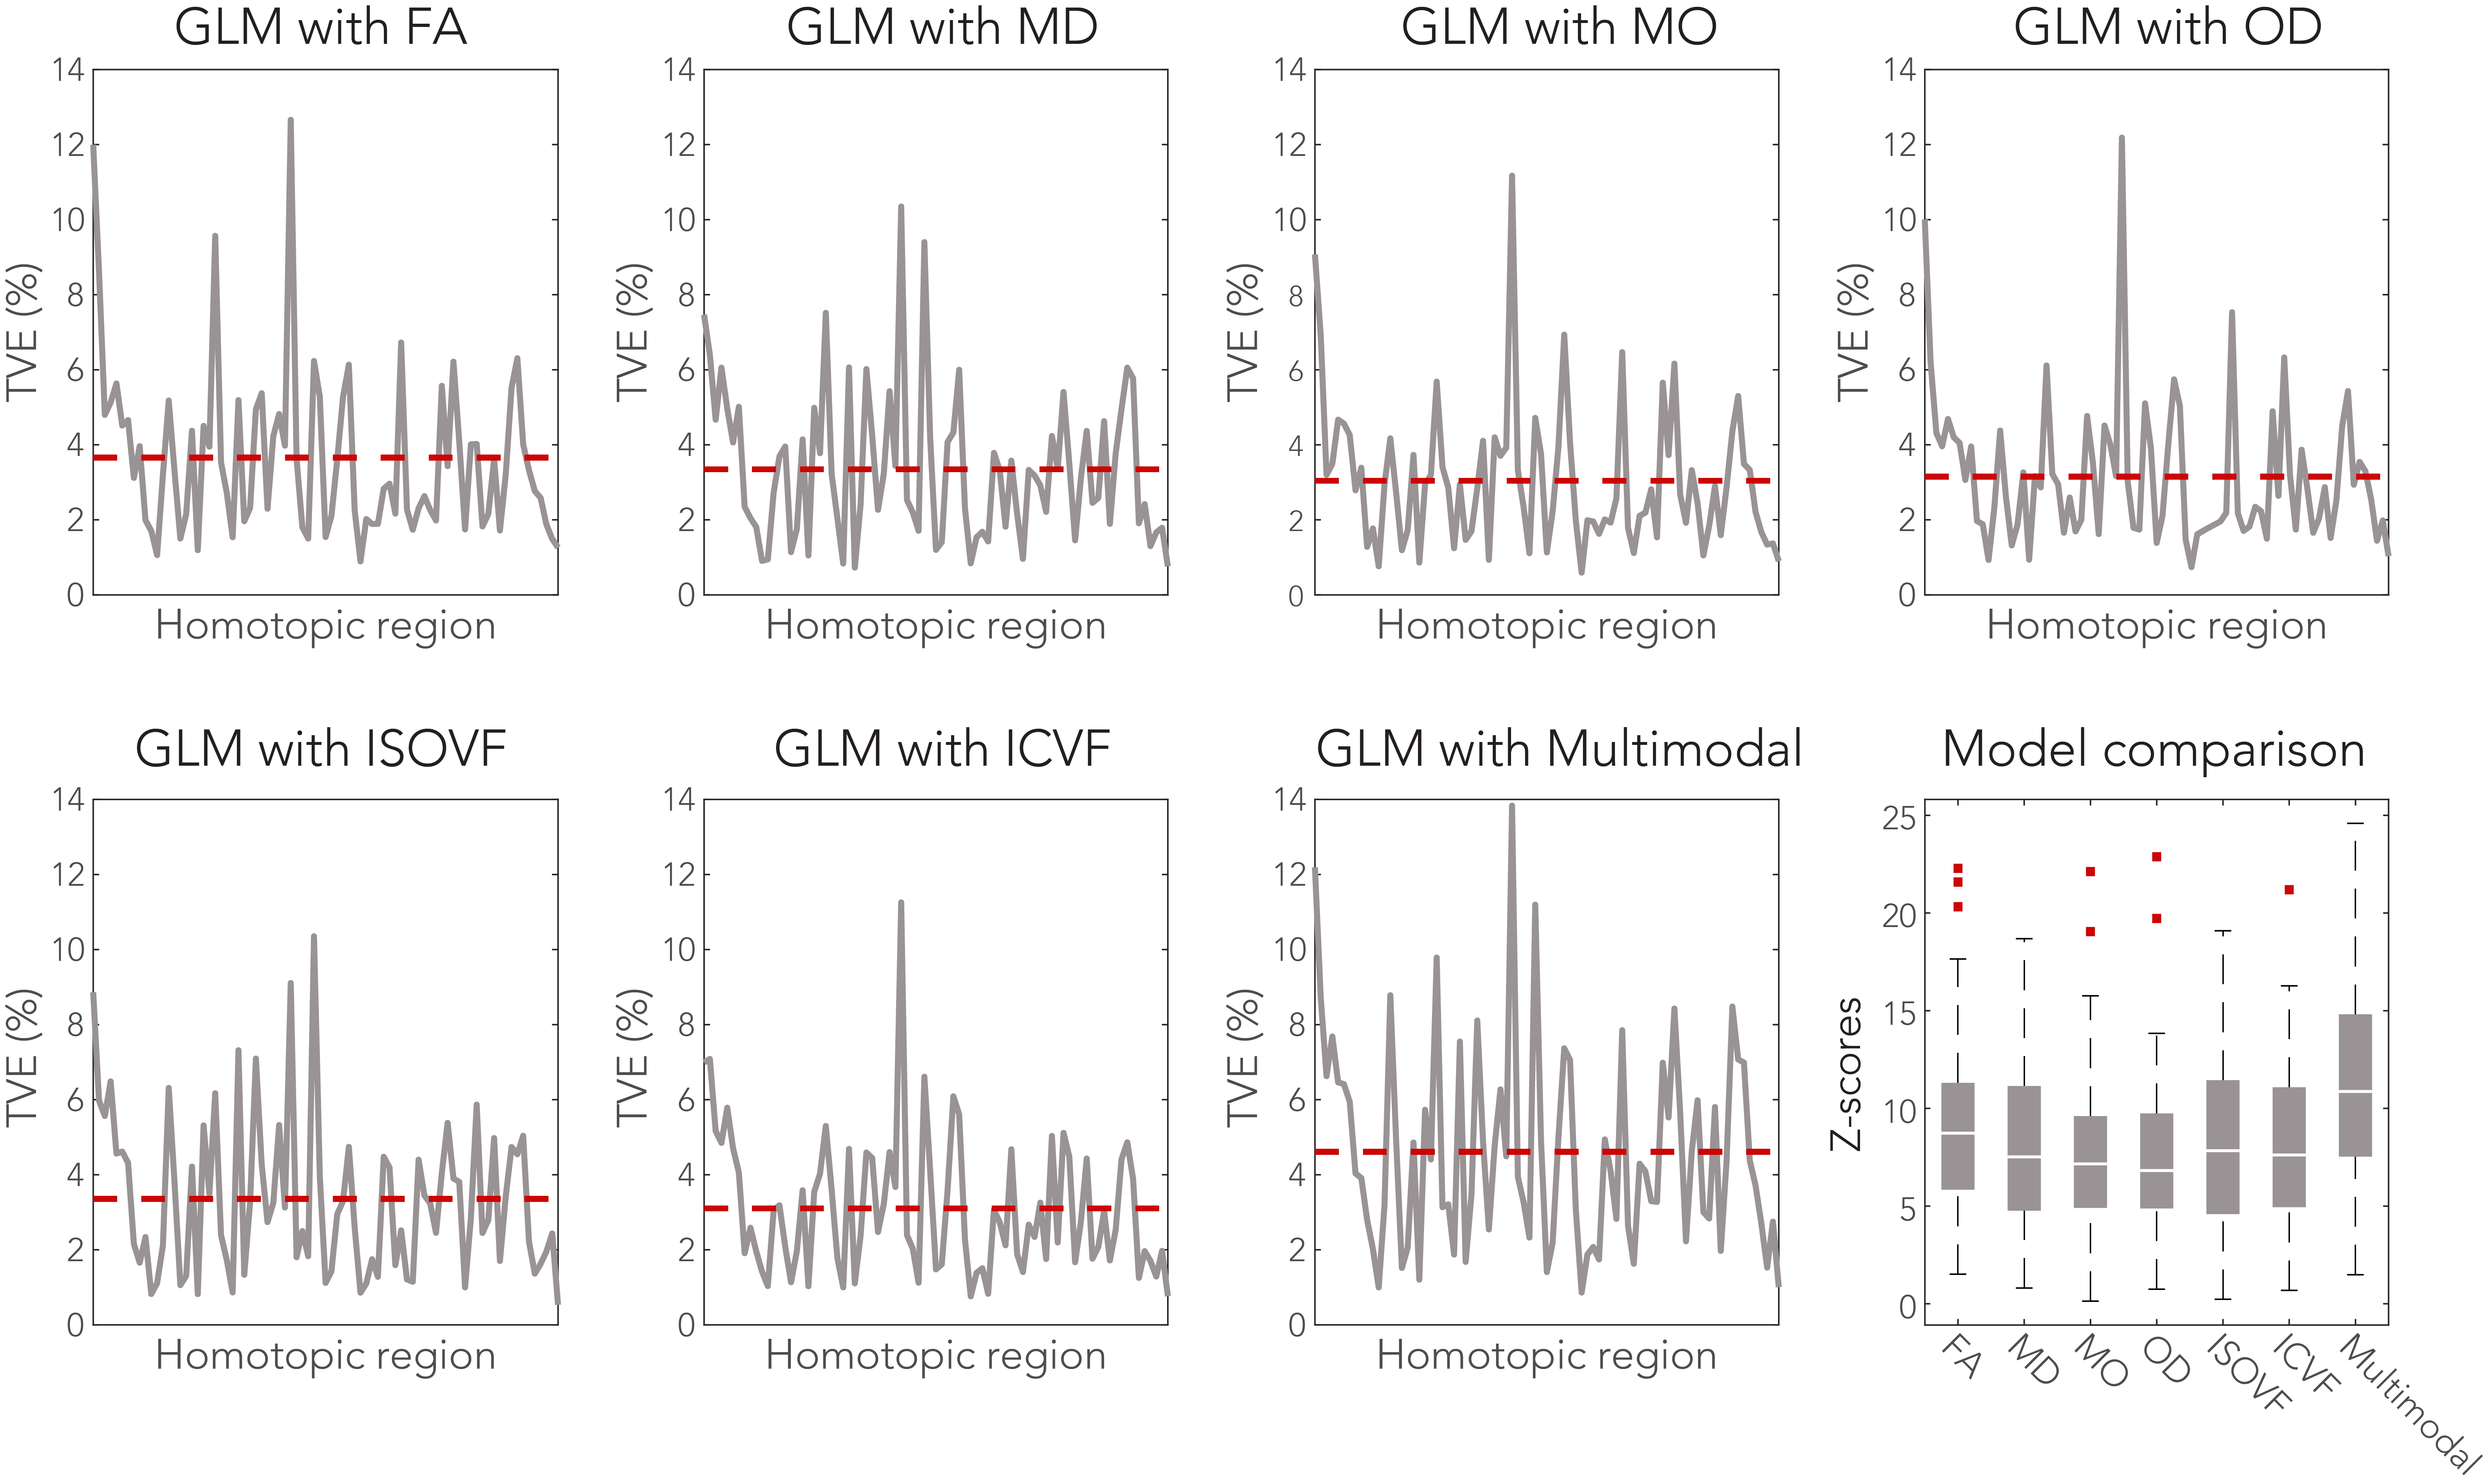
The models were further evaluated in terms of total variance explained (TVE) of FC by the microstructure metrics (Figure 4). Up to 14% of FC variance was explained by the tract microstructure, with most GLMs explaining 3-4% of FC variance. The best overall model performance was found for the multimodal GLM (Z = 11.1).
The negative control analysis found that the highest Z-score was obtained from the anatomically correct tract for 70.4% of the grey matter regions. In another 19.8% of the cases the correct tract was among the five highest Z-scores (Figure 5.C-D).
Discussion
We have demonstrated a relationship between functional connectivity and the white matter microstructure of the tract that forms the connection. Up to 14% of cross-subject variance in FC was explained based solely on diffusion-based microstructure metrics. In addition, it was demonstrated that these associations are driven, at least in part, by unique features of the anatomically correct tract, rather than more global variations in microstructure. Attribution of these relationships to specific biological sources (and ideally causality) cannot be achieved with this kind of observational study, but would likely require interventional studies in animals.Acknowledgements
The authors would like to thank David G. Norris and Jose P. Marques for useful discussions. This research was funded by the Wellcome Trust.
References
1. Beaulieu C. et al. The basis of anisotropic water diffusion in the nervous system – a technical review. NMR Biomed (2002).
2. Miller K.L. et al. Multimodal population brain imaging in the UK Biobank prospective epidemiological study. Nature Neuroscience (2016).
3. Zhang. H. et al. NODDI: practical in vivo neurite orientation dispersion and density imaging of the human brain. Neuroimage (2012).
4. Smith S.M. et al. Tract-based spatial statistics: Voxelwise analysis of multi-subject diffusion data. Neuroimage (2006).
5. Behrens T.E.J. et al. Probabilistic diffusion tractography with multiple fibre orientations: What can we gain? Neuroimage (2007).
Figures