4650
Vascular Origins of the Negative BOLD fMRI Response1Department of Medical Biophysics, University of Toronto, Toronto, ON, Canada, 2Rotman Research Institute, Baycrest, Toronto, ON, Canada
Synopsis
While the origin of negative BOLD response in fMRI has been debated, we present an explanatory biophysical model that accounts for imaging and physiological parameters, including vascular-orientation, CBV change, TR, TE, inflow and even different oxygenation levels in arterial and venous compartments. This model shows that it is possible for negative BOLD to arise from both arterial and venous sources even in the presence of neural-activity increase. This abstract suggests part of the negative BOLD response originates simply from the vascular origin of the signal.
Introduction:
The negative BOLD fMRI task response has been widely investigated, and its physiological origins have remained debatable. The negative BOLD response (NBR) has been reported in regions adjacent to those exhibiting the positive BOLD task response (PBR) and sharing the temporal evolution of the PBR1. Notably, the NBR has been attributed to: 1) a reduction in neuronal activity1,2; 2) to a reduction in cerebral oxidative metabolism (CMRO2)1,3; 3) to a vascular-steal phenomenon1. However, an often-overlooked explanation, as implied by the simulations of Uludag et al.4, arises from the difference between blood-susceptibility and adjacent tissue. In this work, we use biophysical simulations of a 3 Tesla gradient-echo EPI acquisition to explicitly show that physiologically plausible conditions in the normal brain could give rise to NBR even as a consequence of increased brain activity. Such occurrences could be attributed primarily to an arterial case but could also occur in veins. Here, we also demonstrate that the extent of this effect depends on the imaging parameters.Materials and Methods:
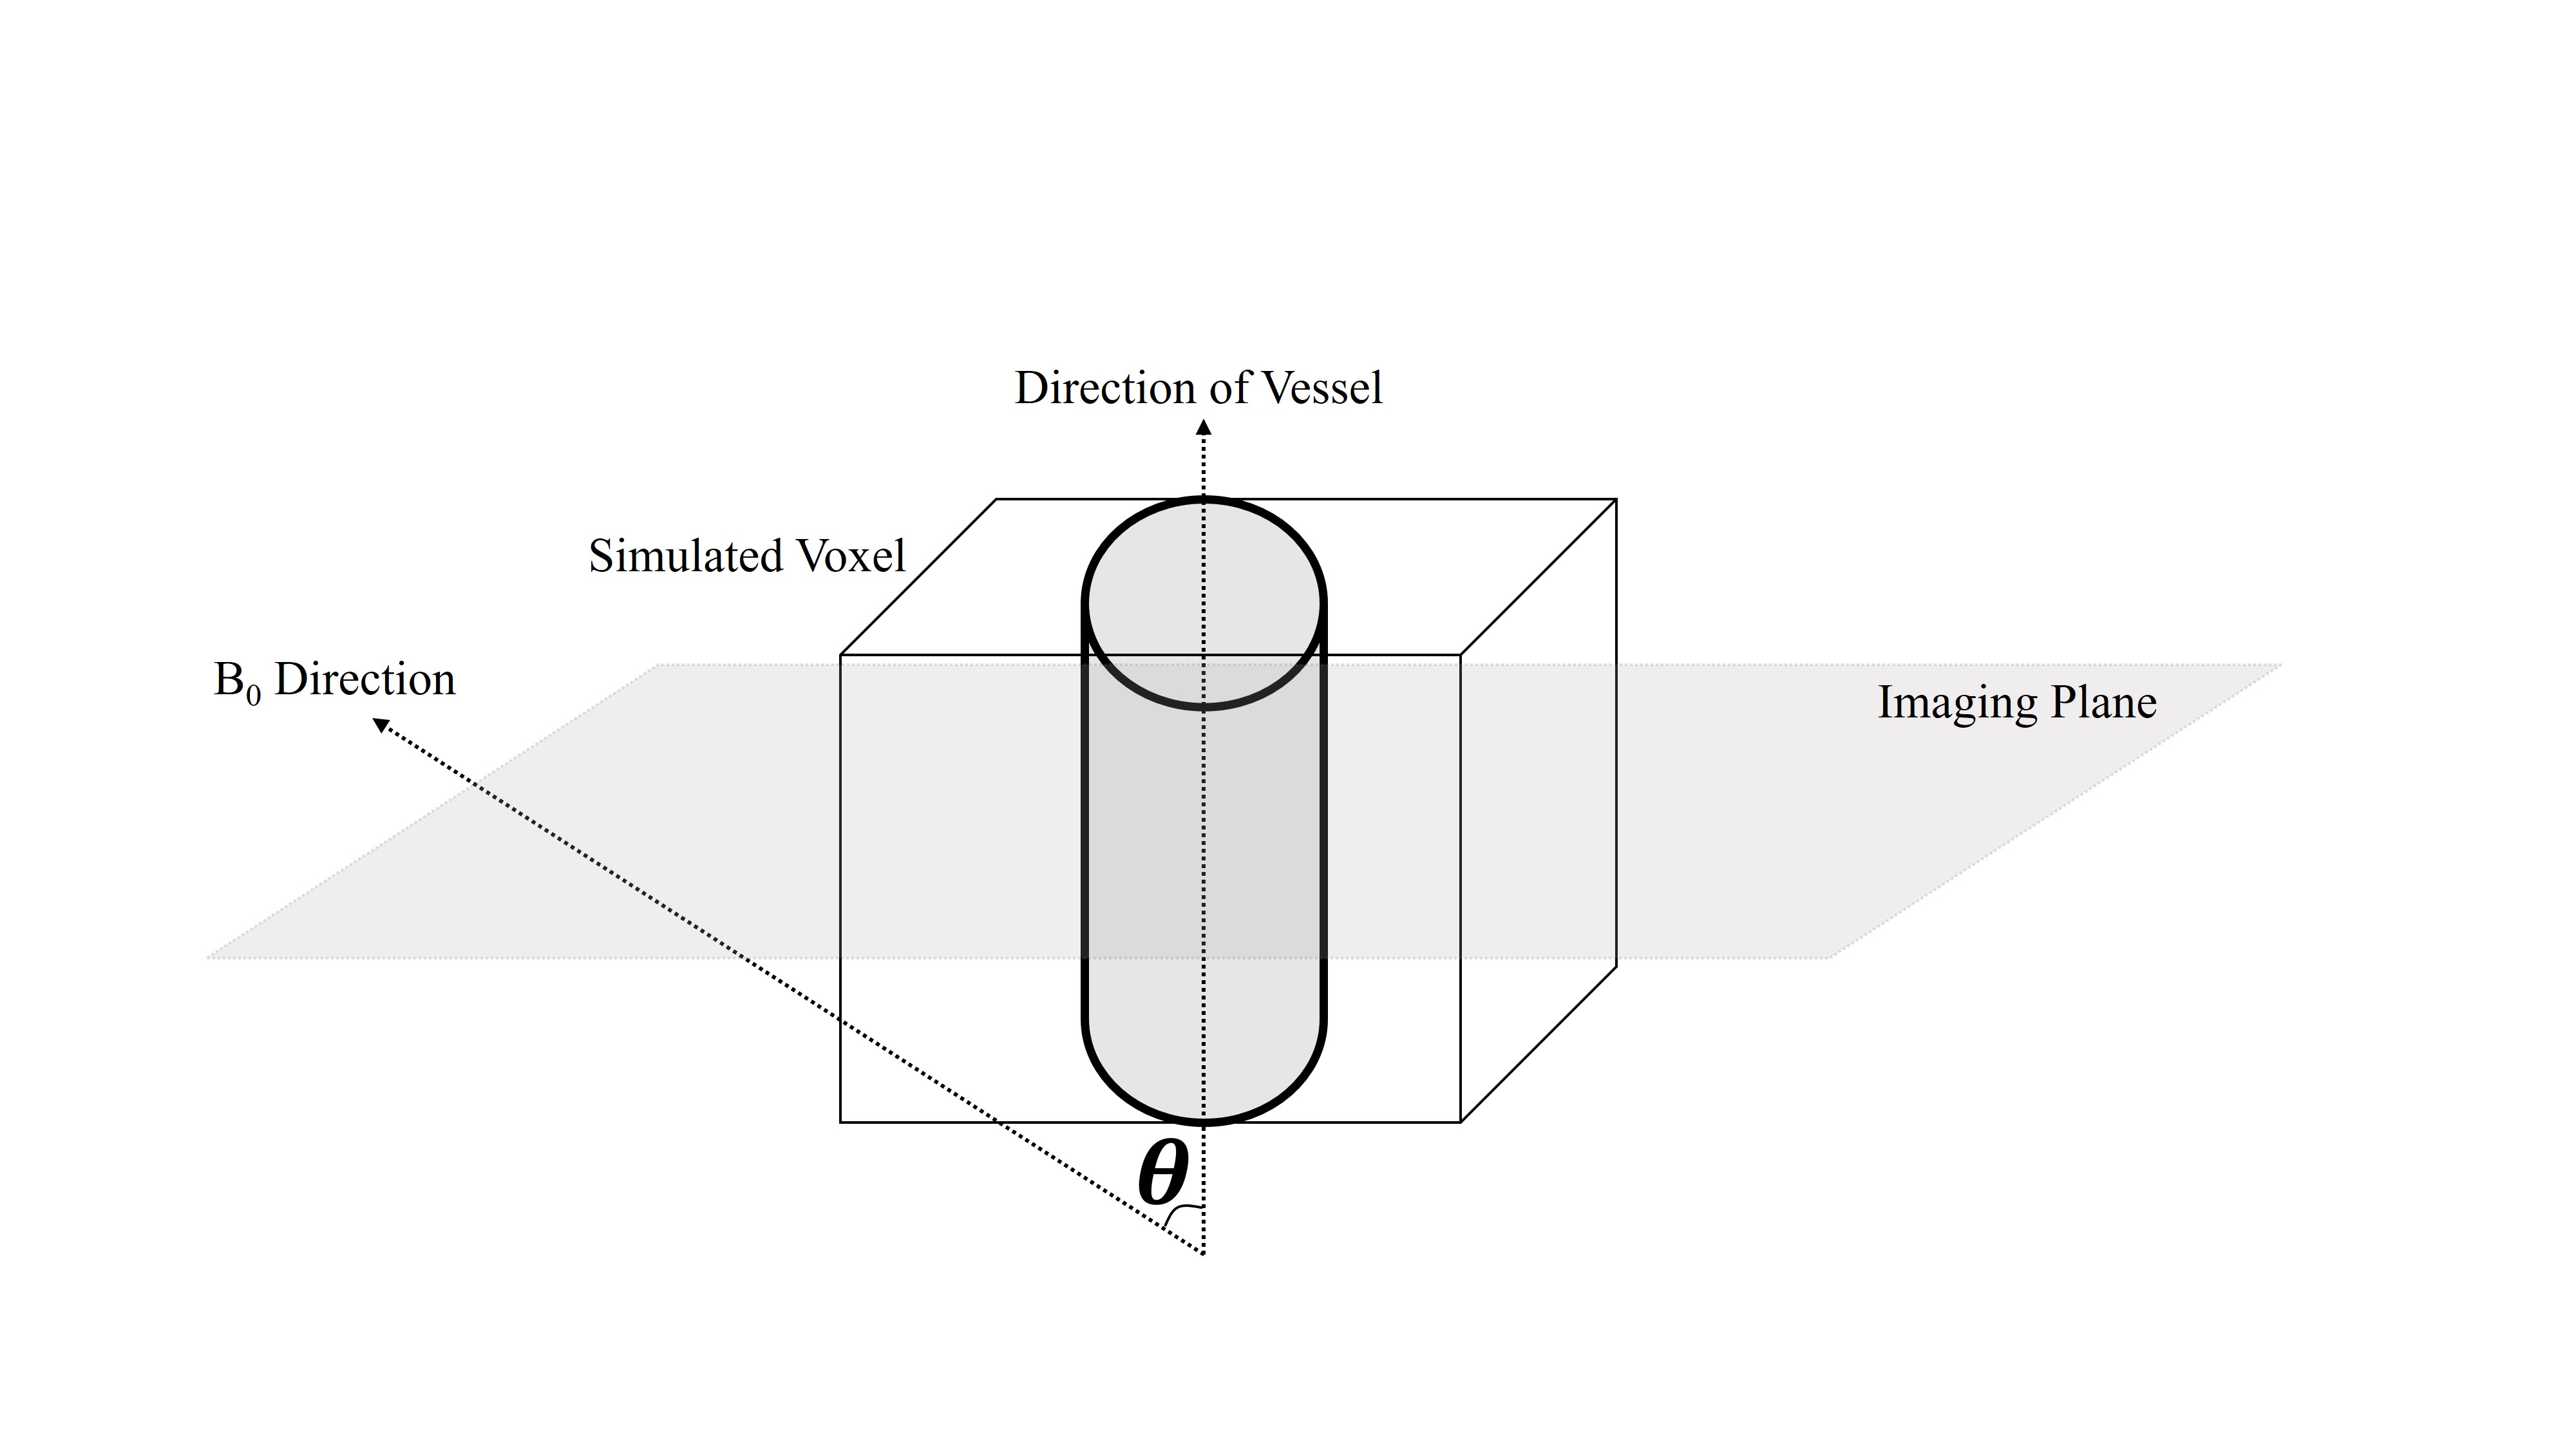
We simulated a voxel in a neuronal-activation scenario, and for simplicity, we assumed the case of a single vessel residing in the central axis of the voxel surrounded by gray matter (GM)5,6. Such scenarios are most likely to arise due to the presence of arteries, arterioles, venules and veins that occupy a part of the voxel under the “cylinder” assumption. To simulate the BOLD signal, the discrete form of the Bloch equation was implemented in MATLAB by consecutively applying the relaxation and excitation matrixes.
At B0=3 T, which is the assumption here, T1, blood and T1, tissue are chosen to be 1647ms and 1465ms, respectively7. A single-shot gradient-echo EPI (with slice thickness=5 mm) sequence was simulated for these scenarios: 1) long TR, TR1=2000ms\FA1=75° and, 2) short TR, TR2=350ms\FA2=38°. In both cases, a range of TE values was considered. T2-tissue was assumed as 77 ms4 in 3T, and for the oxygenation induced intravascular T2* change, the following approximation was used in 3T4:
$$T_2^*blood(Y)=\frac{1} {13.8+181\times (1-Y)^2}$$
Blood-inflow effects were simulated assuming a 90° angle between the vessel axis and the imaging plane, with a parabolic blood velocity profile8. The formulation by Spees et al.9 was used for the susceptibility difference between vessels and GM tissue. This value was then used for evaluating the signal attenuation that arises from the effect of extravascular de-phasing as in Yablonskiy et al.5 (ignoring the extravascular diffusion effect for simplicity). Orientation-dependent off-resonance change for intra-vascular compartment was obtained from the formulation in10, assuming a cylindrical vessel. The total voxel signal is the weighted complex sum of its intra- and extra-vascular compartments.
For venules/veins, an activation induced oxygenation change from 60% to 70% is assumed while for arterioles/arteries we assumed an activation induced oxygenation change of 95% to 100%4. In all our simulations, the Grubb’s law11 was used to relate changes in CBF and CBV.
Results:
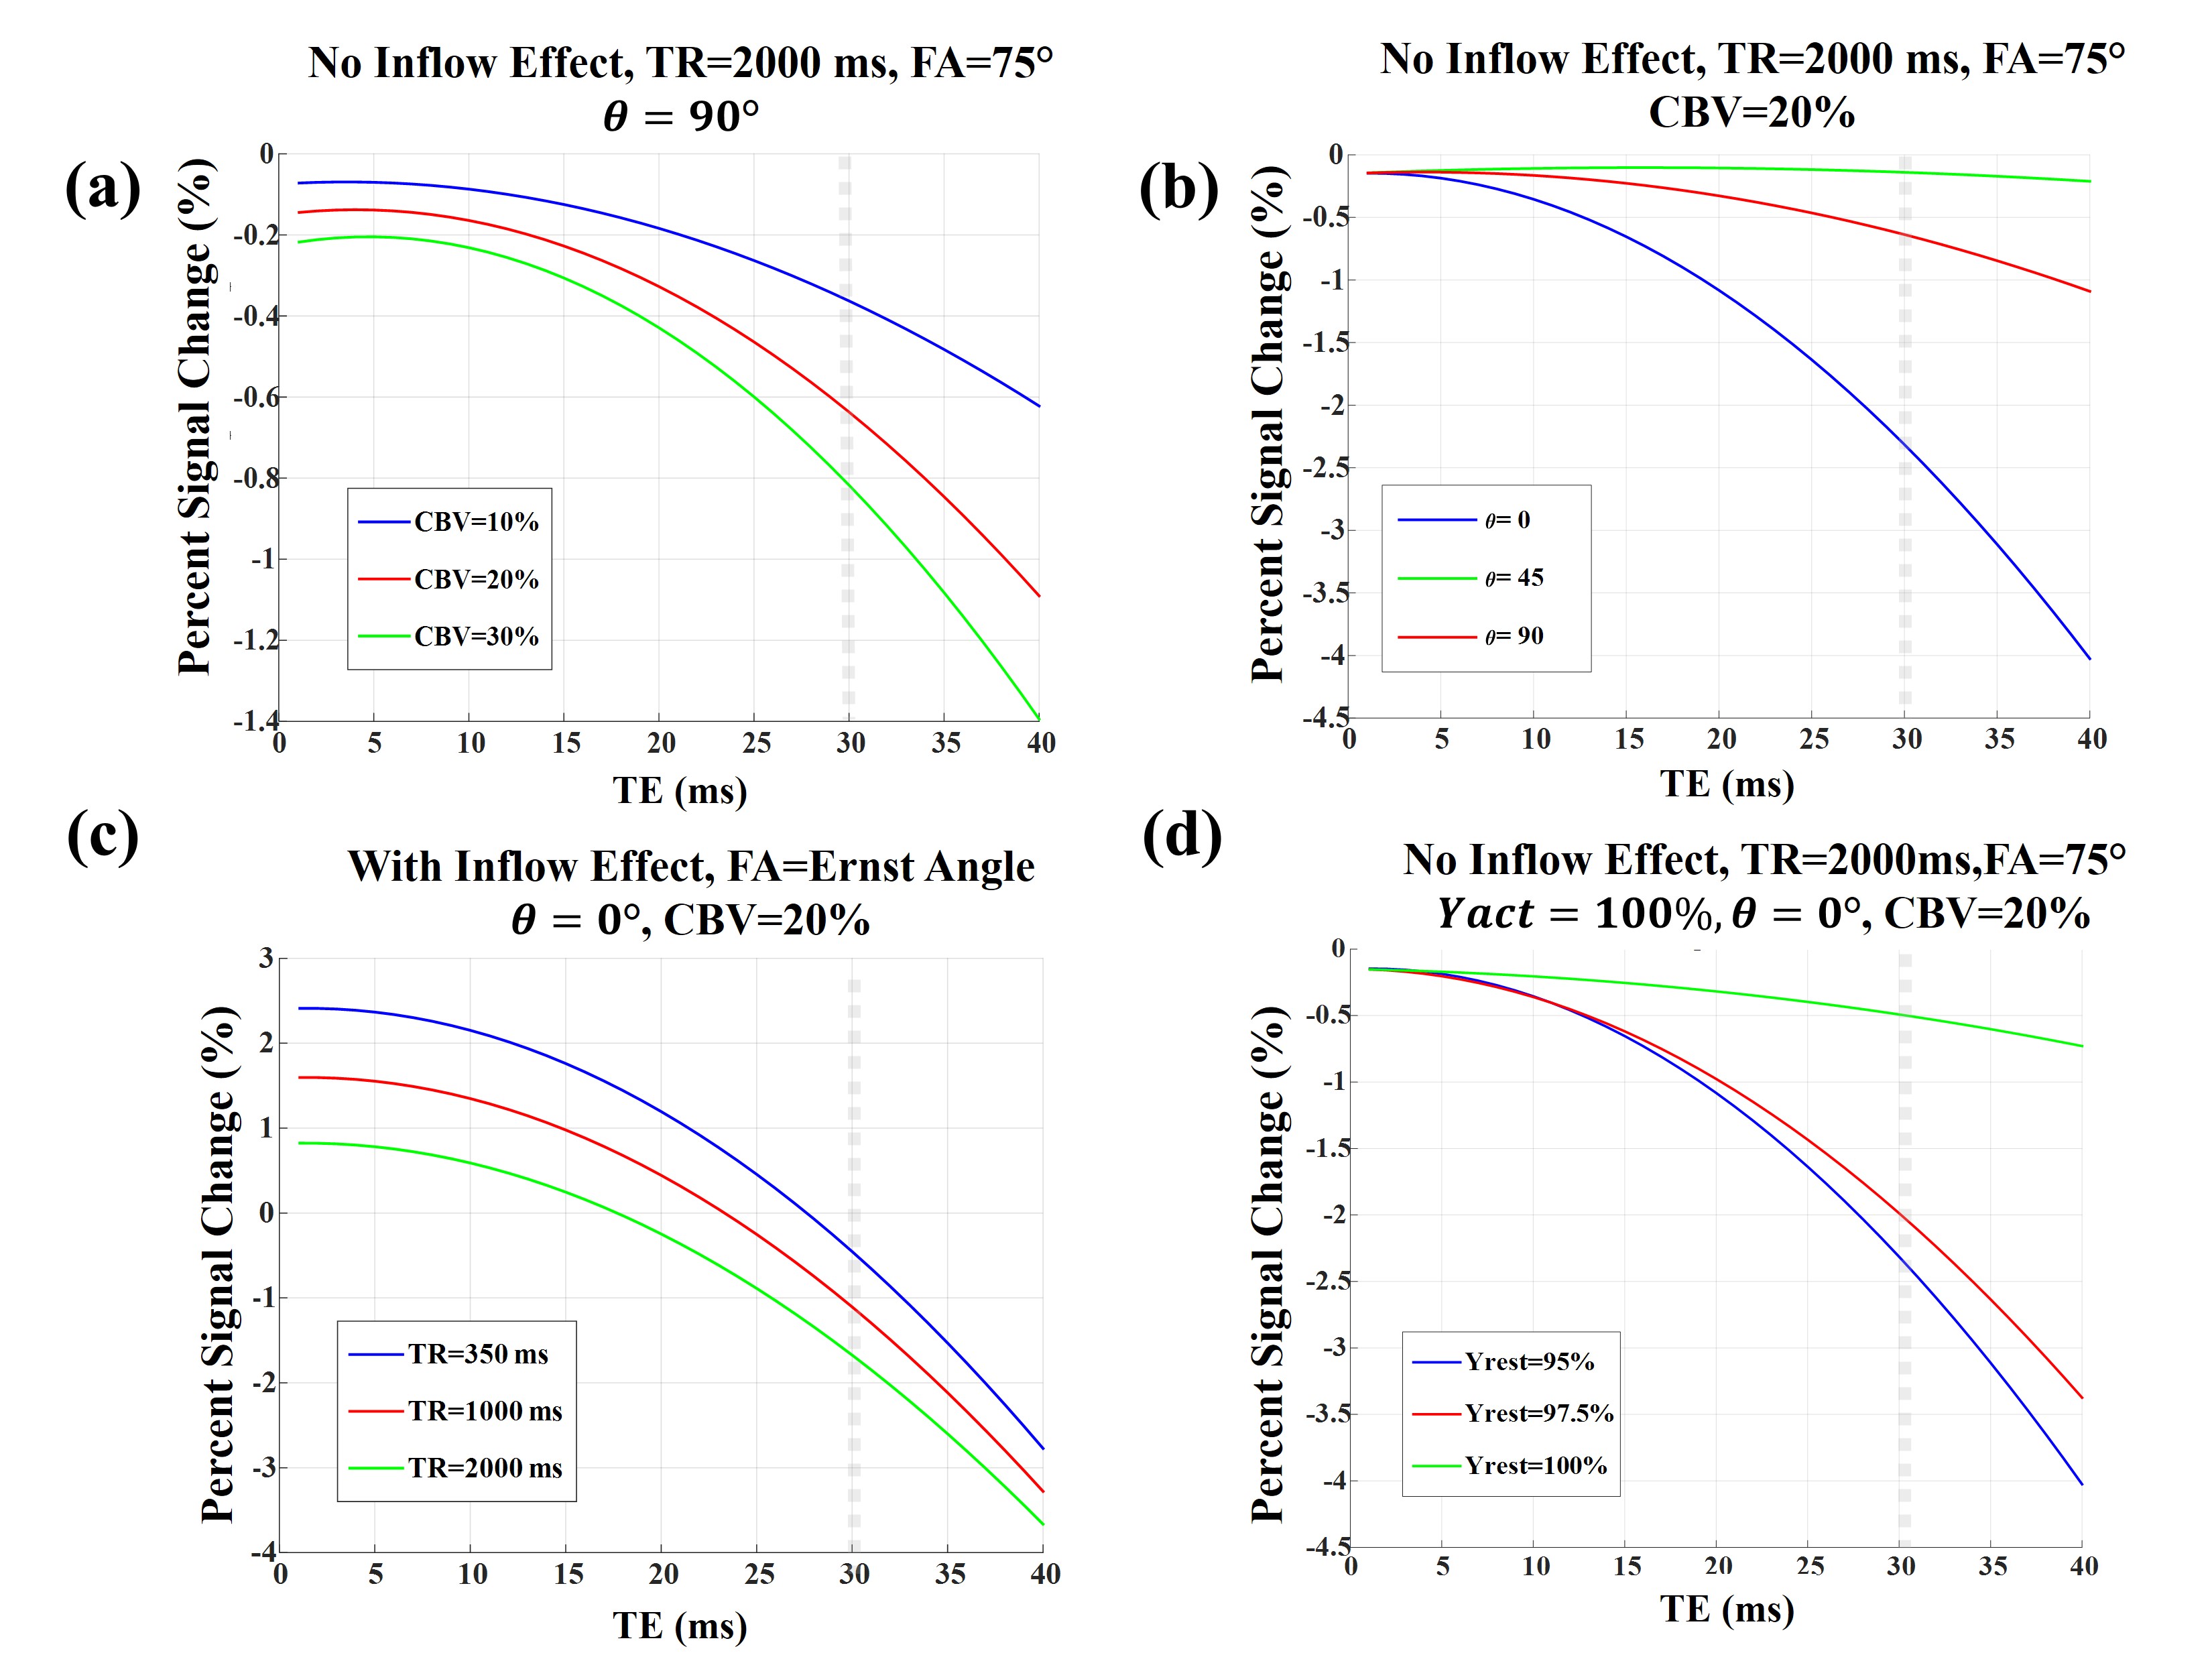
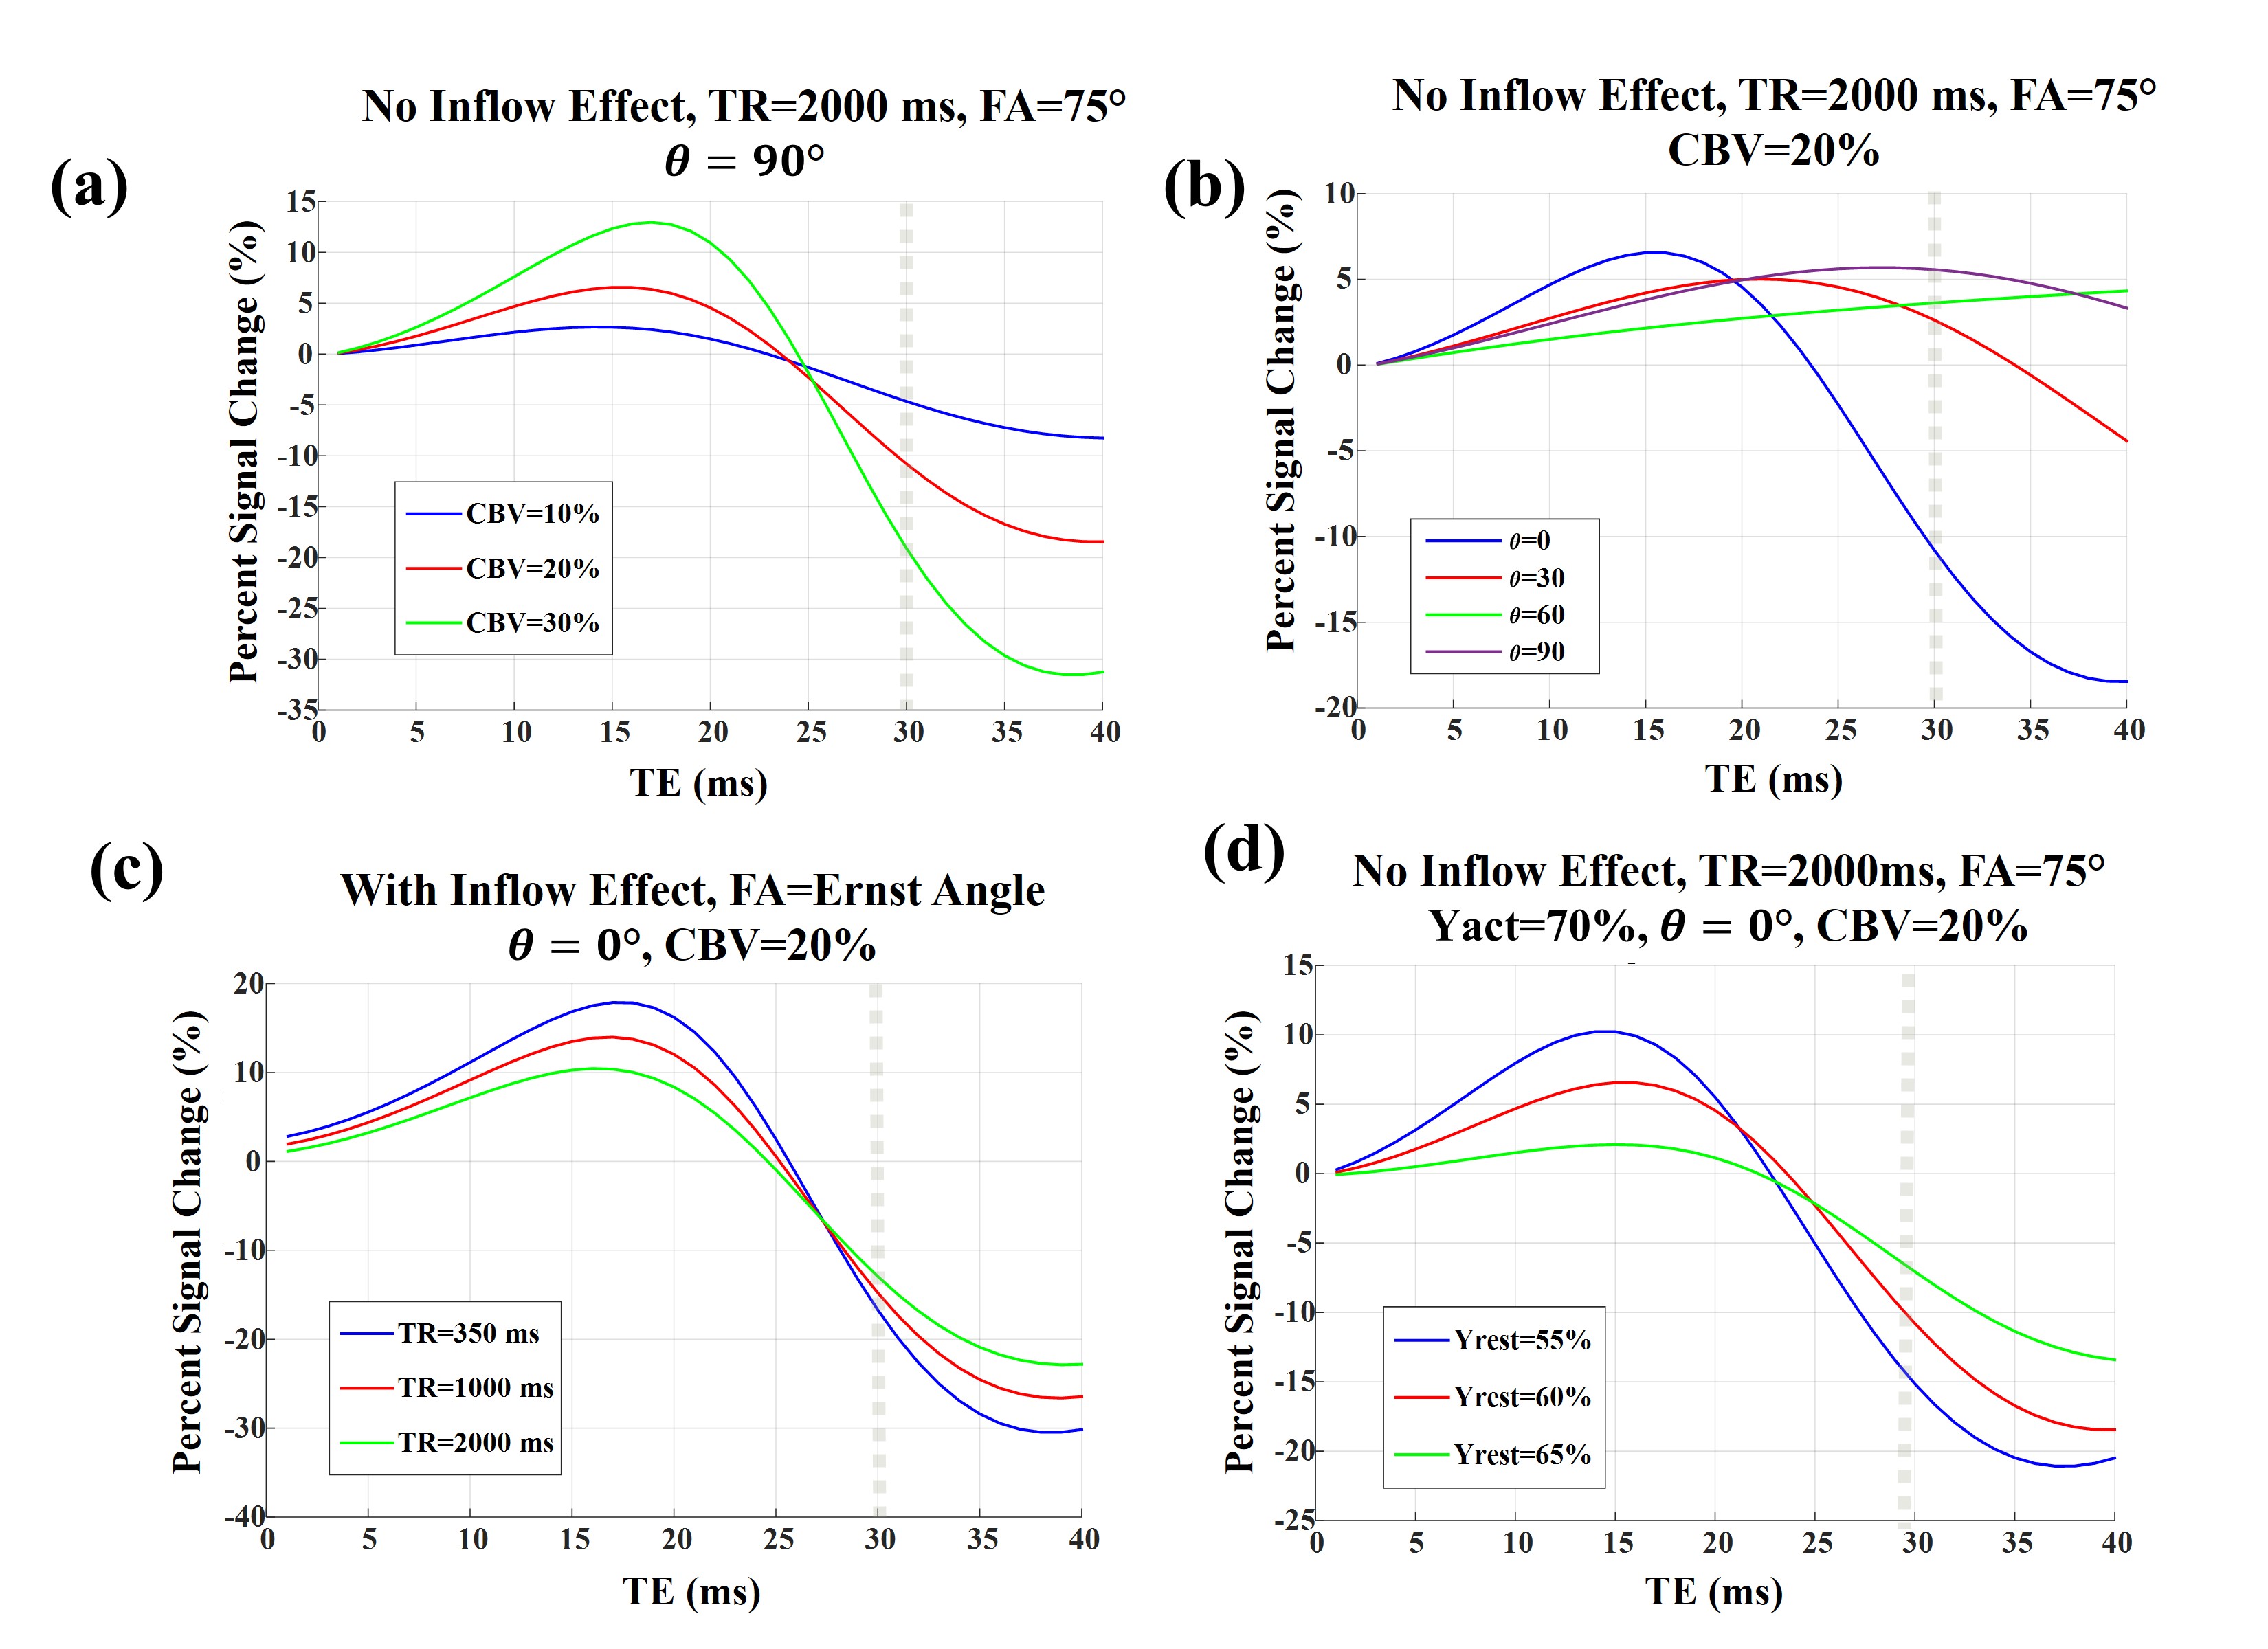
A schematic view of the simulated voxel is shown in Fig. 1. Simulation results are shown in Fig 2 for arterioles/arteries and in Fig. 3 for venules/veins. We plot percent BOLD signal changes for a range of TE values, while the effect of CBV change, inflow, vessel-B0 angle (θ) change, TR change and oxygenation change have been also separately investigated. As our results show, a negative BOLD response can be seen in both venous and arterial compartments as a result of brain activation.Discussion and Conclusion:
The primary reason behind the negative BOLD response (NBR) observed in arterial/arteriolar vessels seems to be the amount of susceptibility difference between the vessel and surrounding tissue. This is because the susceptibility difference between arteriole and tissue is zero for 95% blood oxygenation, but when Yarteriole reaches 100%, the susceptibility difference increases, leading to reduced fMRI signal. The corresponding NBR can be substantial since the fractional arterial CBV change is by far the largest across all vascular compartments12.
Conversely, for veins, the possibility to observe NBR was found to be orientation dependent. While it is expected for BOLD activation to generally increase the fMRI signal, in a special situation in which θ is relatively small, the induced off-resonance within the vessel can increase and lead to a significant phase difference between blood and tissue signals. When this phase change becomes high enough and at longer TEs, brain activation can practically reduce the fMRI signal, leading to a NBR.
Thus, we have demonstrated that the increases in neural activity and CBV can also lead to NBR. Notably, the role of arterial CBV may not be negligible as previously assumed, even at 3 T.
Acknowledgements
No acknowledgement found.References
1. Shmuel A, Yacoub E, Pfeuffer J, Van de Moortele P-F, Adriany G, Hu X, Ugurbil K. Sustained negative BOLD, blood flow and oxygen consumption response and its coupling to the positive response in the human brain. Neuron 2002;36:1195–1210.
2. Mullinger KJ, Mayhew SD, Bagshaw AP, Bowtell R, Francis ST. Evidence that the negative BOLD response is neuronal in origin: a simultaneous EEG–BOLD–CBF study in humans. Neuroimage 2014;94:263–274.
3. Stefanovic B, Warnking JM, Pike GB. Hemodynamic and metabolic responses to neuronal inhibition. Neuroimage 2004;22:771–778.
4. Uludağ K, Müller-Bierl B, Uğurbil K. An integrative model for neuronal activity-induced signal changes for gradient and spin echo functional imaging. Neuroimage 2009;48:150–165.
5. Yablonskiy DA, Haacke EM. Theory of NMR signal behavior in magnetically inhomogeneous tissues: the static dephasing regime. Magn Reson Med 1994;32:749–763.
6. Haacke EM, Lai S, Yablonskiy DA, Lin W. In vivo validation of the BOLD mechanism: a review of signal changes in gradient echo functional MRI in the presence of flow. Int J Imaging Syst Technol 1995;6:153–163.
7. Khajehim M, Nasiraei Moghaddam A. Investigating the spatial specificity of S2-SSFP fMRI: A Monte Carlo simulation approach. Magn. Reson. Imaging 2017;37:282–289.
8. Gao J, Miller I, Lai S, Xiong J, Fox PT. Quantitative Assessment of Blood Inflow Effects in Functional MRI Signals. Magn Reson Med 1996;0:314–319.
9. Spees WM, Yablonskiy DA, Oswood MC, Ackerman JJH. Water proton MR properties of human blood at 1.5 Tesla: Magnetic susceptibility, T1, T2, T* 2, and non‐Lorentzian signal behavior. Magn Reson Med 2001;45:533–542.
10. Ogawa S, Menon RS, Tank DW, Kim SG, Merkle H, Ellermann JM, Ugurbil K. Functional brain mapping by blood oxygenation level-dependent contrast magnetic resonance imaging. A comparison of signal characteristics with a biophysical model. Biophys J 1993;64:803–812.
11. Grubb RL, Raichle ME, Eichling JO, Ter-Pogossian MM. The effects of changes in PaCO2 cerebral blood volume, blood flow, and vascular mean transit time. Stroke 1974;5:630–639.
12. Lee S, Duong TQ, Yang G, Iadecola C, Kim S. Relative Changes of Cerebral Arterial and Venous Blood Volumes During Increased Cerebral Blood Flow : Implications for BOLD fMRI. Magn Reson Med 2001;800:791–800.
Figures