4649
Vascular Origins of “Anti-correlations” in Resting-State fMRI1Department of Medical Biophysics, University of Toronto, Toronto, ON, Canada, 2Rotman Research Institute, Baycrest, Toronto, ON, Canada
Synopsis
Several explanations for the existence of anti-correlations in rsfMRI have been suggested so far, ranging from true neural activity to a side effect of preprocessing. In this abstract, we investigate the possible vascular origins of anti-correlation by presenting a biophysical model that is inspired by past simulation studies. Our model suggests resting-state BOLD anti-correlations across voxels may arise simply from the physiological and magnetic properties of arterial and venous blood, and may not be solely due to anti-correlated neural activity.
Introduction:
The origin of the so-called anti-correlated networks in resting-state fMRI (rsfMRI) has been a matter of debate thus far1. Initially suggested to originate from the intrinsically anti-correlated neural activity2, it has later been argued that it could be a result of global-signal regression (GSR)3. Nevertheless, these networks have also been found even without GSR4. This study was motivated by recent work that revealed potential anti-correlations between BOLD signals in arteries and veins in the resting state5,6. Here, we present a biophysical model that is able to predict anti-correlations between resting-state BOLD signals originating from arteries and veins. This model can simultaneously account for inflow effects, the CBF-CBV relationship in the vasculature and the time-varying blood-tissue susceptibility differences. Our work presents a possible vascular origin for the observed resting-state anti-correlations.Materials and Methods:
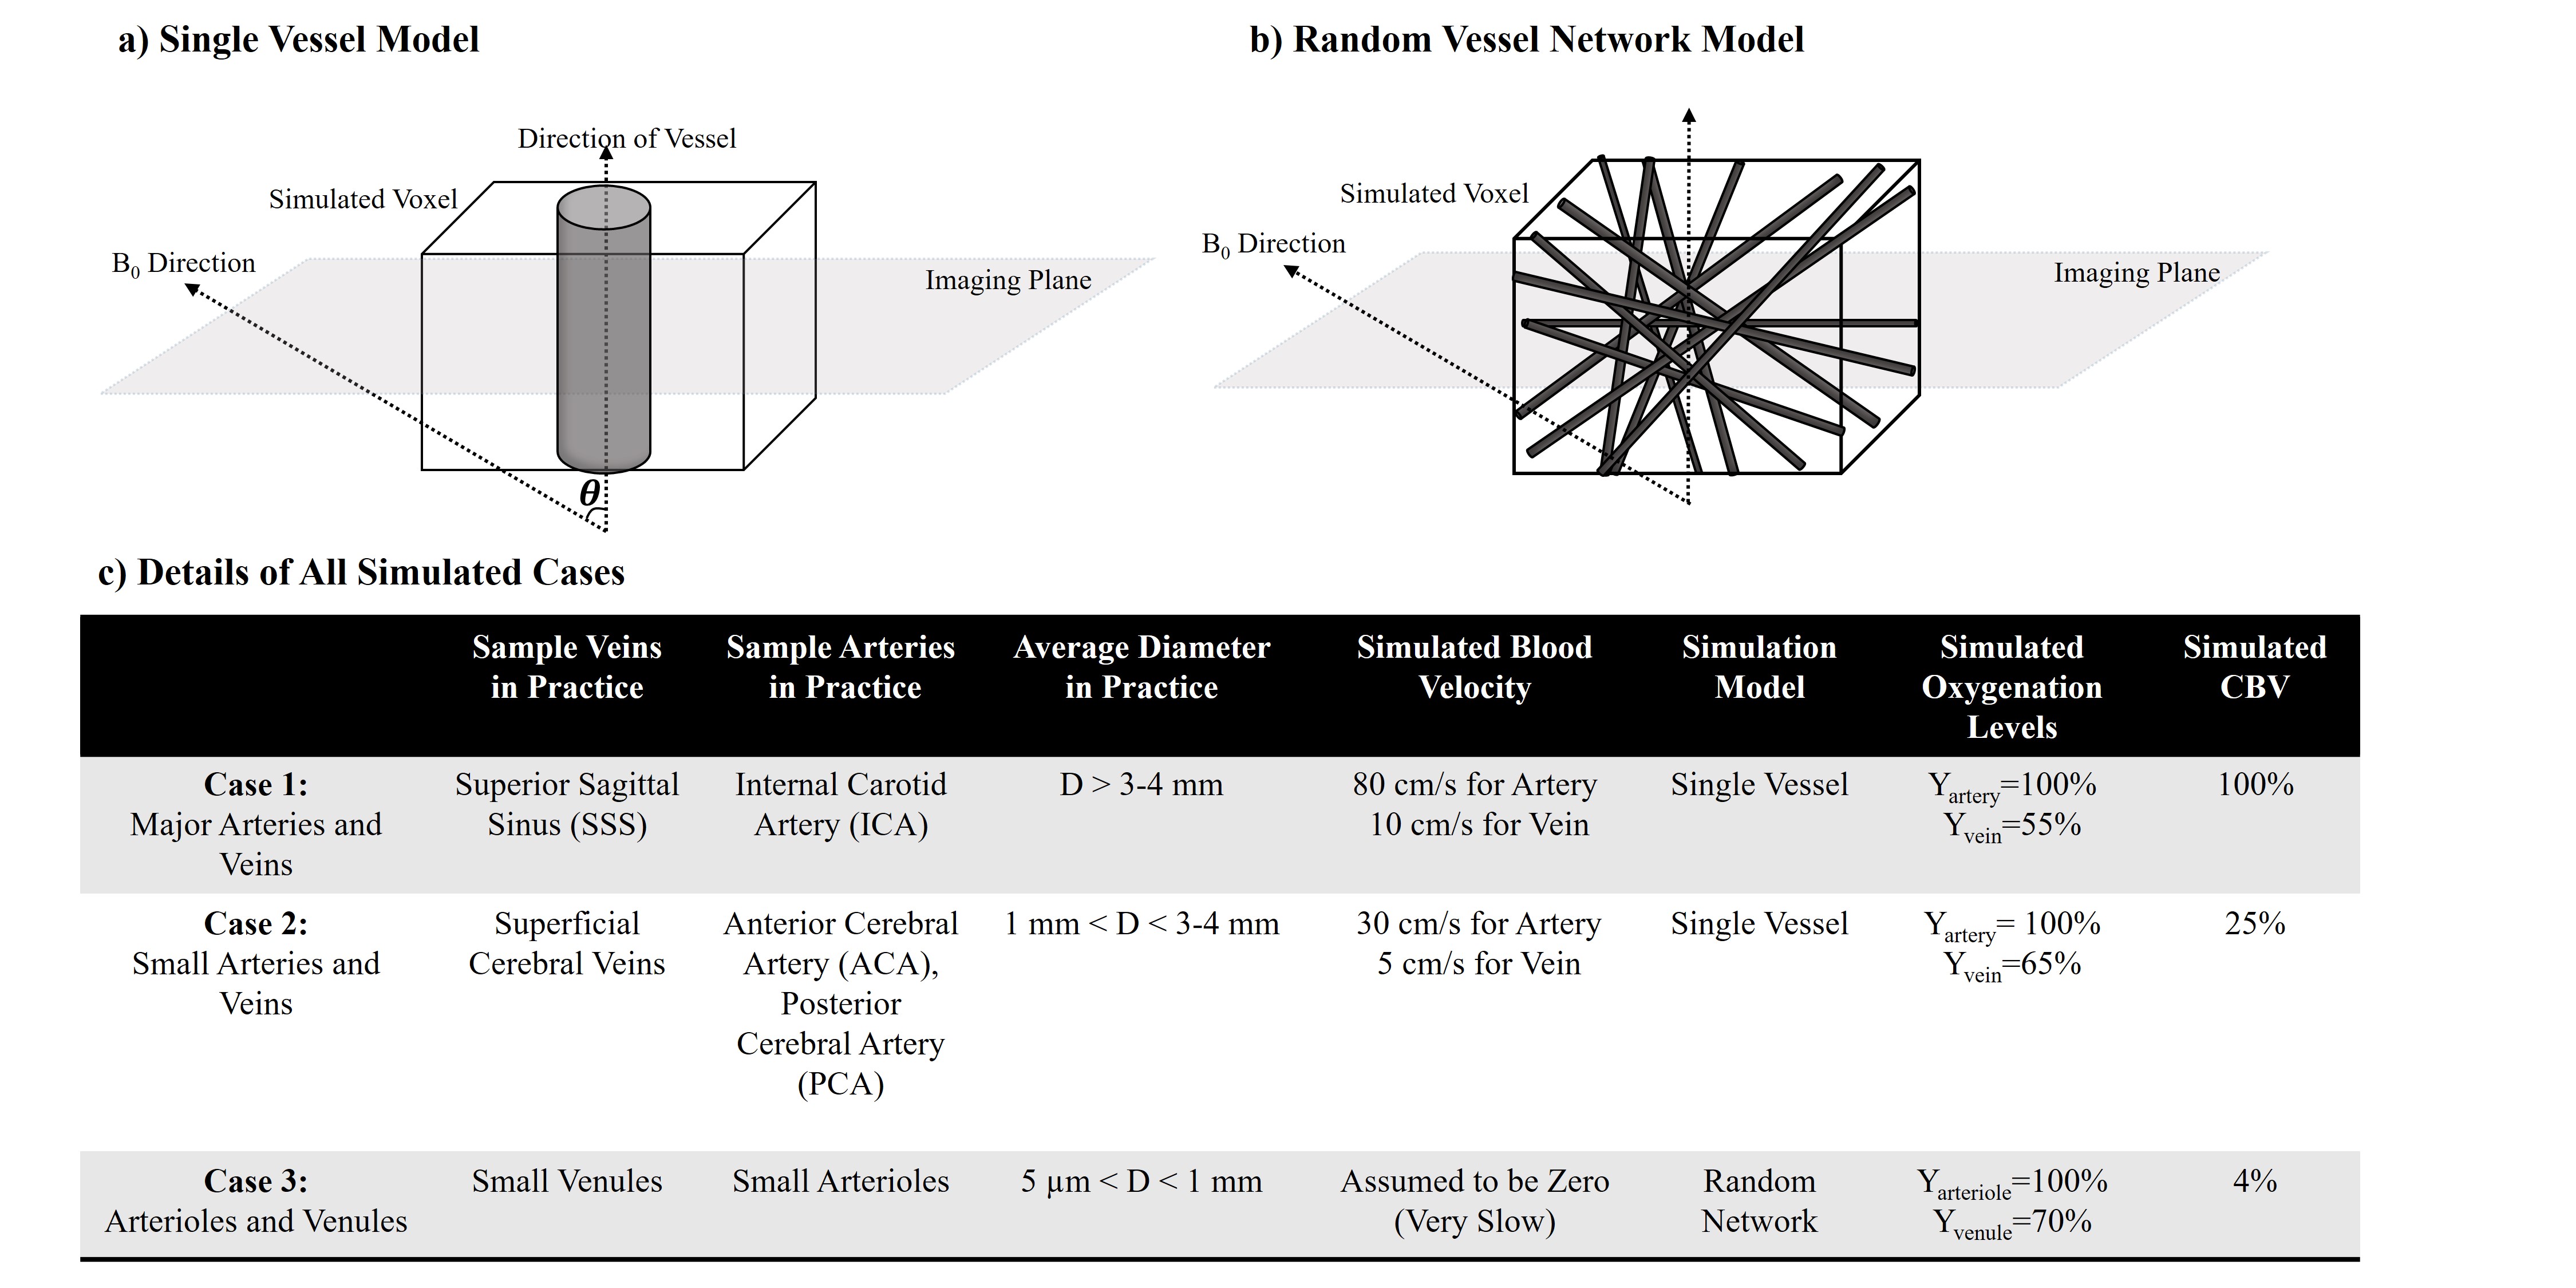
We simulated single-voxel BOLD signal time courses for 2 scenarios: 1) large-vessel scenario, a single vessel located along the central axis of the voxel surrounded by grey-matter (GM) tissue7; 2) capillary scenario, a random network of vessels set in a GM milieu8 (See Fig 1). The matrix form of the Bloch equation was used for all simulations, assuming B0=3T and T1, blood and T1, tissue values of 1647ms and 1465ms, respectively9. Single-shot gradient-echo EPI (with slice thickness=5 mm) was simulated with two different TRs and using FA equal to Ernst angle in each case: TR1=2000ms\FA1=75° (Long TR) and TR2=350ms\FA2=38° (Short TR) while TE=30ms was used in both cases. Although tissue T2 was chosen to be 77ms8 in 3T, for the intravascular T2* change as a result of blood oxygenation change the following approximation was used in 3T8:
$$T_2^*blood(Y)=(\frac{1}{(13.8+181 \times (1-Y)^2})$$
Blood-inflow effects were only simulated for the single-vessel model and by assuming a 90-degree angle between the direction of the vessel and the imaging plane. We applied laminar flow with a parabolic velocity profile10. The susceptibility difference between blood and surrounding tissue was evaluated using the well-known formulations in Spees et al.11. Extravascular signal de-phasing was evaluated by either using: 1) The Yablonskiy et al.7 model for single vessel condition or 2) The T2* correction for random network model based on Uludag et al.8.
As CBF changes are highly representative of neural activity, we simulated an intrinsic CBF change in rs-fMRI by using a typical rs-fMRI frequency of 0.1 Hz12. We assumed a sinusoidal function with a 12% peak-to-peak amplitude fluctuation13 over 50 seconds:
$$V(t)=V_{baseline}+V_{baseline}\times0.12\times sin(0.1\times 2 \pi t)$$
Where V stands for blood velocity.
Since CBF induced CBV change was shown to be of major importance in the presence of inflow14, a linear approximation of the Grubb’s law was used in which relative CBV and CBF changes are related to each other as in15:
$$Artery,Arteriole:\triangle relative CBV=0.79 \times\triangle relative CBF$$
$$Vein,Venule:\triangle relative CBV=0.15 \times\triangle relative CBF$$
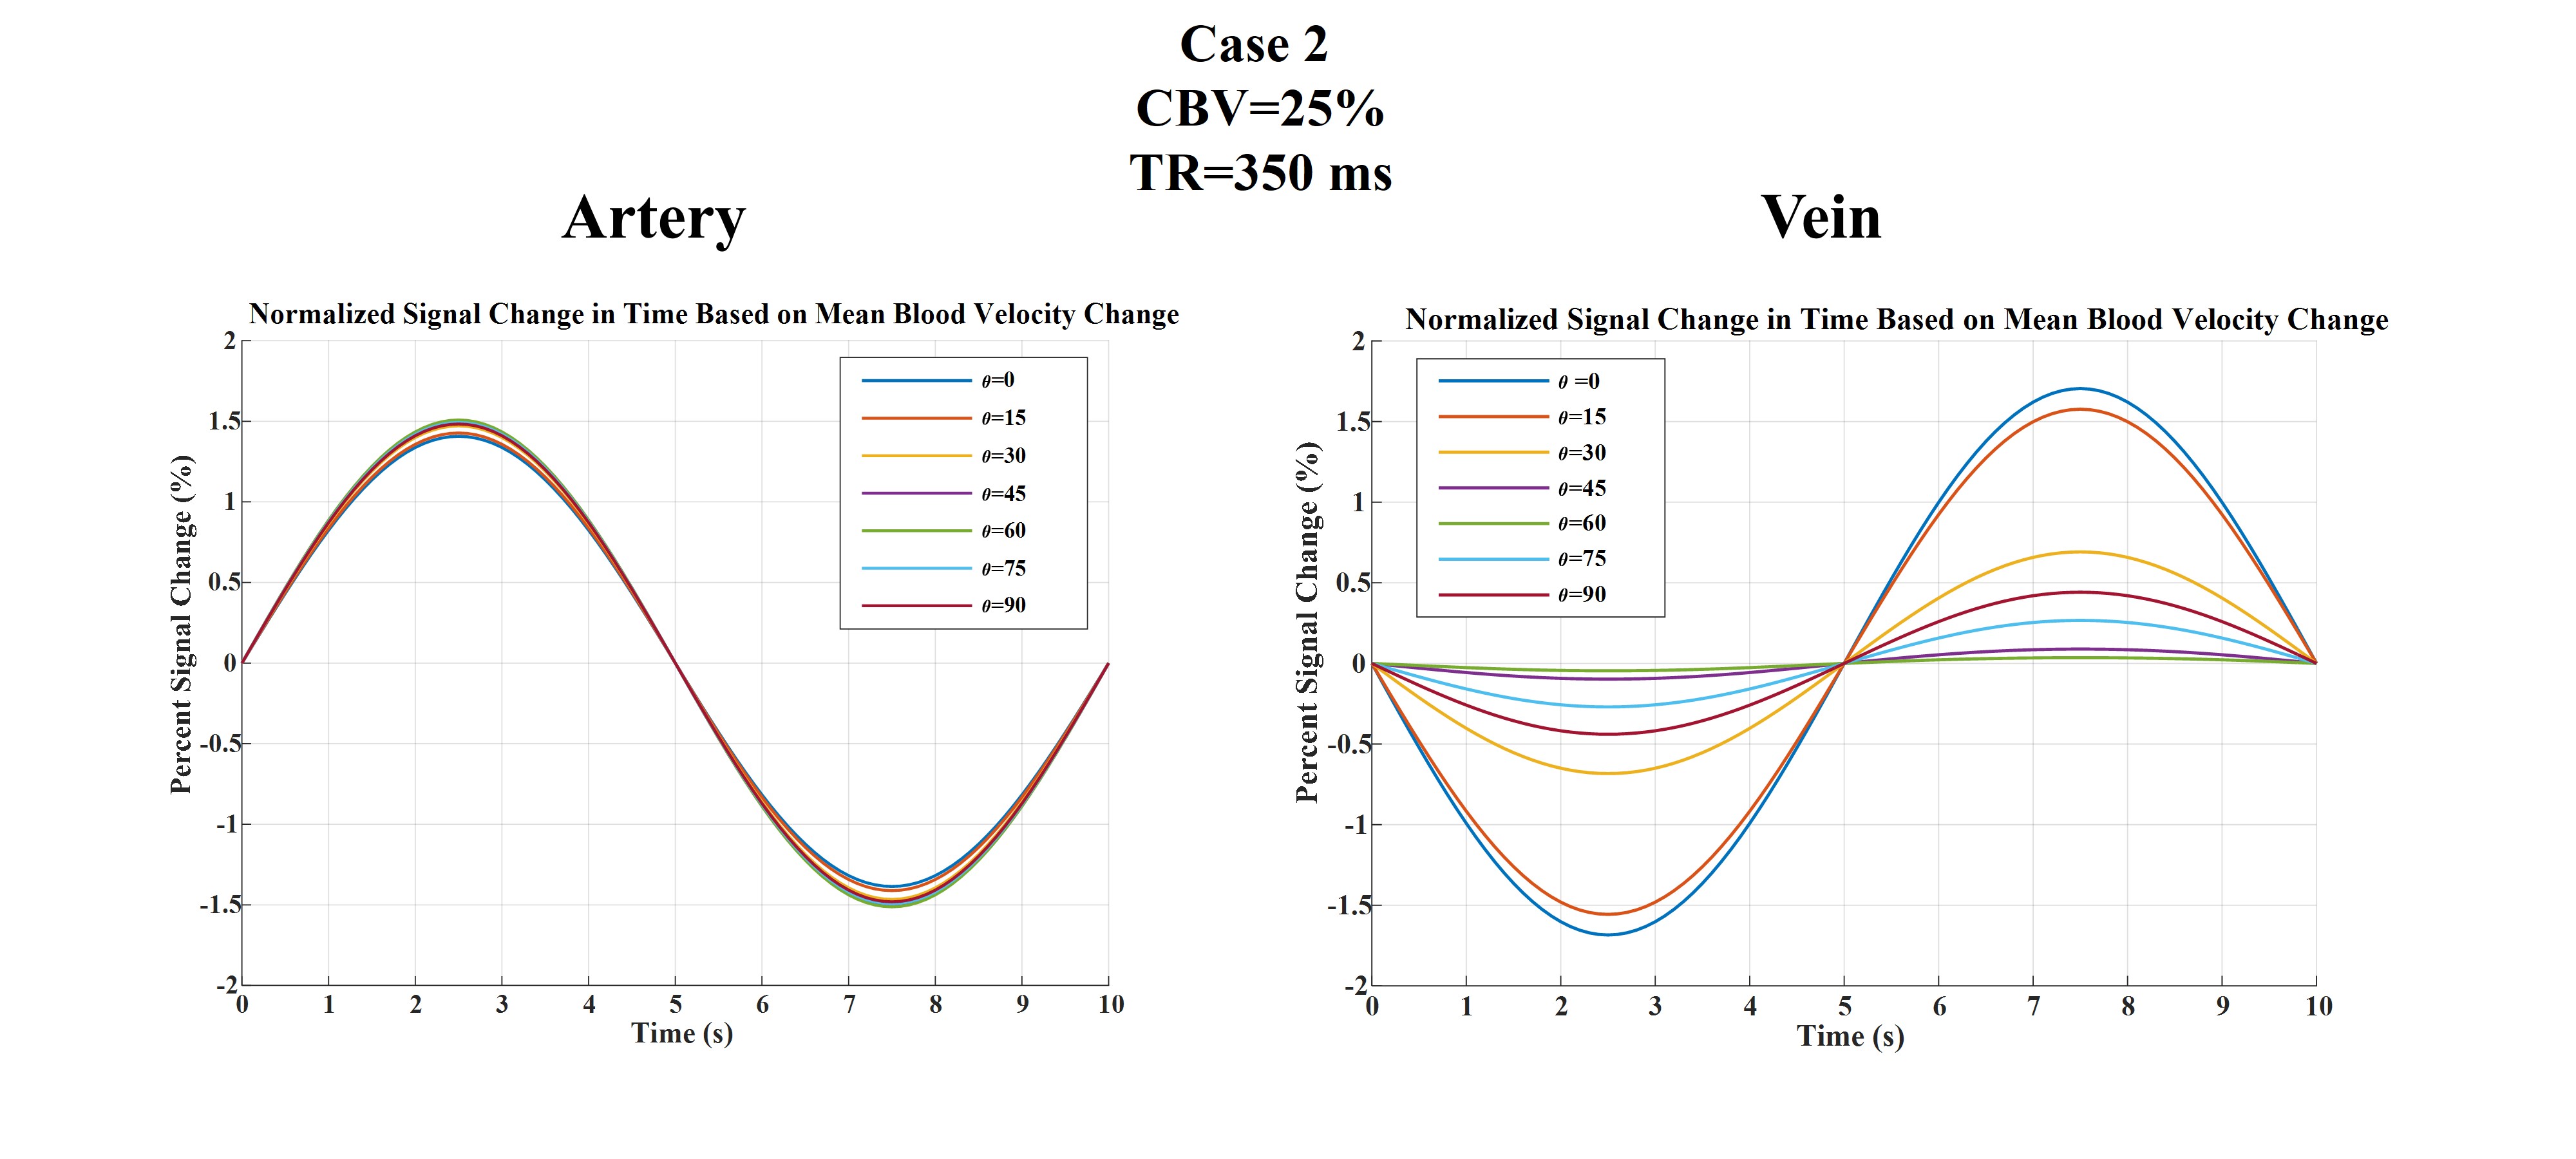
Based on all mentioned parameters, three exemplary cases were simulated. Their details are shown in Fig 1-c. Note that in cases 1, CBV still changes as in case 2 even though no inflow was assumed in this case. Also note that in case 3, CBV change is not possible since CBVbaseline is equal to 100%.
Results:
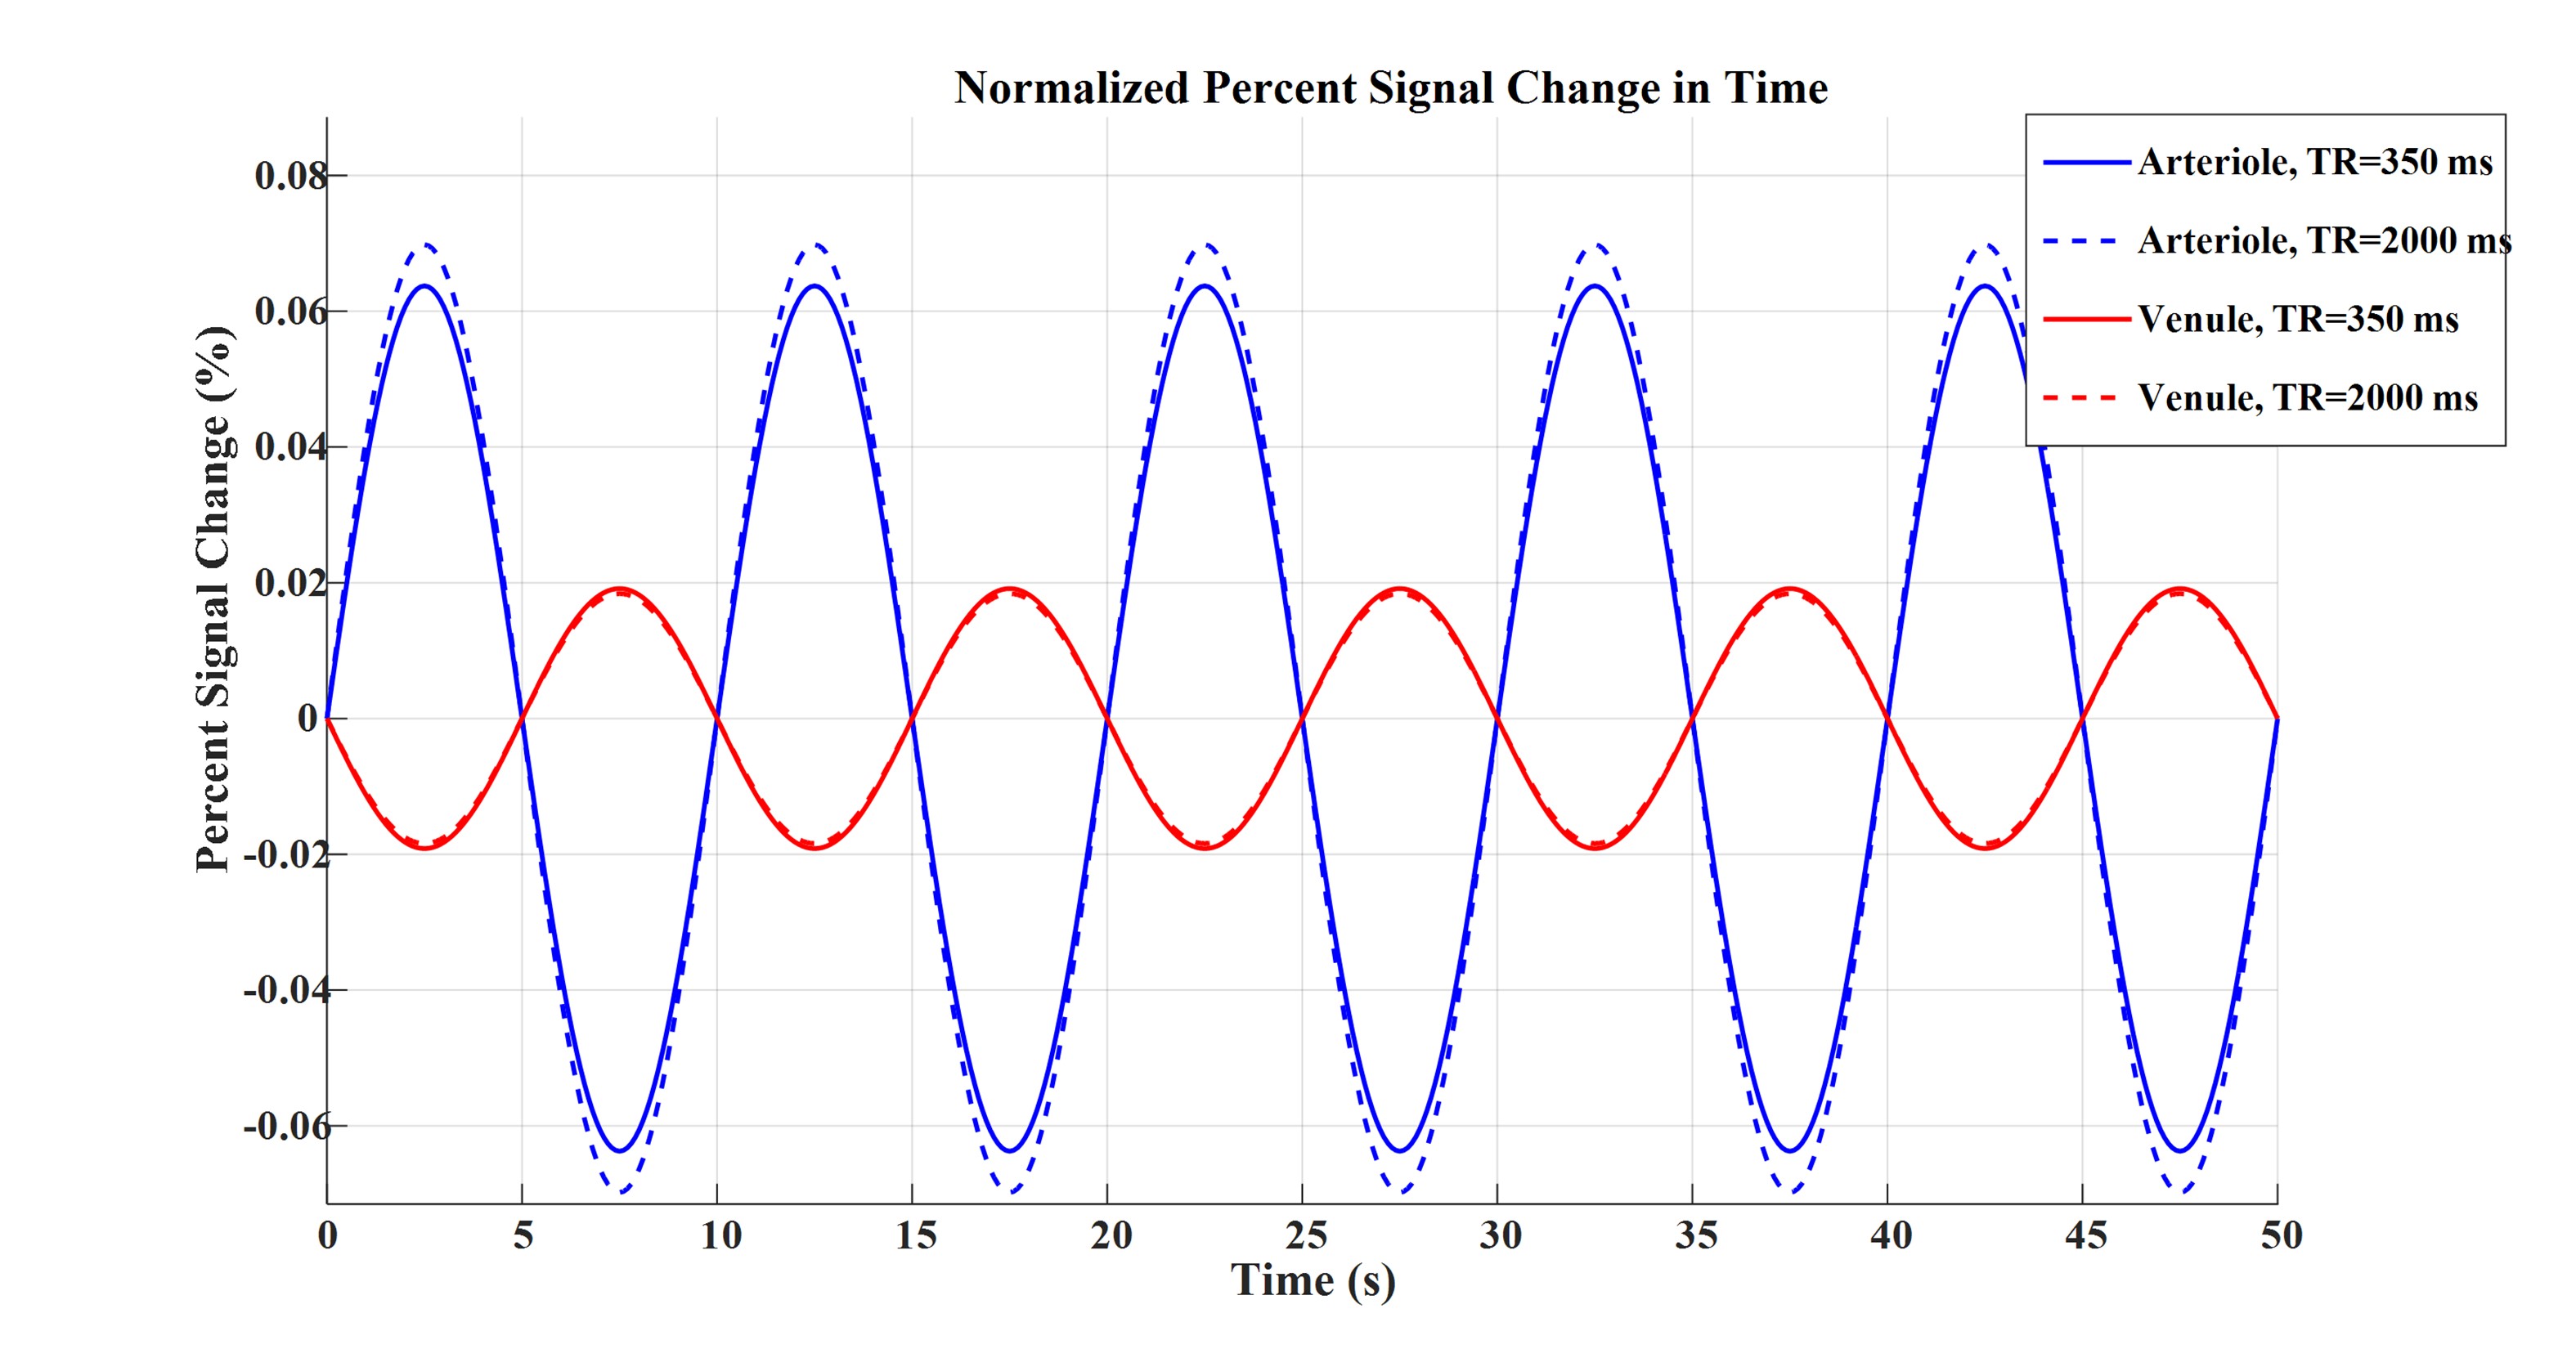
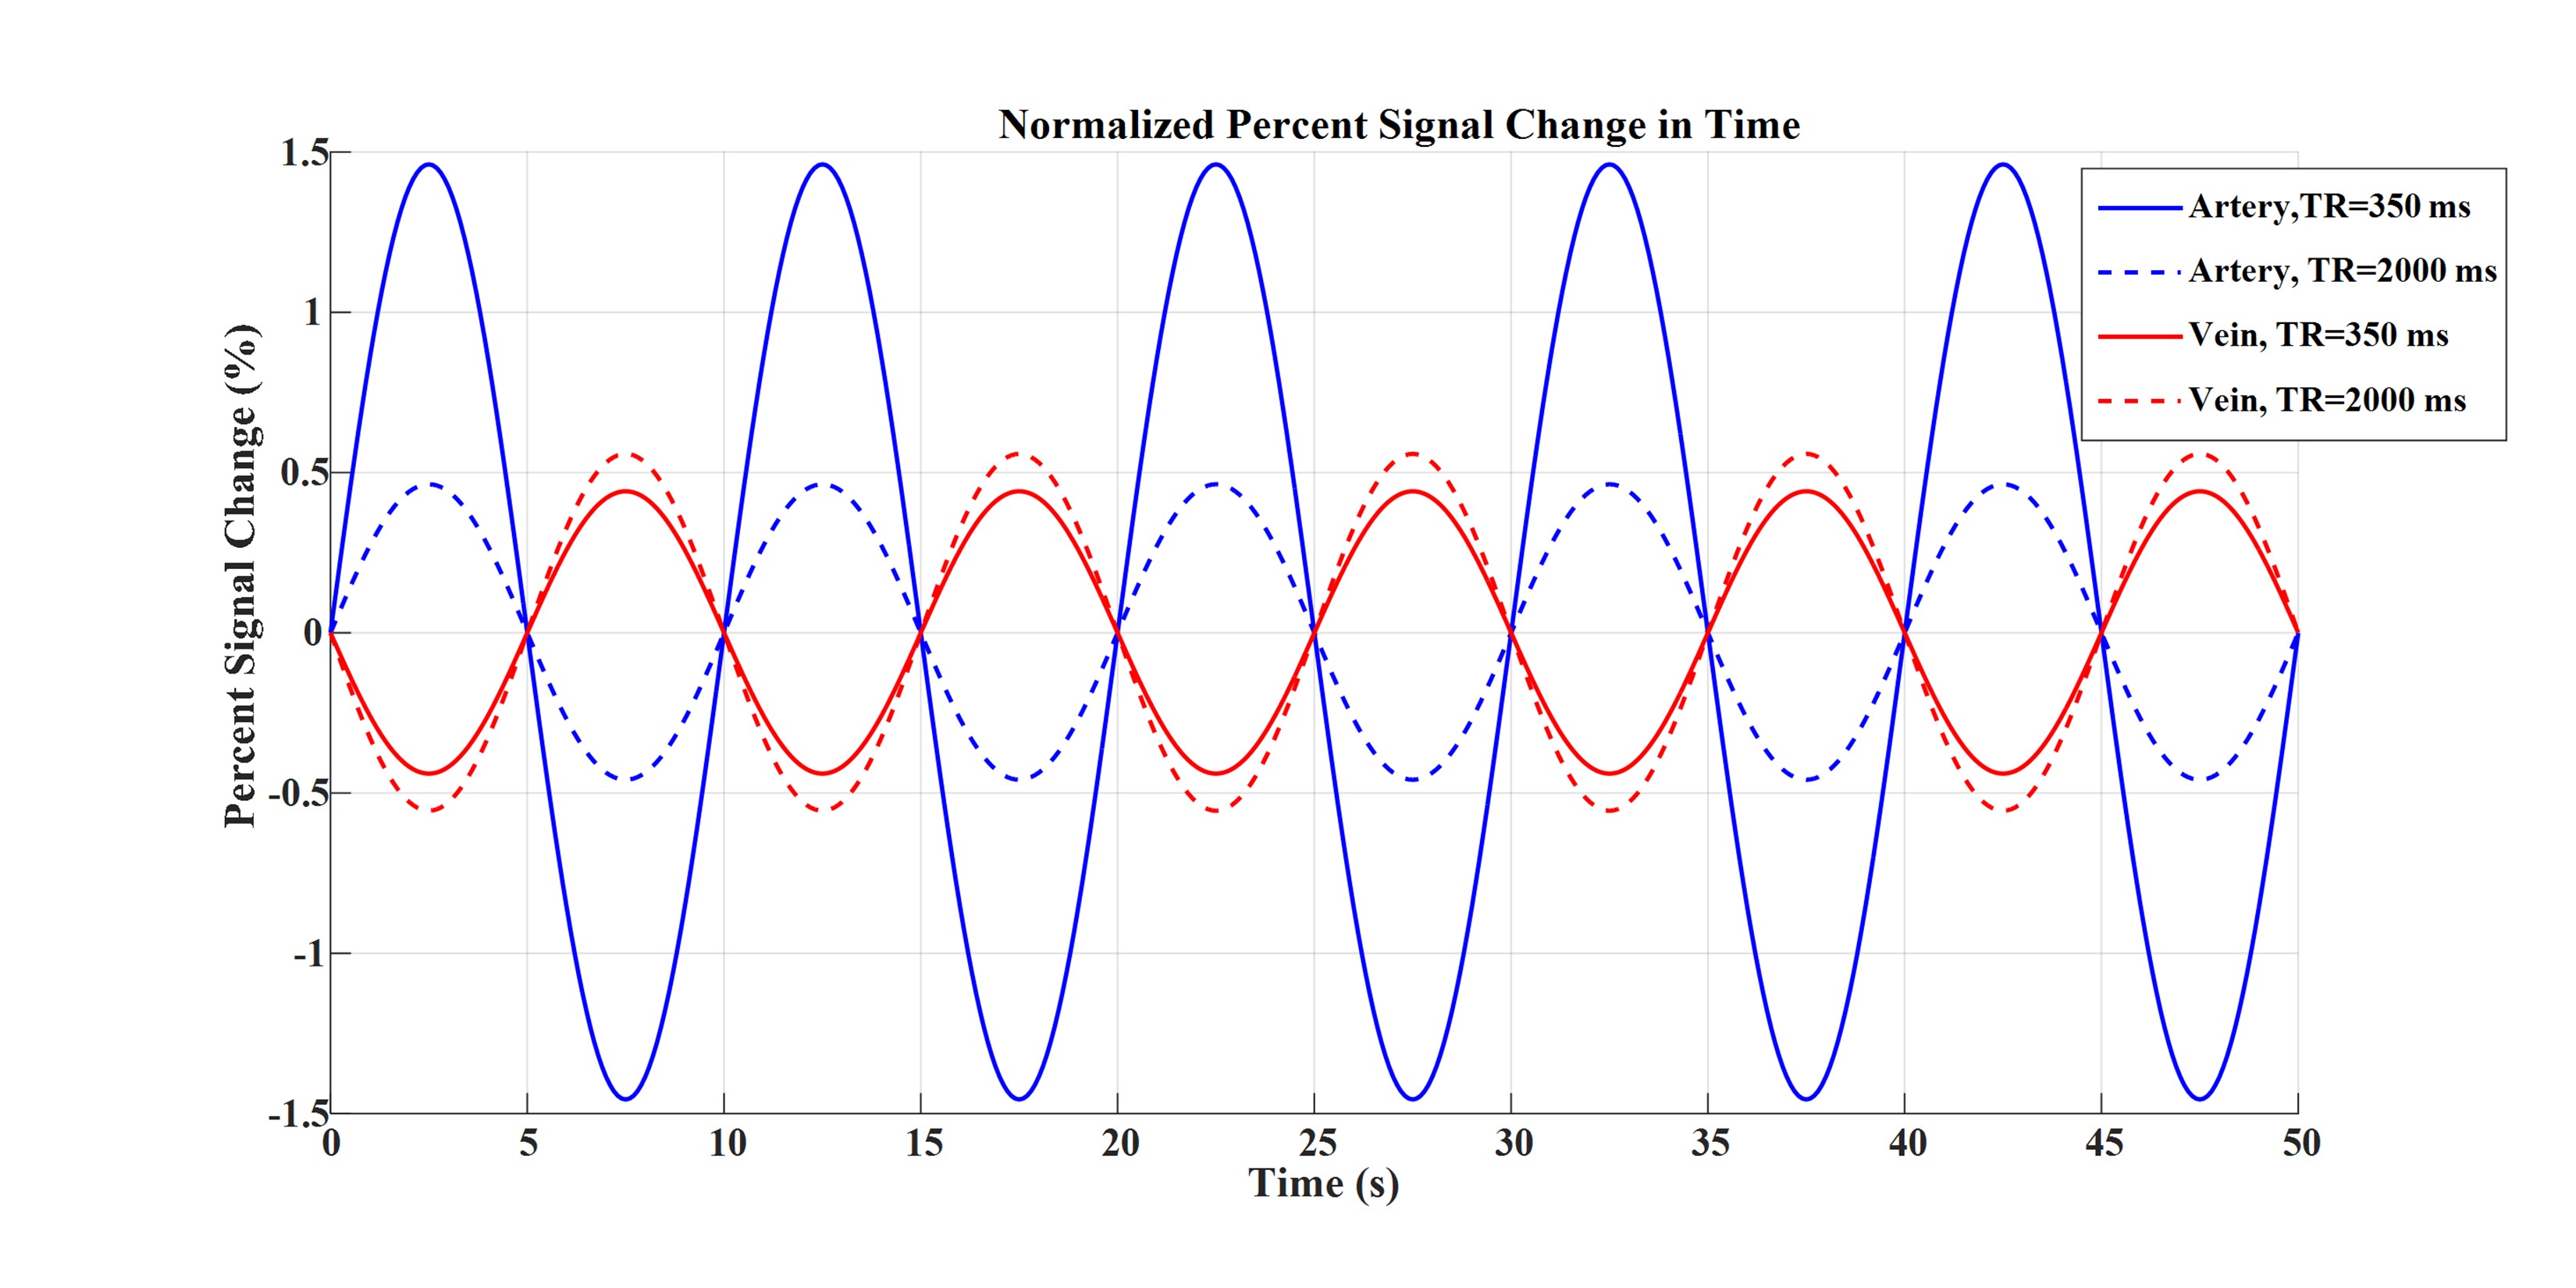
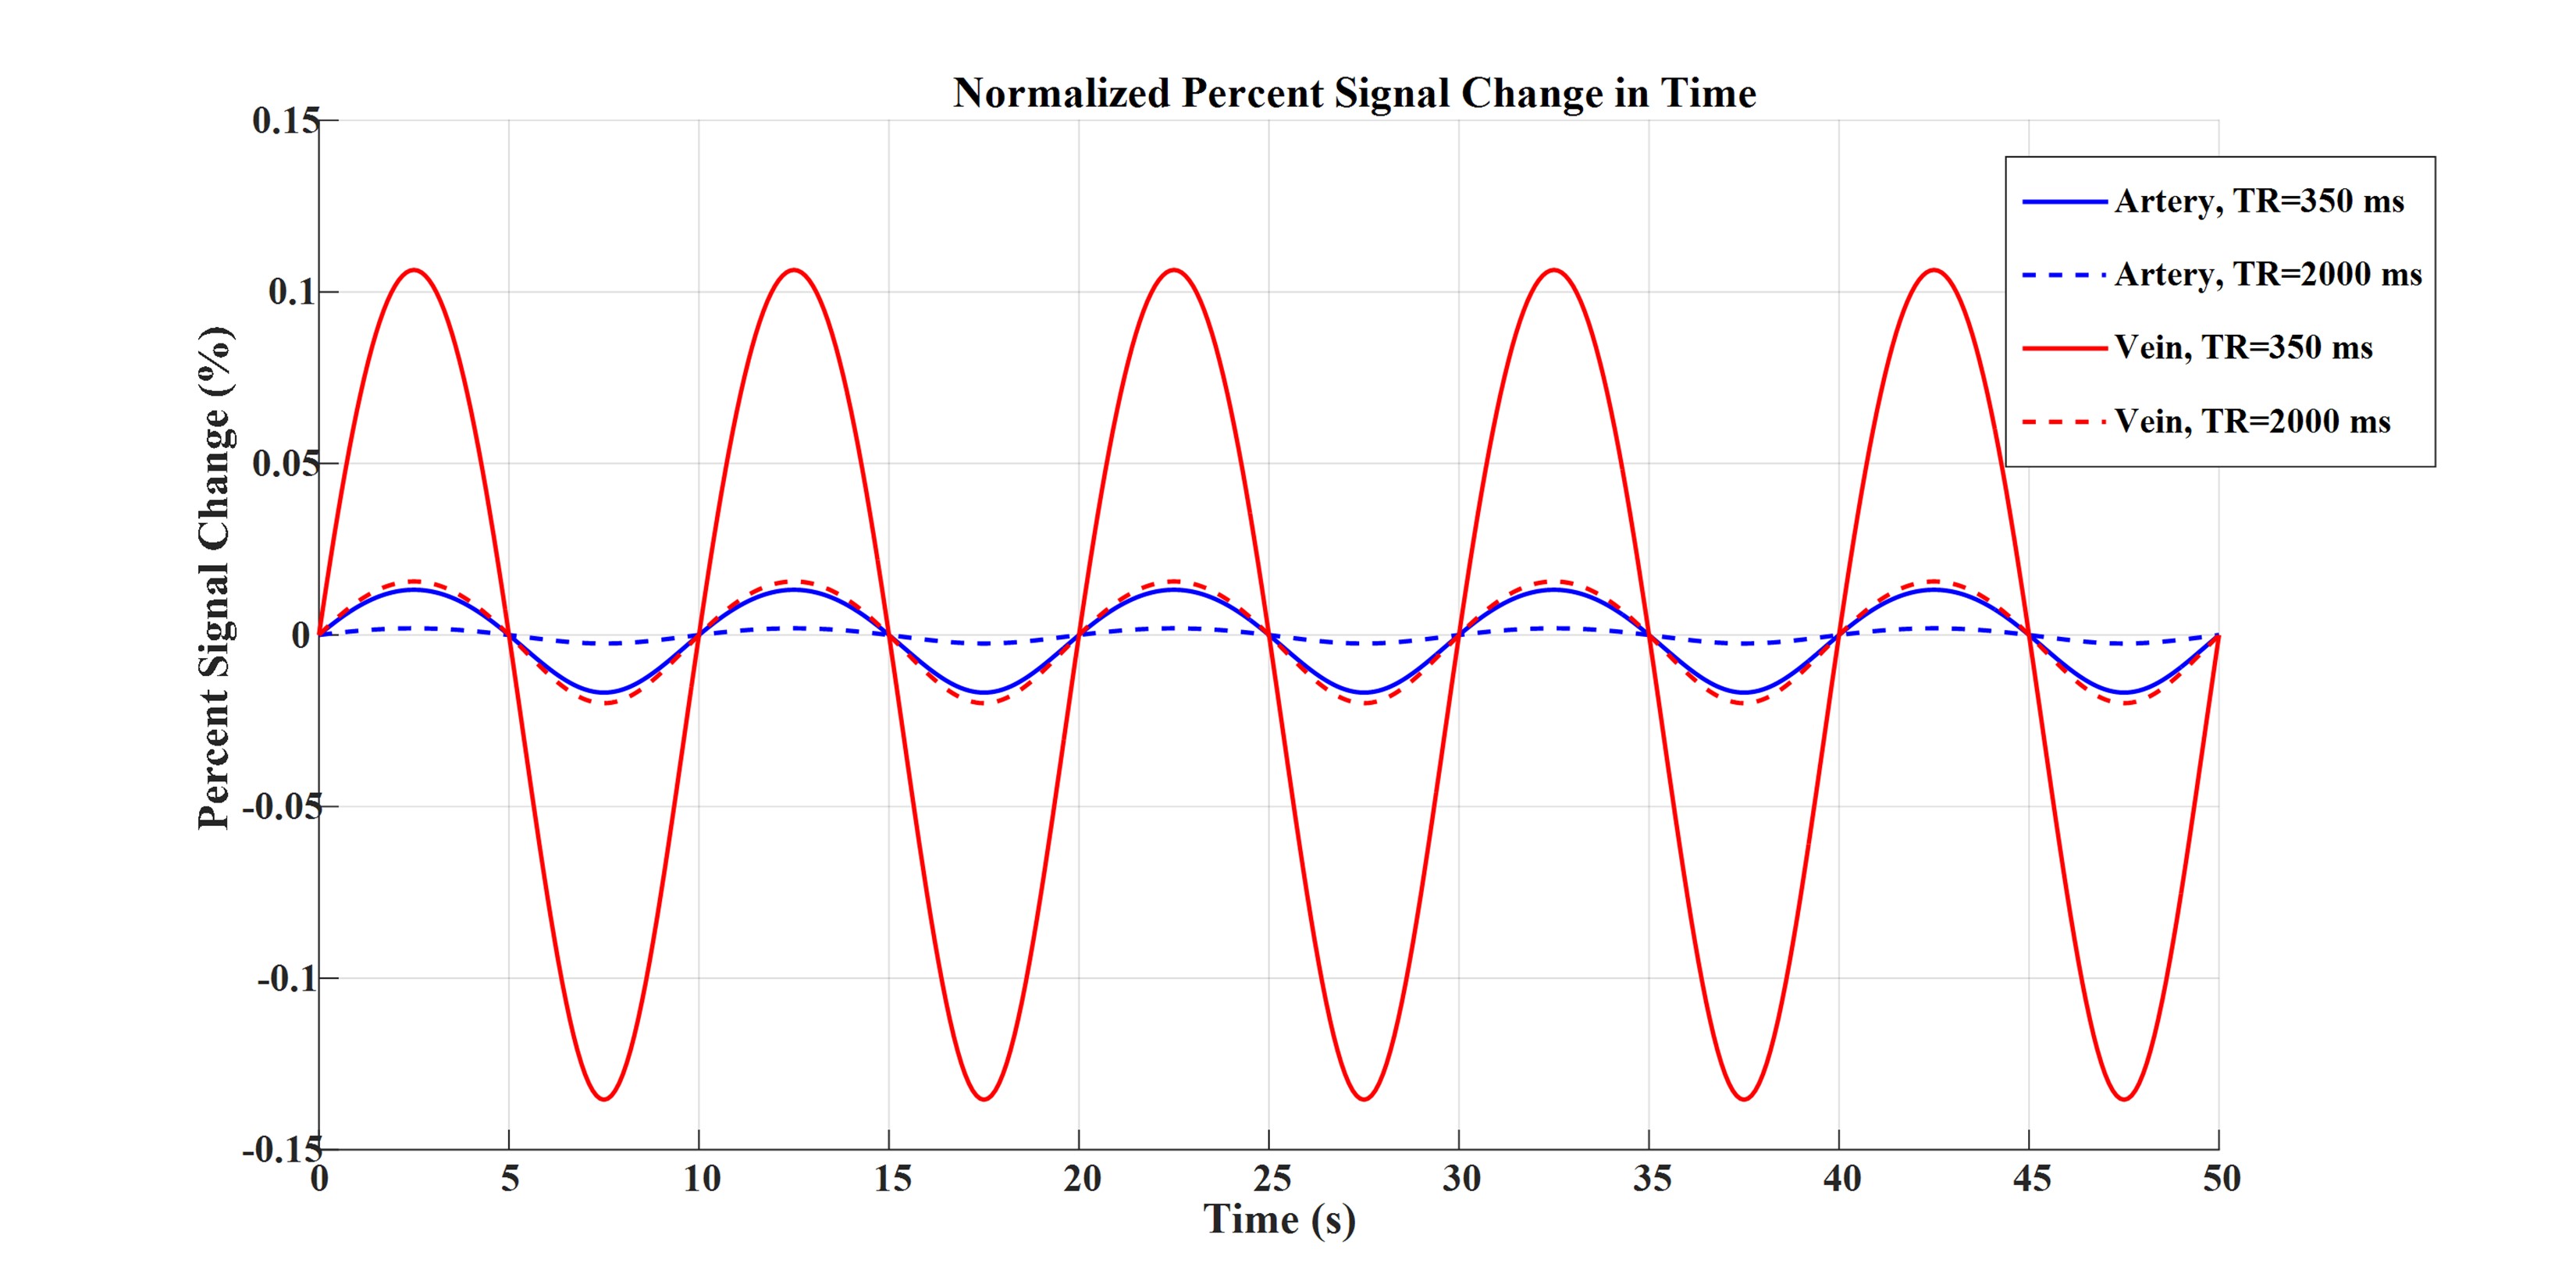
Figures 2 to 4 represent the results of all the three simulated cases described in Figure 1-c. Vascular-related anti-correlations can be clearly seen in cases 1-2. For one of the cases (case 2 with TR=350 ms), we also investigated the effect of the vessel-orientation change on our results (Figure 5), and we show that anti-correlations between artery and vein consistently holds for all θ values.Discussion and Conclusion:
Inflow effect provides unsaturated blood likely with much higher signal compared to the surrounding tissue. However, CBV change and extravascular signal de-phasing are major contributors to the anti-correlations. In fact, in case 3, where no CBV change exists, no anti-correlation was observed.
Evidently, the propagation of CBV change from the arterial to venous side will introduce a delay, but at transit delays under 1/4 of the period of the underlying BOLD signal16,17, the anti-correlation exists for both cases 1 and 2.
To summarize, we showed that anti-correlations between rsfMRI signals can simply result from arterial and venous blood CBV changes, even if they both arise from the same neural-activity time series.
Acknowledgements
No acknowledgement found.References
1. Murphy K, Fox MD. Towards a consensus regarding global signal regression for resting state functional connectivity MRI. Neuroimage 2017;154:169–173.
2. Fox MD, Snyder AZ, Vincent JL, Corbetta M, Essen DC Van, Raichle ME. The human brain is intrinsically organized into dynamic, anticorrelated functional networks. Proc Natl Acad Sci U. S. A. 2005;102:9673–9678.
3. Murphy K, Birn RM, Handwerker DA, Jones TB, Bandettini PA. NeuroImage The impact of global signal regression on resting state correlations : are anti-correlated networks introduced ? Neuroimage 2009;44:893–905.
4. Chai XJ, Nieto A, Öngür D, Whit S. Anticorrelations in resting state networks without global signal regression. NeuroImage 2012;59:1420–1428.
5. Tong Y, Hocke LM, Fan X, Janes AC, Frederick B. Can apparent resting state connectivity arise from systemic fluctuations ?. Front Hum Neurosci 2015;9:1–13.
6. Tak S, Wang DJJ, Polimeni JR, Yan L, Chen JJ. Dynamic and static contributions of the cerebrovasculature to the resting-state BOLD signal. Neuroimage 2014;84:672–680.
7. Yablonskiy DA, Haacke EM. Theory of NMR signal behavior in magnetically inhomogeneous tissues: the static dephasing regime. Magn Reson Med 1994;32:749–763.
8. Uludağ K, Müller-Bierl B, Uğurbil K. An integrative model for neuronal activity-induced signal changes for gradient and spin echo functional imaging. Neuroimage 2009;48:150–165.
9. Khajehim M, Nasiraei Moghaddam A. Investigating the spatial specificity of S2-SSFP fMRI: A Monte Carlo simulation approach. Magn Reson Imaging 2017;37:282–289.
10. Gao J, Miller I, Lai S, Xiong J, Fox PT. Quantitative Assessment of Blood Inflow Effects in Functional MRI Signals. Magn Reson Med 1996;0:314–319.
11. Spees WM, Yablonskiy DA, Oswood MC, Ackerman JJH. Water proton MR properties of human blood at 1.5 Tesla: Magnetic susceptibility, T1, T2, T* 2, and non‐Lorentzian signal behavior. Magn Reson Med 2001;45:533–542.
12. Van Den Heuvel, Martijn P., and Hilleke E. Hulshoff Pol. Exploring the brain network: a review on resting-state fMRI functional connectivity. Eur. Neuropsychopharmacol 2010;20:519–534.
13. Mark CI, Slessarev M, Ito S, Han J, Fisher JA, Pike GB. Precise control of end‐tidal carbon dioxide and oxygen improves BOLD and ASL cerebrovascular reactivity measures. Magn Reson Med 2010;64:749–756.
14. Wu C, Chen J, Liu H. Dependence of Inflow Effect in BOLD fMRI Signal on Magnetic Fields. ISMRM 13th Annu. Meet. 2005;199.
15. Lee S, Duong TQ, Yang G, Iadecola C, Kim S. Relative Changes of Cerebral Arterial and Venous Blood Volumes During Increased Cerebral Blood Flow : Implications for BOLD fMRI. Magn Reson Med 2001;800:791–800.
16. Crandell D, Moinuddin M, Fields M, Friedman BI, Robertson J. Cerebral transit time of 99mtechnetium sodium pertechnetate before and after cerebral arteriography. J. Neurosurg 1973;38:545–547.
17. Tong Y. Time lag dependent multimodal processing of concurrent fMRI and near-infrared spectroscopy (NIRS) data suggests a global circulatory origin for low-frequency oscillation signals in human brain. Neuroimage 2010;53:553–564.
Figures