4648
Infrequent auditory stimuli elicit BOLD signals of shorter duration1Institute of Biomedical Engineering, National Taiwan University, Taipei, Taiwan, 2Facultad de Estudios Superiores Iztacala (FES-I), Universidad Nacional Autónoma de México, Mexico City, Mexico, 3Department of Neuroscience and Biomedical Engineering, Aalto University, Espoo, Finland
Synopsis
To characterize the hemodynamic responses of mismatch negativity, we measured BOLD signals elicited by frequent and infrequent sequences of sounds using fast fMRI acquisitions with 0.1 s precision. The average temporal width of the hemodynamic responses was 4.2 s in the superior temporal areas. The width of hemodynamic responses was significantly wider in the standard (4.9 s +/- 1.1 s) than the deviant trials (3.6 s +/- 1.7 s).
PURPOSE
Mismatch negativity (MMN) responses are elicited when an infrequent event is embedded in a sequence of repeated events1. MMN is a pre-attentive neural response to detect changes and has been widely used to study speech perception and related pathologies2. The main neural generators of MMN are localized to the superior temporal areas bilaterally3. MMN hemodynamic responses have also been consistently reported in fMRI studies4-6. However, most of these studies used block design, and the temporal characteristics of hemodynamic responses have not been quantitatively described. In this study, we measured BOLD signals associated with MMN using BOLD-contrast fMRI data collected at 10 Hz7. Based on previous fMRI studies showing that attention can modulate fine temporal features of BOLD responses8, we hypothesized that characteristic MMN responses exhibit not only in the response amplitude, but also temporal features.METHODS
Subjects (n = 9) were recruited to this study with written informed consents approved by the Institute Review Board of National Taiwan University Hospital. Frequent stimuli were pure tones of 1000 Hz and 50 ms duration, and infrequent stimuli were 1000 Hz and 100 ms duration. The stimulus onset-to-onset interval of each pure tone was 500ms. A trial was designed to contain a sequence of pure tones (ranging from 12 to 20 pure tones in 6 s to 10 s). A standard trial consisted of a sequence of frequent tones, whereas a deviant trial consisted of a sequence of frequent tones (probability = 0.9) interspersed with infrequent tones (probability = 0.1). Subjects were instructed to watch a movie of their choice during fMRI scanning. fMRI data were collected on a 3T scanner (Skyra, Siemens) using a 32-channel head coil array. We used the simultaneous multi-slice inverse imaging (SMS-InI)7 to acquire data. Imaging parameters were: TR =0.1 s, TE =25/27.5 ms, flip angle =30o. Each run of the experiment lasted for 344 s. Four runs of data were collected for each subject. 3D T1-weighted structural images were also collected (MP-RAGE sequence) for visualization and localizing anatomical landmarks (FreeSurfer).
Functional data were first volumetrically reconstructed using a regularized SENSE algorithm9. Physiological noise was corrected with DRIFTER10. Hemodynamic response functions (HRFs) for each trial type were estimated by the General Linear Model (GLM) using finite impulse response basis functions that allow HRF of arbitrary shapes11. To quantify temporal characteristics of HRF, we estimated time-to-peak, onset, time-to-half height preceding the peak, time-to-half after the peak, and full-width-at-half-maximum (FWHM) within the ROI. BOLD signals elicited by the standard and deviant trials were compared regarding their response amplitudes and temporal characteristics.
RESULTS
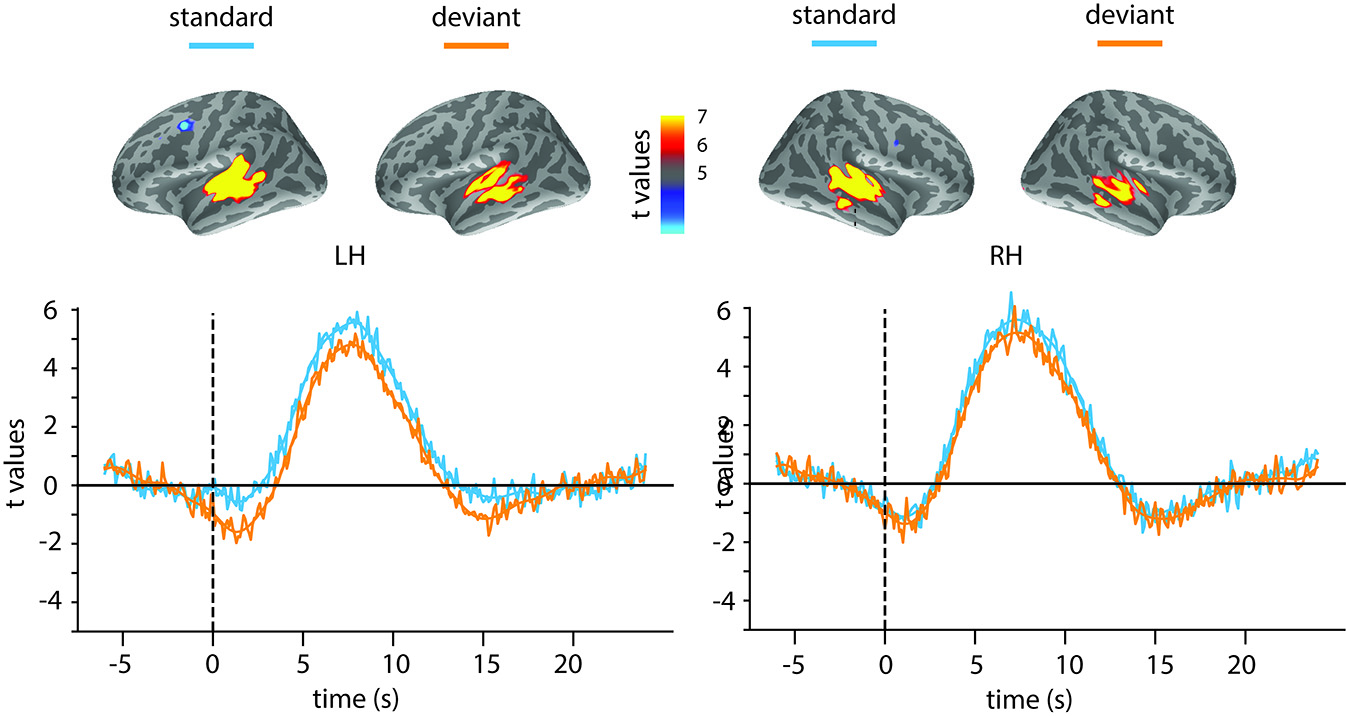
Strong BOLD signals were found in the superior temporal areas of the left (LH) and right hemispheres (RH). Hemodynamic responses peaked around 7 s after the onset of each trial and returned to baseline about 11 s after the trial onset (Figure 1).
Averaged across subjects, there were no significant differences between the HRF peak amplitude between the standard (LH: 8.0 +/- 3.3, RH: 7.8 +/- 3.5) and deviant trials (LH: 7.4+/- 1.8, RH: 7.1 +/- 2.8). For temporal characteristics, deviant trials showed slightly delayed onset, slightly earlier time-to-peak, and narrower width than standard trials. But, time-to-peak did not differ significantly between the standard and deviant trials. No significant differences were found regarding the onset, time-to-half preceding the peak, and time-to-half after the peak between the standard and deviant trials. However, the BOLD FWHM was significantly different between the standard (4.9 s +/- 1.1 s) and deviant trials (3.6 s +/- 1.7 s) in the left hemisphere (p<0.05), but not in the right hemisphere (standard trials: 6.1.s +/- 4.4 s; deviant trials: 4.8 s +/- 0.9 s) (p=0.33) (Figure 2).
DISCUSSION
We used event-related design and fast imaging method to delineate temporal characteristics of BOLD signals associated with MMN with high temporal precision. An average temporal width of 4.2 s in the superior temporal areas aligns with the width of hemodynamic responses reported earlier11. Comparing hemodynamic responses between the standard and deviant trials, we found differences in the width of hemodynamic responses in the left temporal areas.
The width of hemodynamic responses to the deviant trials was significantly narrower than standard trials. Differences in the width were found to be below 1.5 s. Because differences in temporal characteristics between different stimuli were observed within the same cortical area, the timing differences were less likely affected by vascular contributions. The difference in timing but not in amplitude suggests that temporal features of BOLD signals may be used to more sensitively discriminate pre-attentive processes.
Acknowledgements
We thank Dr. Toshiaki Imada for discussion on this study. This work was partially supported by Ministry of Science and Technology, Taiwan (103-2628-B-002-002-MY3, 105-2221-E-002-104), and the Academy of Finland (No. 298131).References
1. Naatanen R, Gaillard AW & Mantysalo S. Acta Psychol (Amst).1978; 42:313-329.
2. Naatanen R, Paavilainen P, Rinne T, et al. Clin Neurophysiol.2007; 118:2544-2590.
3. Naatanen R & Alho K. Brain Topogr.1995; 7:315-320.
4. Molholm S, Martinez A, Ritter W, et al. Cereb Cortex.2005; 15:545-551.
5. Rinne T, Degerman A & Alho K. Neuroimage.2005; 26:66-72.
6. Sabri M, Kareken DA, Dzemidzic M, et al. Neuroimage.2004; 21:69-74.
7. Chu YH, Hsu YC & Lin FH. Proc Intl Soc Magn Reson Med.2016; 946 [abstract].
8. Chu YH, Lin J-F L, Wu PY, et al. Proc Intl Soc Magn Reson Med.2017; 5251 [abstract].
9. Lin FH, Kwong KK, Belliveau J.W, et al. Magn Reson Med.2004; 51:559-567.
10. Sarkka S, Solin A, Nummenmaa A, et al. Neuroimage.2012; 60:1517-1527.
11. Glover GH. Neuroimage.1999; 9:416-429.
Figures