4643
Probing the Signal Physiology of Resting-State fMRI at High Frequencies using Hypocapnia1Neurology, University of New Mexico, Albuquerque, NM, United States, 2Anesthesiology, University of New Mexico, Albuquerque, NM, United States, 3The Mind Research Network, Albuquerque, NM, United States, 4Neurology, Physics and Astronomy, University of New Mexico, Albuquerque, NM, United States, 5Radiology, University of Washington, Seattle, WA, United States
Synopsis
We investigate the dependence of high frequency signal changes on decreases in global blood flow using hyperventilation induced hypocapnia, which substantially alter the amplitude and time course of the hemodynamic response function (HRF) with only minor changes in neural activation levels. We also investigate the sensitivity of multi-band-EPI and a prototype ultra-high-speed multi-band-EVI (MB-EVI) sequence for detecting high frequency correlations. In the first subject, an increase in high frequency correlations during hypocapnia was detected in MB-EPI and MB-EVI. These studies suggest that high frequency signals changes may be mediated by vascular physiology, but movement related artifacts cannot be excluded.
Introduction
Recent studies using high-speed-fMRI techniques, including in our lab using high-speed multi-slab echo-volumar imaging (MEVI)1,2, have detected correlations in resting-state fMRI data at much higher frequencies (up to 5Hz) in the visual and the motor cortex 3-5 with significantly higher spatial-temporal stability than the corresponding low frequency (< 0.1Hz) connectivity. This approach has the potential for addressing principal limitations of mapping low-frequency resting-state connectivity, such as high sensitivity to signal drifts and long time scales necessary for separating major RSNs. However, the validity of high frequency correlations has been questioned due to conflicting results in different studies, which may in part be due to the low measurement sensitivity, and the lack of an identified biophysical mechanism6,7.In this study, we investigate the dependence of high frequency signal changes on decreases in global blood flow using hyperventilation induced hypocapnia, which substantially alter the amplitude and time course of the hemodynamic response function (HRF) with only minor changes in neural activation levels8,9. We also investigate the sensitivity of multi-band EPI and a prototype ultra-high-speed multi-band EVI (MB-EVI) sequence for detecting high frequency correlations.Methods
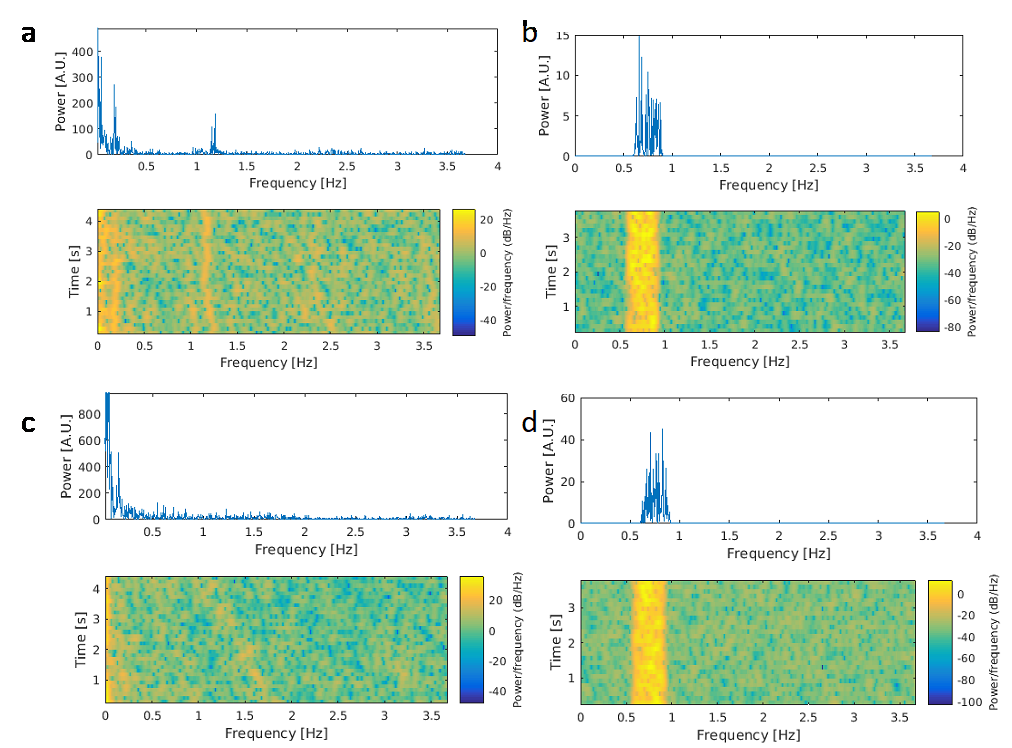
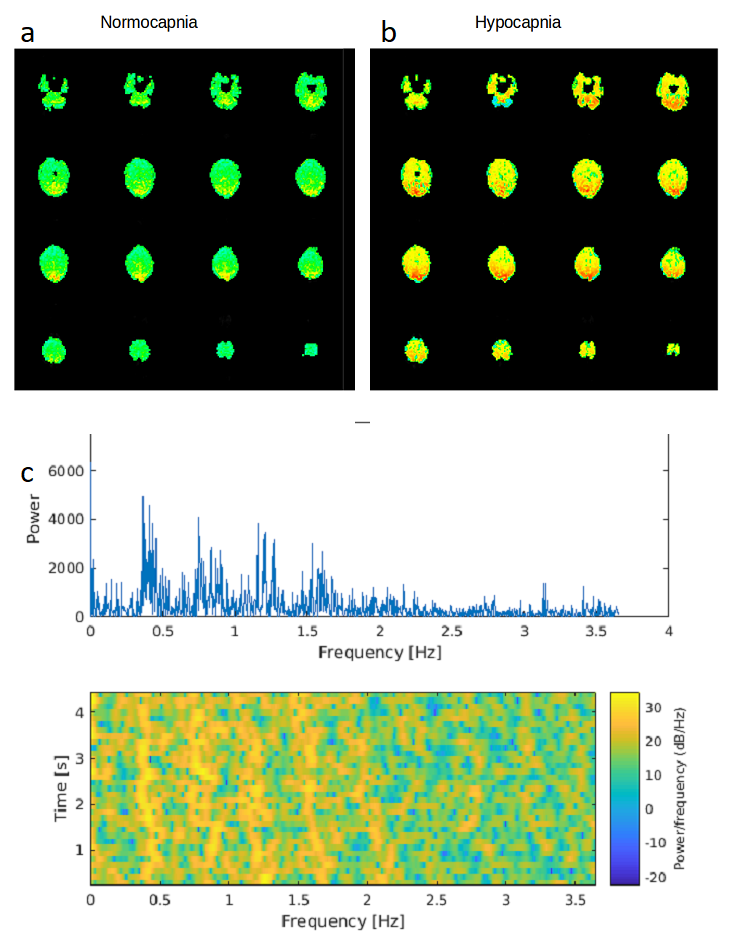
Resting-state fMRI (eyes open) during normocapnia (pETCO2: 40+/-2mmHg) and capnometry controlled hyperventilation (pETCO2: 19-25mmHg) was performed in 3 healthy male adults (22–40years) on a 3T scanner equipped with 32-channel array coil. Institutionally approved informed consent was obtained. FMRI data were acquired using multi-band EPI (MB-EPI) with low spatial resolution to maximize sensitivity (TR/TE:137/35ms, multiband acceleration: 8, no. slices: 16, voxel size: 6mm isotropic, scan time: 4:41min) and MB-EVI with 2 different spatial resolutions (TR/TE: 163/34ms, multiband acceleration: 3 or 2, no. slabs/slices: 6/43 or 4/29, voxel size: 3 or 6mm isotropic, scan time: 5:56min). Cerebral blood flow (CBF) was measured using multi-slice pseudo-continuous arterial spin labelling (pCASL)10 (TR/TE: 4040/13ms, voxel size: 2.5x2.5x2.5mm3, 20 slices with 20% gap, acquisition time: 1:24 minutes11). Resting-state connectivity analysis was performed using TurboFIRE12,13 and custom MATLAB software. Processing steps included rigid body motion correction, spatial normalization into MNI space, and spatial smoothing of 3x3x3mm3 voxel size data sets using an 6mm3 Gaussian filter. Single-band high-order (~200) FIR filtering using -60dB stop bands, a 0.1 Hz transition band, and passband ripple of 0.1dB was used to remove low frequency connectivity, respiratory and cardiac pulsatility and their 1st harmonics at the full width at 10% of peak maximum2. The increase in respiratory and cardiac frequency during hyperventilation was compensated by narrowing the passband to the overlap frequency range with normocapnic data (Figure 1). Manually selected unilateral seed regions in auditory (AUD), visual (VIS), and sensorimotor (SM) cortex, default mode network (DMN) and white matter (WM) were position away from tissue edges to minimize motion sensitivity. Sliding window (15s) correlation analysis was performed with running mean2. A spatially constrained cluster analysis identified the maximum and mean correlations within each of the seed regions.Results
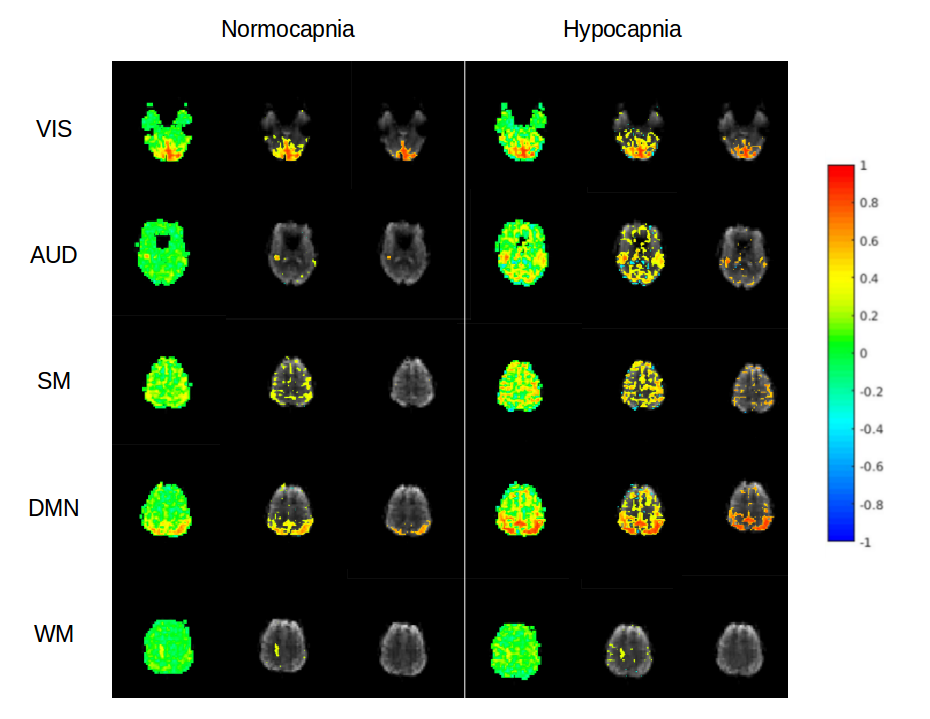
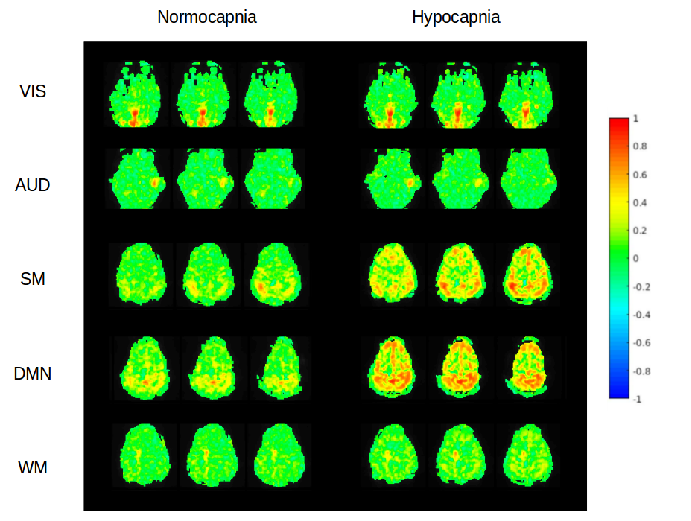
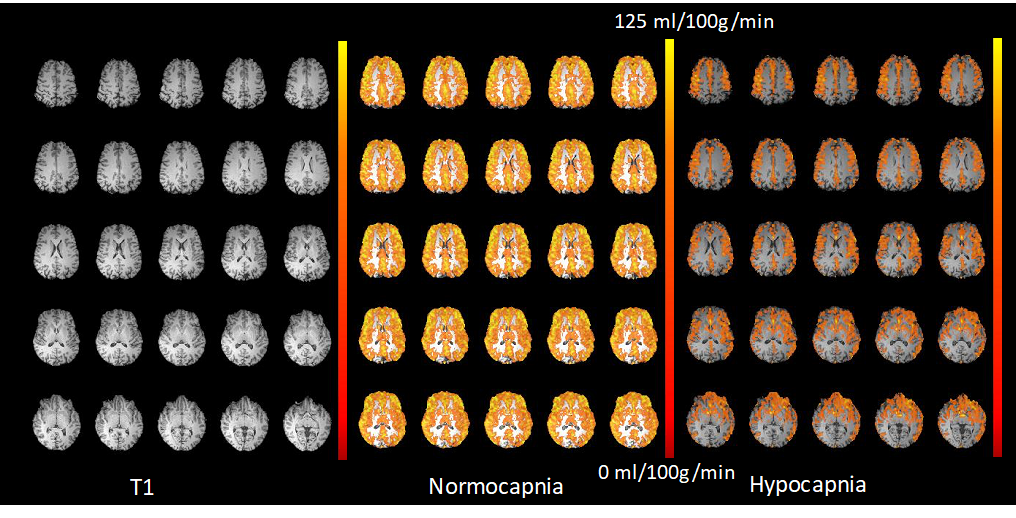
In the first subject, an increase in high frequency correlations in MB-EPI was detected during hypocapnia (Figure 2). These findings were replicated in the MB-EVI data with the exception of auditory cortex, which did not show an increase in high frequency correlations (Figure 3). The corresponding change in CBF was most pronounced in occipital and parietal cortex (Figure 4). In subjects 2 and 3, a higher flip angle (42o) was used for MB-EPI to assess possible in-flow effects. During normocapnia, high frequency correlations were weaker than in subject 1 (Figure 5a). During hypocapnia, the 1st harmonic of the respiratory frequency was detected in the movement spectrum and quasi-periodic side-band artifacts that were seen in the raw data spectra, which created strong artifactual correlations across multiple slices (Figure 5b). Analysis of MB-EVI data in these subjects is in progress.Discussion
Our previous observation of high frequency correlations in MEVI now extends to MB-EPI and to MB-EVI. The increase in high frequency correlations during hypocapnia has to be interpreted with caution. Movement related artifacts may have caused observed correlations, in particular during hypocapnia, as amplified in the high flip angle MB-EPI data, despite best efforts to minimize head movement. In contrast, highly localized auditory correlations emerged during hypocapnia that argue against movement artifacts. An alternative explanation is the narrowing of the FWHM of the HRF during hypocapnia, which we and others have documented in previous studies9,14, increases the high frequency response of the BOLD effect and high frequency correlations.Conclusions
These studies suggest that high frequency signal changes may be mediated by vascular physiology, but movement related artifacts cannot be excluded at this point.Acknowledgements
This research was supported by 1R21EB022803-01. We thank our collaborators Sudhir Ramanna, Steen Moeller and Essa Yacoub at CMRR for their support of MB-EVI development and raw data reconstruction. We gratefully acknowledge Catherine Smith and Diana South for their expert assistance with MR operations. We thank Alam Syed and Troy Hutchins for help with data acquisition and reconstruction. Special thanks to our research participants.References
[1] S. Posse, E. Ackley, R. Mutihac, J. Rick, M. Shane, C. Murray-Krezan, M. Zaitsev, and O. Speck, "Enhancement of temporal resolution and BOLD sensitivity in real-time fMRI using multi-slab echo-volumar imaging," Neuroimage, vol. 61, pp. 115-130, May 15 2012, 3342442.
[2] C. Trapp, K. Vakamudi, and P. S, "On the detection of high frequency correlations in resting state fMRI," NeuroImage, 2017.
[3] H. L. Lee, B. Zahneisen, T. Hugger, P. LeVan, and J. Hennig, "Tracking dynamic resting-state networks at higher frequencies using MR-encephalography," Neuroimage, vol. 65, pp. 216-222, Jan 15 2013.
[4] R. N. Boubela, K. Kalcher, W. Huf, C. Kronnerwetter, P. Filzmoser, and E. Moser, "Beyond Noise: Using Temporal ICA to Extract Meaningful Information from High-Frequency fMRI Signal Fluctuations during Rest," Front Hum Neurosci, vol. 7, p. 168, 2013, 3640215.
[5] Y.-H. A. Chu, Jyrki; Raij, Tommi; Kuo, Wen-Jui; Belliveau, John W.; Lin, Fa-Hsuan, "Resting-State fMRI at 4 Hz," in Annual Meeting of the ISMRM, Salt Lake City, 2013, p. 41.
[6] J. E. Chen and G. H. Glover, "BOLD fractional contribution to resting-state functional connectivity above 0.1 Hz," Neuroimage, vol. 107, pp. 207-218, Feb 15 2015, 4318656.
[7] P. K. Valur Olafsson, and Thomas Liu, "Multi-Echo Independent Component Analysis (ME-ICA) of High Frequency Resting-State fMRI Data," in Annual Meeting of the International Scoiety of Magnetic Resonance in Medicine, Toronto, 2015, p. 2053.
[8] S. Posse, L. J. Kemna, B. Elghahwagi, S. Wiese, and V. G. Kiselev, "Effect of graded hypo- and hypercapnia on fMRI contrast in visual cortex: Quantification of T-2* changes by multiecho EPI," Magnetic Resonance in Medicine, vol. 46, pp. 264-271, Aug 2001.
[9] L. J. Kemna and S. Posse, "Effect of respiratory CO(2) changes on the temporal dynamics of the hemodynamic response in functional MR imaging," Neuroimage, vol. 14, pp. 642-649, Sep 2001.
[10] W. C. Wu, M. Fernandez-Seara, J. A. Detre, F. W. Wehrli, and J. Wang, "A theoretical and experimental investigation of the tagging efficiency of pseudocontinuous arterial spin labeling," Magn Reson Med, vol. 58, pp. 1020-1027, Nov 2007.
[11] D. C. Alsop, J. A. Detre, X. Golay, M. Gunther, J. Hendrikse, L. Hernandez-Garcia, H. Lu, B. J. MacIntosh, L. M. Parkes, M. Smits, M. J. van Osch, D. J. Wang, E. C. Wong, and G. Zaharchuk, "Recommended implementation of arterial spin-labeled perfusion MRI for clinical applications: A consensus of the ISMRM perfusion study group and the European consortium for ASL in dementia," Magn Reson Med, vol. 73, pp. 102-116, Jan 2015, PMC4190138.
[12] S. Posse, F. Binkofski, F. Schneider, D. Gembris, W. Frings, U. Habel, J. B. Salloum, K. Mathiak, S. Wiese, V. Kiselev, T. Graf, B. Elghahwagi, M. L. Grosse-Ruyken, and T. Eickermann, "A new approach to measure single-event related brain activity using real-time fMRI: Feasibility of sensory, motor, and higher cognitive tasks," Human Brain Mapping, vol. 12, pp. 25-41, Jan 2001.
[13] S. Posse, E. Ackley, R. Mutihac, T. Zhang, R. Hummatov, M. Akhtari, M. Chohan, B. Fisch, and H. Yonas, "High-speed real-time resting-state FMRI using multi-slab echo-volumar imaging," Front Hum Neurosci, vol. 7, p. 479, 2013, 3752525.
[14] E. R. Cohen, E. Rostrup, K. Sidaros, T. E. Lund, O. B. Paulson, K. Ugurbil, and S. G. Kim, "Hypercapnic normalization of BOLD fMRI: comparison across field strengths and pulse sequences," Neuroimage, vol. 23, pp. 613-624, Oct 2004.
Figures