4642
Simultaneous acquisition of CBV, CBF and BOLD signals induced by visual stimulations of 1, 4 and 8 Hz under normoxia and hypoxia conditions1Center for MRI Research, Peking University, Beijing, China, 2Peking-Tsinghua Center for Life Sciences, Peking University, Beijing, China, 3Beijing City Key Lab for Medical Physics and Engineering, Peking University, Beijing, China, 4MR Research China, GE Healthcare, Beijing, China
Synopsis
A simultaneous acquisition of VASO, ASL and BOLD signals was employed to measure relative functional changes induced by a block-designed, black-and-white checkerboard visual task containing three stimulus frequencies and two oxygen-level conditions. We report that 1) δCBV, δCBF and δBOLD increase along with visual stimulus frequencies for both oxygen-level conditions; 2) δBOLD, but not δCBV or δCBF, acquired under hypoxia condition is significantly lower than that acquired under normoxia condition for all the three stimulus frequencies. According to Fick’s principle, our results predict increases of oxygen consumption rate among various stimulus frequencies during hypoxia.
Introduction
Hypoxic
hypoxia is commonly seen in elderly and in highland population. Effects of
hypoxia on oxygen metabolism of the brain have not been broadly studied. Cerebral
blood volume (CBV), cerebral blood flow (CBF) and blood-oxygen-level-dependent
(BOLD) are important parameters to characterize states of oxygen metabolism. Studies
have shown that, during a normoxia visual task, changes of functional signals increases
along with stimulus frequencies (1, 4, 8Hz) while changes of cerebral
metabolism rate of oxygen (δCMRO2) peaks at 4 Hz(1-3). In this work, a simultaneously acquisition of CBV,
CBF and BOLD signals was utilized to evaluate functional changes induced by a
visual task involving three stimulus frequencies under normoxia and hypoxia
conditions. Whether the brain utilizes a similar metabolic strategy during
hypoxia is discussed.Methods
24 subjects (20-30 years, 13 females) all underwent two runs of visual tasks. One task lasted for 432s, consisting of a 12s dummy period, followed by seven 60s sessions alternating between resting and visual activation. Subjects were presented with a white crosshair on a black background during the resting sessions and a black-white radial checkerboard pattern flickering at a randomized sequence of 1, 4 and 8Hz—one for each activation session. Subjects were instructed to keep their eyes open and gaze at the center of the screen during tasks.
Breathing gases were supplied at a constant flow rate of 15L/min via a laboratory-built gas supplying system. Medical air (21% oxygen, 79% nitrogen) was provided during the first run. Hypoxia gas mixture (12% oxygen, 88% nitrogen) was switched on upon completion of the first run and lasted till the end of the second run. A 5-to-7-minute halt was made after the switch, allowing blood-oxygen-saturation level to drop and stabilize.
A pulse sequence which simultaneously acquires VASO, ASL and BOLD signals(2) was implemented on a 3.0T MR750 system (GE Healthcare, USA). A single oblique axial slice passing through the anterior commissure and posterior commissure and extending to the primary visual cortex was imaged. Acquisition parameters were: FOV=260x260mm2, matrix size=64x64, slice thickness=6mm, TE=9.4/11.6/28.1ms for VASO/ASL/BOLD images, inversion slab=100mm, TI1 for VASO images were individually determined using an inversion recovery pulse sequence (~701.7ms), TI2=1200ms for ASL images and TR=2000ms.
Data collected during dummy period, as well as the first 8s of every resting/activation session, were discarded to account for the hemodynamic response effect. The rest data was smoothed. VASO data was obtained by adding the slab-selective and adjacent nonselective images acquired from the first echo of the pulse sequence. δCBV was calculated using the below equation:
$$δCBV=-(\frac{C_{par}}{C_{blood}\cdot{CBV_{rest}}}-1)\cdot{δVASO}$$
where Cpar=0.89 and Cblood=0.87ml water/ml substance represent water contents for parenchyma and blood, respectively, CBVrest=0.055ml blood/ml parenchyma(2). CBF/BOLD data were obtained by subtracting/adding the slab-selective and adjacent nonselective images acquired from the second/third echo of the pulse sequence.
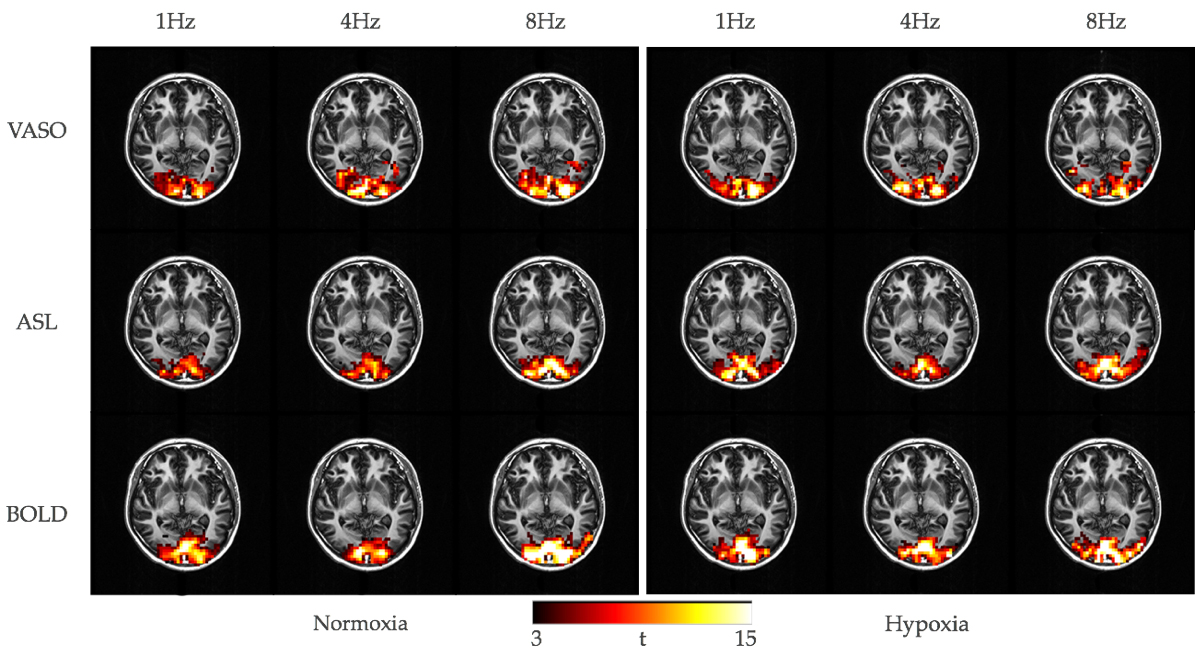
Student’s t-test was performed to compare resting and activation states and generate functional activation maps for all three stimulus frequencies under both oxygen-level conditions. Threshold was t>3 (P<0.005). Those voxels that were activated under all frequencies and both conditions were determined as region of interest, which was used to calculate δCBV, δCBF and δBOLD.
Results
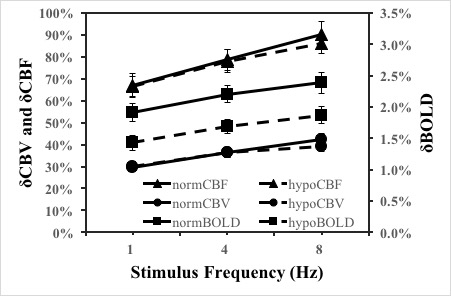
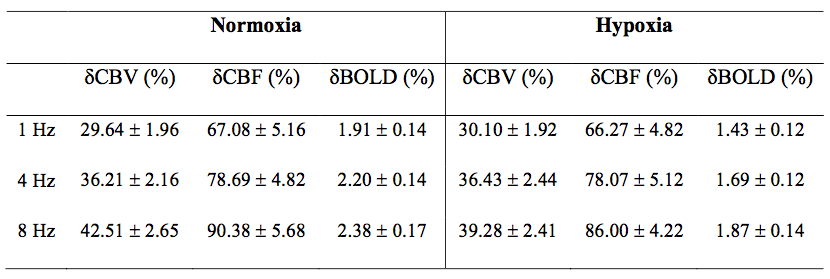
Figure 1 shows functional activation maps of a typical subject. The primary visual cortex was activated under every experimental condition as expected. Figure 2 indicates increasing trends of average δCBV, δCBF and δBOLD of all subjects along with stimulus frequencies for both oxygen-level environments. Moreover, δBOLD decreases significantly under the hypoxia condition for all frequencies. The similar decrease was not detected for δCBV or δCBF. Table 1 shows average values of δCBV, δCBF and δBOLD of all subjects for all frequencies and conditions.Discussion and conclusion
For the normoxia condition, our numeric findings of δCBV, δCBF and δBOLD agree with previous results(2), suggesting the applicability of using the simultaneous acquisition method for evaluating functional tasks in a time-efficient manner. For the hypoxia condition, a decrease in BOLD signal during 8Hz visual stimulation has been reported in previous studies(4,5). In addition to 8Hz, we report that BOLD signal during 1 and 4Hz visual stimulations exhibit similar declining trends, but CBV and CBF signals remain among various task and environmental conditions. An explanation is that the brain may utilize the same neurovascular coupling strategy among various stages of the same task, but different strategies when the environmental oxygen level is altered. According to the Fick’s principle(6), our results predict increases of oxygen consumption rate among various stimulus frequencies during hypoxia. A further step of measuring CMRO2 can be taken to verify if oxygen metabolism status changes with environmental oxygen levels.Acknowledgements
No acknowledgement found.References
1. Lin A-L, Fox PT, Hardies J, Duong TQ, Gao JH. Nonlinear coupling between cerebral blood flow, oxygen consumption, and ATP production in human visual cortex. Proceedings of the National Academy of Sciences 2010;107:8446–8451. doi: 10.1073/pnas.0909711107.
2. Lin A-L, Fox PT, Yang YEA, Lu H, Tan L-H, Gao J-H. Evaluation of MRI models in the measurement of CMRO 2and its relationship with CBF. Magn. Reson. Med. 2008;60:380–389. doi: 10.1002/mrm.21655.
3. Vafaee MS, Gjedde A. Model of Blood-Brain Transfer of Oxygen Explains Nonlinear Flow-Metabolism Coupling During Stimulation of Visual Cortex. J Cereb Blood Flow Metab 2000:747–754.
4. Rodrigues Barreto F, Mangia S, Garrido Salmon CE. Effects of reduced oxygen availability on the vascular response and oxygen consumption of the activated human visual cortex. J. Magn. Reson. Imaging 2016. doi: 10.1002/jmri.25537.
5. Ho Y-CL, Vidyasagar R, Shen Y, Balanos GM, Golay X, Kauppinen RA. The BOLD response and vascular reactivity during visual stimulation in the presence of hypoxic hypoxia. NeuroImage 2008;41:179–188. doi: 10.1016/j.neuroimage.2008.02.048.
6. Davis TL, Kwong KK, Weisskoff RM, Rosen BR. Calibrated functional MRI: Mapping the dynamics of oxidative metabolism. Proceedings of the National Academy of Sciences 1998;95:1834–1839. doi: 10.1073/pnas.95.4.1834.
Figures