4636
Hemodynamic modeling of laminar resolution fMRI1Maastricht University, Maastricht, Netherlands
Synopsis
Neuronal laminar information reflected in high-resolution fMRI is reduced due to ascending veins, carrying hemodynamic changes from various cortical depths to surface draining veins. Here, we propose an invertible generative hemodynamic model, which takes the effect of ascending veins to the laminar-specific fMRI signal explicitly into account. We illustrate the versatility of this novel model to characterize common experimental observations in laminar fMRI: we show that the spatial increase of laminar fMRI towards CSF is due to baseline blood volume. In contrast, a peak in the middle layer is due to higher neuronal activity rather than higher baseline blood volume.
Introduction
The BOLD signal is an indirect, vascular reflection of neuronal activity and, thus, comprises both neuronal and vascular sources of variability1. In particular, in laminar-resolved fMRI, altered vascular changes in lower layers affect blood oxygenation and volume in the upper layers via intra-cortical ascending veins, making it difficult to directly infer neuronal laminar profiles from measured fMRI data both for gradient- and spin-echo sequences. Hence, modeling blood flow, volume, and oxygenation in the cortical vasculature is imperative in order to account for vascular biases in the laminar fMRI signal. Published attempts considering the coupling of vascular changes across layers were limited because they either only considered two (instead of six or more) cortical layers, introduced ad hoc vascular-physiological variables not derived from mass balance principles, and/or exclusively accounted for steady-state responses2,3. Here, we propose a novel, invertible dynamic model based on mass balance principles that reliably discriminates neuronal and vascular effects at this spatial scale.Methods
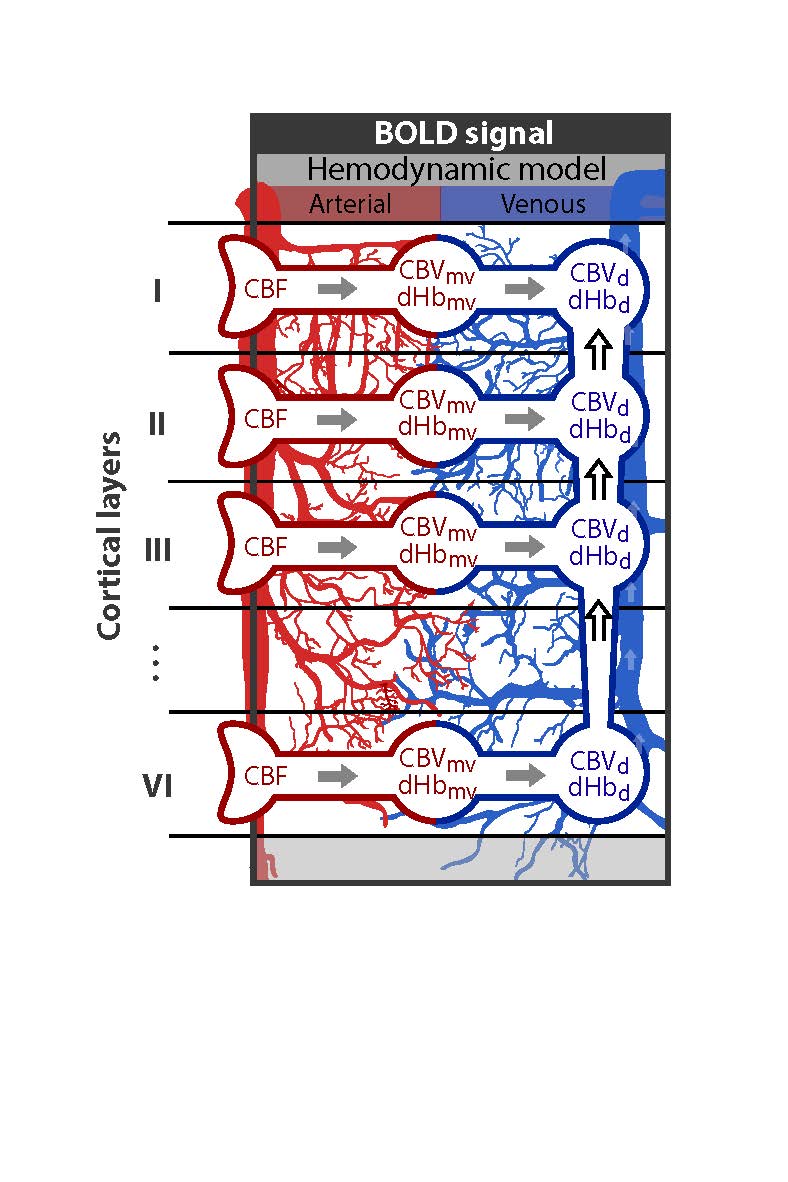
We expanded a single vascular compartment model (i.e. the balloon model4), such that the total venous signal of each layer is described by a local (venous signal of the local microvasculature) and non-local component (ascending vein carrying deoxyhemoglobin (dHb) changes from the lower layers) (illustrated in Fig. 1). The changes in deoxygenated hemoglobin and volume of the local microvasculature follow the same equations as in the balloon model and are not repeated here. According to mass balance principles, the absolute changes in blood volume V and deoxygenated hemoglobin Q of the ascending vein (labeled with d) in layer k are:
$$ dVd,k(t)/dt=Fmv,k(t)+Fd,k+1(t)-Fd,k(t) $$
$$ dQd,k(t)/dt=Fmv,k(t)Cmv,k(t)+Fd,k+1(t)Cd,k+1(t)-Fd,k(t)Cd,k(t) $$
Here, the variable F and C denote the absolute changes in blood flow and in concentration of deoxygenated hemoglobin, respectively. In short, the changes in blood volume of the ascending vein (eq. (1)) is determined by the inflow of blood from the microvasculature (mv) of that layer k, the inflow from the ascending vein from the lower layer (i.e. k+1) and the outflow to the upper layer. Equation (2) describes the changes of deoxygenated hemoglobin in the ascending vein and is described by the balance of amount of deoxygenated hemoglobin brought into and washed out (i.e. amount of deoxygenated hemoglobin is the product of flow and concentration, and compartments are denoted as in eq. (1)). By normalizing these equations to baseline values and together with the balloon model equation for the microvasculature5, dynamic relative fMRI signal for each layer can be calculated for given neuronal layer-specific activation profile.
Results
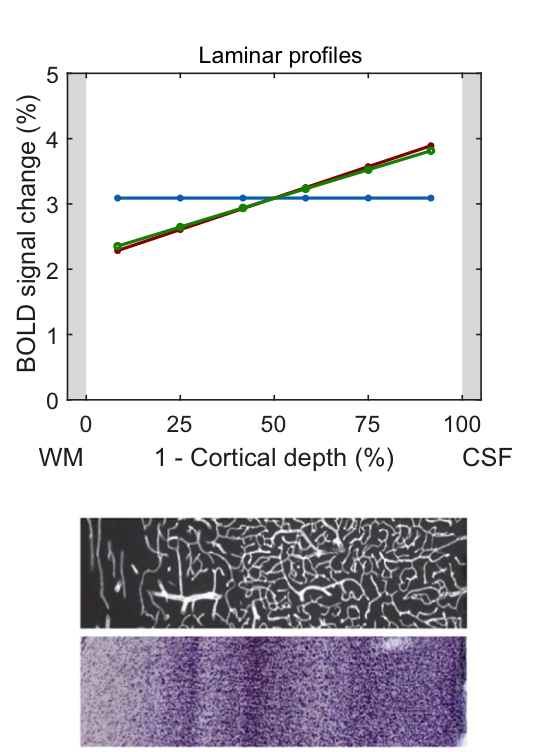
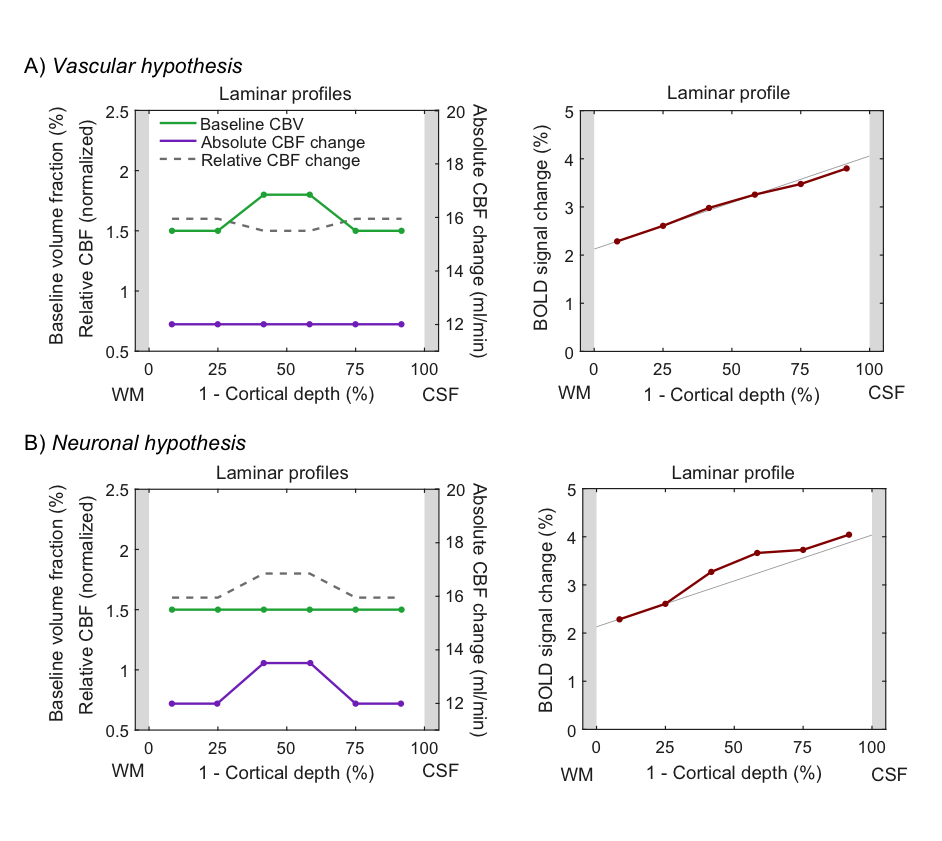
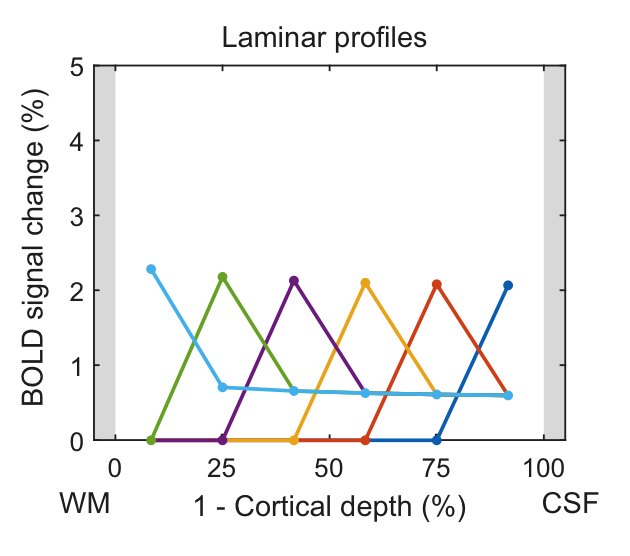
In the following, we demonstrate possible sources of common experimental fMRI observations using this model by assuming typical physiological values for baseline blood flow, transit time etc. Fig. 2 demonstrates that the commonly-observed spatial increase of the fMRI signal towards the CSF is not present for constant baseline CBV but is due to spatially increasing CBV (either of the microvasculature or of the ascending veins). Occasionally, a “bump” in the fMRI profile is observed. For typical physiological amplitudes, a local maximum of baseline CBV does only create a small bump (Fig. 3A, i.e. vascular hypothesis), whereas a higher neuronal activity in the middle layers evokes a clear bump (Fig. 3B, i.e. neuronal hypothesis). In Fig. 4, simulations were performed by assuming neuronal activity in only one layer. It can be observed, as expected, that the upper layers also show fMRI signal changes, which slowly drop off with distance from the activation layer (i.e. “leakage”), similar as in3. The leakage amounts to ~20-30% of the original signal amplitude.Discussion
The proposed generative hemodynamic model for laminar fMRI (extendable to any number of cortical layers) explicitly takes the drainage of deoxygenated hemoglobin and blood volume changes into account, which experimentally reduces laminar neuronal information. We illustrated the model on some typical experimental observations. The results indicate that the spatial increase of fMRI signal is due to increase in baseline CBV and is not just an effect of drainage of deoxygenated haemoglobin, as is commonly assumed. In the second example, we demonstrated that the “bump” in the middle layers cannot be explained by the popular vascular but only by the neuronal hypothesis. That is, the bump, if present, is most likely due to higher neuronal activity and not a consequence of higher baseline CBV. The model can potentially also be used for forward simulations of laminar hemodynamics (e.g. dip, time-to-peak, post-stimulus undershoot). Importantly, the model is invertible and identifiable using Bayesian inversion5 that derives spatial distributions of neuronal activity across cortical depths from experimental laminar fMRI.Acknowledgements
The research was supported by the Netherlands Organization for Scientific Research (NWO) VIDI grants 452-11-002 (KU).References
1. Uludag, K., Blinder, P. Linking vascular physiology to hemodynamic response in ultra-high field MRI. NeuroImage (2017, in press).
2. Heinzle, J., Koopmans, P.J., den Ouden, H.E., Raman, S., Stephan, K.E., 2016. A hemodynamic model for layered BOLD signals. Neuroimage 125, 556-570.
3. Markuerkiaga, I., Barth, M., Norris, D.G., 2016. A cortical vascular model for examining the specificity of the laminar BOLD signal. Neuroimage 132, 491-498.
4. Buxton, R.B., Uludag, K., Dubowitz, D.J., Liu, T.T., 2004. Modeling the hemodynamic response to brain activation. Neuroimage 23 Suppl 1, S220-233.
5. Havlicek, M., Roebroeck, A., Friston, K., Gardumi, A., Ivanov, D., Uludag, K., 2015. Physiologically informed dynamic causal modeling of fMRI data. Neuroimage 122, 355-372.
Figures