4634
Brain or cardiovascular oscillation: ultra-slow oscillations under 0.01 Hz detected by resting-state fMRI1Max Planck Institute for Biological Cybernetics, Tübingen, Germany, 2Graduate Training Centre of Neuroscience, Tübingen, Germany, 3Massachusetts General Hospital, Boston, MA, United States
Synopsis
A high amplitude slow wave component of frequency 0.005 to 0.012 Hz was observed in multiple resting state fMRI scans of the rat brain under different anesthetics. These ultra-slow waves were localized predominantly in the hypothalamus. We hypothesize that these ultra-slow oscillations might have a neurological origin and may contribute to the analysis of resting state connectivity, which is currently limited to frequencies above 0.01 Hz . Future studies should investigate the origin of these oscillations with an independent measure (e.g. calcium imaging) and the implications of their incorporation into the analysis of rs-fMRI.
Introduction
Spectral analysis in resting-state fMRI (rs-fMRI) studies has mainly focused on the 0.01 to 0.1 Hz frequency range1-6. Frequencies under 0.01 Hz are typically regarded as artifacts from scanner instabilities or physiological noise7, and are routinely excluded from the rs-fMRI analysis. Here, we show robust ultra-slow rs-fMRI signal fluctuation of high regularity in the brain of rats receiving anesthesia. The frequency range of this ultra-slow oscillation (USO) is one order of magnitude lower than that of the motion artifacts caused by respiration-induced B0 fluctuation8 or the cardiovascular oscillations9,10. The predominance of USO in the hypothalamus indicates a potential relevance of these waves to the homeostatic regulation through the hypothalamic-pituitary-adrenal axis to control the autonomic nervous system11. The significance of this work is to show the dominating USO effect on the rs-fMRI, possibly indicating a peculiar brain state in animals with different anesthetics.Methods
12 to 15 minutes of rs-fMRI data were acquired from anesthetized rats (under isoflurane, a-chloralose, medetomidine or urethane) using a 3D-EPI sequence with the following parameters: TE, 12.5 ms; TR, 31.25 ms (total TR, 1s); matrix size, 48x48x32; resolution, 400x400x600 µm (600 µm slice thickness). All images were acquired with a 12 cm diameter 14.1 T/26 cm magnet (Magnex, Oxford) interfaced to an Avance III console (Bruker, Ettlingen), capable of providing 100 G/cm with a rise time of 150 µs (Resonance Research). Trans-receiver surface coils with elliptical shape of ~ 2 x 3 cm minor and major axis, respectively, were used to acquire the whole brain fMRI. Animals were mechanically ventilated, and a low dose of the paralytic agent pancuronium was used to prevent motion artifacts. Frequency decomposition analysis and power estimation of the 0.005-0.012 Hz frequency band were performed to map the USO in the rat brain.Results
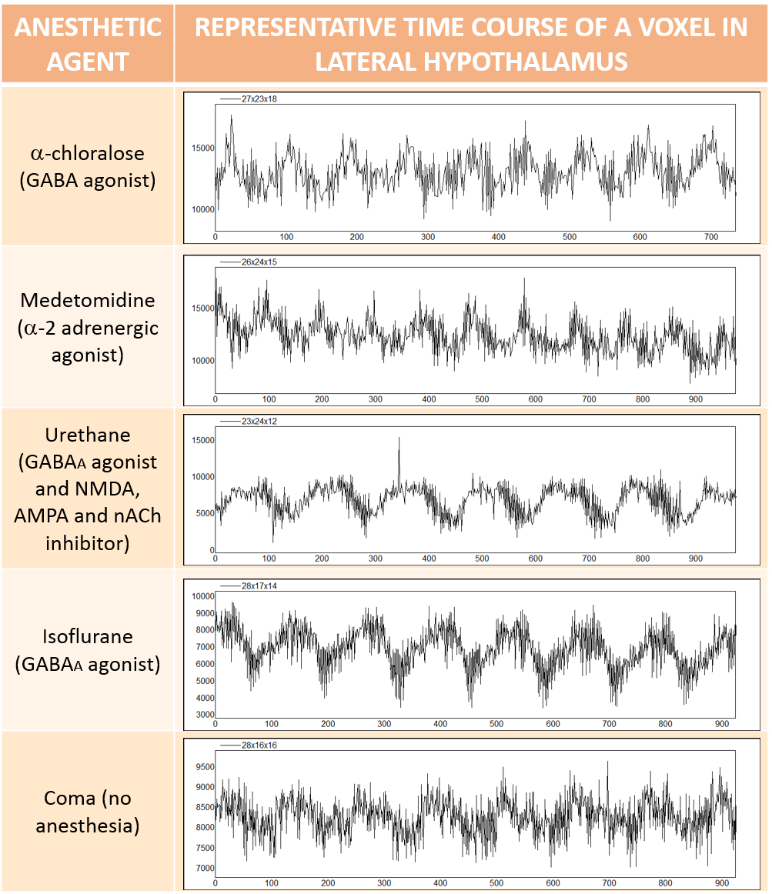
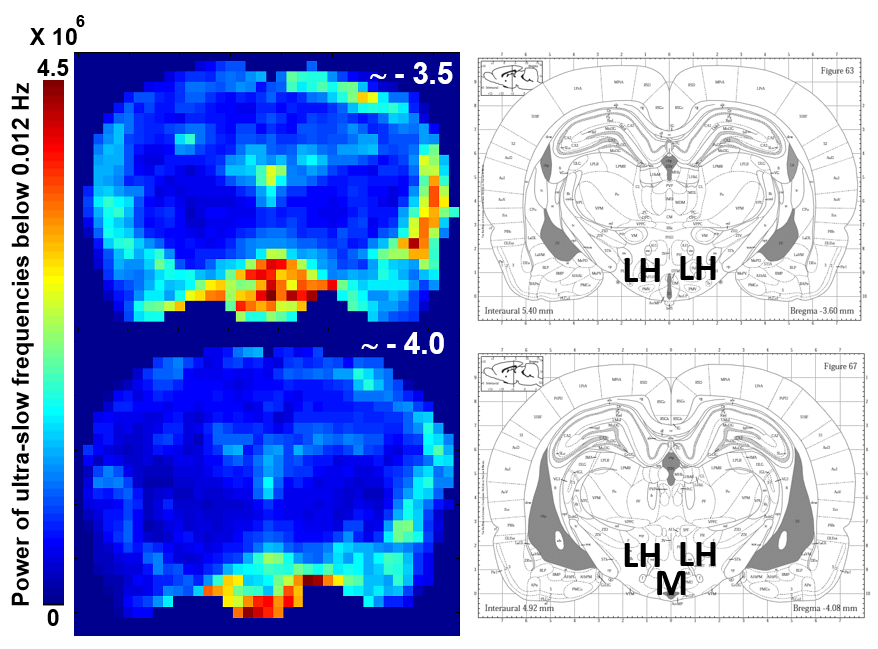
We show that frequencies below the classical 0.01 Hz limit can be observed as high amplitude waves of rhythmic pattern in animals receiving anesthesia (Fig.1). The frequency of the high amplitude oscillations belonged to a range between 0.005 and 0.012 Hz. These USO occurred predominantly within the hypothalamus, as confirmed with bandpass power analysis (Fig.2).Discussion
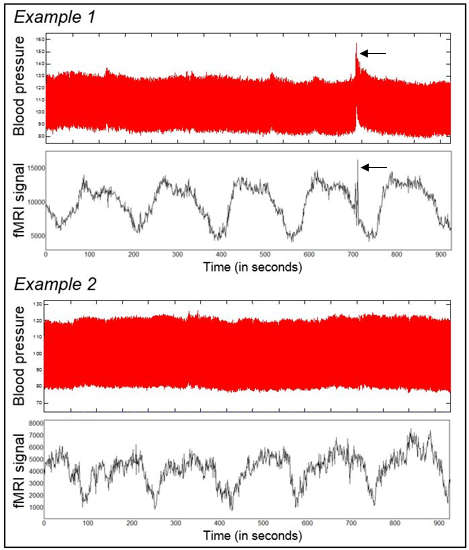
The features of the reported USO (brain region predominance, and especially, apparent absence of correlation with motion or physiological artifacts), may indicate that these oscillations have a neural origin instead of being derived from MR hardware noise. Furthermore, in contrast to the motion artifacts that are reliably detected from both blood pressure and fMRI time courses (Fig.3, arrows), a slow oscillation component as shown in the fMRI time course was not observed in the blood pressure records (Fig.3). Thus, the source of USO may not be directly contributed by cardiovascular fluctuations12, at least not due to blood pressure changes (Fig.3). Importantly, infraslow oscillations in a similar range were detected by EEG in brain-injured patients, which appeared related to modulations in the cortical excitability and have been hypothesized to emerge from a deep brain source13.Conclusion
We detected an ultra-slow resting-state fMRI signal fluctuation in rats under different anesthetics, which was highlighted in the hypothalamic regions. Future work will aim to clarify the source of these oscillations with concurrent fMRI and calcium recordings in the hypothalamus in rats. In addition, different drugs to modulate the autonomous nervous system will be applied to specify the potential relevance to the cardiovascular function.Acknowledgements
This work was supported by the Max-Planck-Society and the Graduate Training Centre of Neuroscience of Tübingen.References
1. Obrig, H. et al. Spontaneous low frequency oscillations of cerebral hemodynamics and metabolism in human adults. NeuroImage 12, 623-639 (2000).
2. Mitra, P. P., Ogawa, S., Hu, X. & Ugurbil, K. The nature of spatiotemporal changes in cerebral hemodynamics as manifested in functional magnetic resonance imaging. Magnetic resonance in medicine: official journal of the Society of Magnetic Resonance in Medicine / Society of Magnetic Resonance in Medicine 37, 511-518 (1997).
3. Biswal, B., Yetkin, F. Z., Haughton, V. M. & Hyde, J. S. Functional connectivity in the motor cortex of resting human brain using echo-planar MRI. Magn Reson Med 34, 537-541 (1995).
4. Golestani, A. M., Kwinta, J. B., Khatamian, Y. B. & Chen, J. J. The Effect of Low-Frequency Physiological Correction on the Reproducibility and Specificity of Resting-State fMRI Metrics: Functional Connectivity, ALFF, and ReHo. Front Neurosci 11, 546 (2017).
5. Raichle, M. E. et al. A default mode of brain function. Proc Natl Acad Sci U S A 98, 676-682 (2001).
6. Gohel, S. R. & Biswal, B. B. Functional integration between brain regions at rest occurs in multiple-frequency bands. Brain Connect 5, 23-34 (2015).
7. Smith, A. M. et al. Investigation of low frequency drift in fMRI signal. Neuroimage 9, 526-533 (1999).
8. Van de Moortele, P. F., Pfeuffer, J., Glover, G. H., Ugurbil, K. & Hu, X. Respiration-induced B0 fluctuations and their spatial distribution in the human brain at 7 Tesla. Magnetic resonance in medicine: official journal of the Society of Magnetic Resonance in Medicine / Society of Magnetic Resonance in Medicine 47, 888-895 (2002).
9. Cohen, M. A. & Taylor, J. A. Short-term cardiovascular oscillations in man: measuring and modelling the physiologies. The Journal of physiology 542, 669-683 (2002).
10. Kato, M. et al. Spectral analysis of heart rate variability during isoflurane anesthesia. Anesthesiology 77, 669-674 (1992).
11. Tsigos, C. & Chrousos, G. P. Hypothalamic-pituitary-adrenal axis, neuroendocrine factors and stress. J Psychosom Res 53, 865-871 (2002).
12. Preiss, G. & Polosa, C. Patterns of Sympathetic Neuron Activity Associated with Mayer Waves. American Journal of Physiology 226, 724-730 (1974).
13. van Putten, M. J. A. M., Tjepkema-Cloostermans, M. C. & Hofmeijer, J. Infraslow EEG activity modulates cortical excitability in postanoxic encephalopathy. Journal of Neurophysiology 113, 3256-3267 (2015).
Figures