4633
Differences in BOLD temporal behavior in the cortical and subcortical structures of the visual and somatosensory systems1NorthShore University HealthSystem, Evanston, IL, United States
Synopsis
The temporal behavior of the BOLD response can vary considerably between nodes within sensory circuits as well as across different modalities. Understanding the nature of these variations could provide more information about the factors that shape the hemodynamic response. In this work fMRI data were acquired from both thalamic and cortical regions of the visual and somatosensory systems during prolonged sensory stimulation. Our findings show that while the thalamic BOLD responses for both circuits were quite similar, the cortical responses showed different adaptive behavior, which may reflect underlying regional differences in the contributions of local excitatory/inhibitory processes.
Introduction
Functional magnetic resonance imaging (fMRI) relies upon blood oxygenation level dependent (BOLD) signal changes for mapping brain activation in humans and animals. It has been reported that the shape of the BOLD signal can vary considerably across nodes within sensory pathways, such as the visual, somatosensory and auditory systems, as well as between sensory modalities. Comparing these differences in BOLD time course can provide information about the functional relationship between these nodes and the factors that shape the hemodynamic response. In order to characterize the variation in BOLD response across different sensory structures, fMRI data were acquired from both thalamic and cortical regions of the visual and somatosensory systems. These regions included the primary visual cortex (V1) and lateral geniculate nucleus (LGN), as well as the whisker barrel cortex (WBC) and ventral posteromedial nucleus (VPM). A long-duration sensory stimulus for each modality in order to capture both the initial and the sustained phases of the BOLD response. We hypothesized that neurophysiological variation across the thalamocortical structures of these two sensory systems would lead to region-specific changes in BOLD response.Methods
Dutch-Belted rabbits were chronically implanted with a restraining headbolt. MR imaging experiments were performed on a 9.4T Bruker BioSpec imaging spectrometer using awake animals. fMRI data were acquired in each region (i.e., visual or somatosensory) from eight consecutive 1mm-thick slices in the coronal plane using a single-shot, gradient-echo multi-slice EPI sequence with a repetition time (TR) of 2 s, an echo time (TE) of 11 ms, a 30mm×30mm field of view (FOV), and a matrix size of 80×80, corresponding to an in-plane resolution of 375 μm x 375 μm. The slices included either the WBC and VPM or V1 and LGN. The whisker and visual stimulation paradigms consisted of a non-stimulus baseline period (15 images), a stimulation period (10 images) and a post-stimulus period to allow recovery of the BOLD signal (20 images). For whisker stimulation, B1, B2, and C1 whiskers on the left side were stimulated in each experiment (50 Hz; +/- 0.3mm deflection). The visual stimulation consisted of four green LEDs flashing at 8 Hz delivered to the left eye.Results
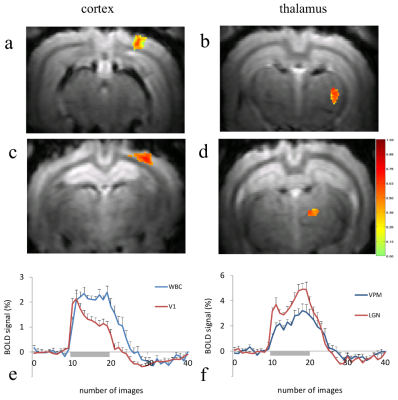
Examples of BOLD activation from single subjects during visual and whisker stimulation are shown in Figure 1. As expected due to the crossing of the visual and somatosensory systems in the rabbit, all subjects showed a robust BOLD response contralateral to the stimulus presentation in the cortex as well as the thalamic nuclei. During visual stimulation (Fig. 1a,b), activation was found in V1 and LGN. Activation was also observed in the superior colliculi (SC) in an adjacent slice (not shown). During whisker stimulation, activation was detected in the WBC and VPM (Fig. 1c,d). In both the LGN and VPM (Fig. 1f) the mean BOLD time courses averaged across subjects were quite similar in shape, which was characterized by an initial peak followed by a larger second peak near the end of the stimulus presentation. In the cortex (Fig. 1e), visual and somatosensory stimulation produced strikingly different BOLD responses. In V1 the BOLD response showed distinct transient and sustained components: an initial peak followed by adaptation. In contrast, the BOLD time course in the whisker barrel cortex was essentially flat during stimulation, without distinct peak and plateau features.Discussion
The variation in the temporal behavior of the BOLD responses within and across the visual and somatosensory thalamocortical circuitry highlights the importance of understanding the factors that determine how each brain region shapes the BOLD signal. The high degree of similarity in the thalamic responses was not surprising, given the comparable structural organization of the LGN and VPM. The output from these regions forms the primary excitatory input to the cortex. Despite the equivalence in the cortical inputs, however, the BOLD temporal behavior showed considerably more adaptation in V1 vs. WBC. Cortical BOLD is believed to reflect primarily postsynaptic potentials originating from thalamocortical inputs as well as intracortical processing, which further spreads and modifies the input across layers and between columns. Thus, the differences between V1 and WBC in this case likely reflect the region-dependent excitatory and inhibitory components that underlie the processing of information within each structure. Previous reports 1-4 point to the important role of local inhibition in shaping neuronal and hemodynamic responses, which may play a key role in determining cortical adaptation of the BOLD response in each region.Acknowledgements
Supported by: R01GM112715.References
1. Aksenov DP, Li L, Miller MJ, Wyrwicz AM. Blood oxygenation level dependent signal and neuronal adaptation to optogenetic and sensory stimulation in somatosensory cortex in awake animals. Eur J Neurosci 2016; 44(9): 2722-2729.
2. Aksenov DP, Li L, Miller MJ, Iordanescu G, Wyrwicz AM. Effects of anesthesia on BOLD signal and neuronal activity in the somatosensory cortex. J Cereb Blood Flow Metab 2015; 35(11): 1819-26.
3. Angenstein F. The actual intrinsic excitability of granular cells determines the ruling neurovascular coupling mechanism in the rat dentate gyrus. The Journal of neuroscience : the official journal of the Society for Neuroscience 2014; 34(25): 8529-8545.
4. Vazquez-Garcia M, Wallman MJ, Timofeev I. Somatotopic organization of ferret thalamus. Frontiers in integrative neuroscience 2014; 8: 90.
Figures
