4632
Spin Echo measurement of oxygen BOLD reactivity - A simple method for mapping functional capillary blood volume?1Cardiff University Brain Research Imaging Centre, Cardiff University, Cardiff, United Kingdom
Synopsis
A simple non-invasive method is presented for the mapping of functional cerebral capillary blood volume. Functional capillary blood volume is a potentially powerful biomarker that is highly correlated with the average rate of glucose metabolism in the tissue. In-vivo maps of capillary blood volume are shown to be highly correlated with resting CBF in healthy volunteers and can be easily acquired within a few minutes with standard MR imaging sequences.
Introduction
The density of functional capillaries in the brain has been found to vary with average energy requirements of the tissue, and shows a strong correlation with the rate of glucose metabolism in health and disease in the human brain 1. Therefore measurement of the functional capillary volume may provide an informative metric for assessing the average metabolic requirements of the brain tissue. Here we present a straightforward non-invasive method for mapping the functional capillary volume in the human brain. The method is based on the spin-echo acquisition of an EPI time series during modulation of inspired oxygen levels.Methods
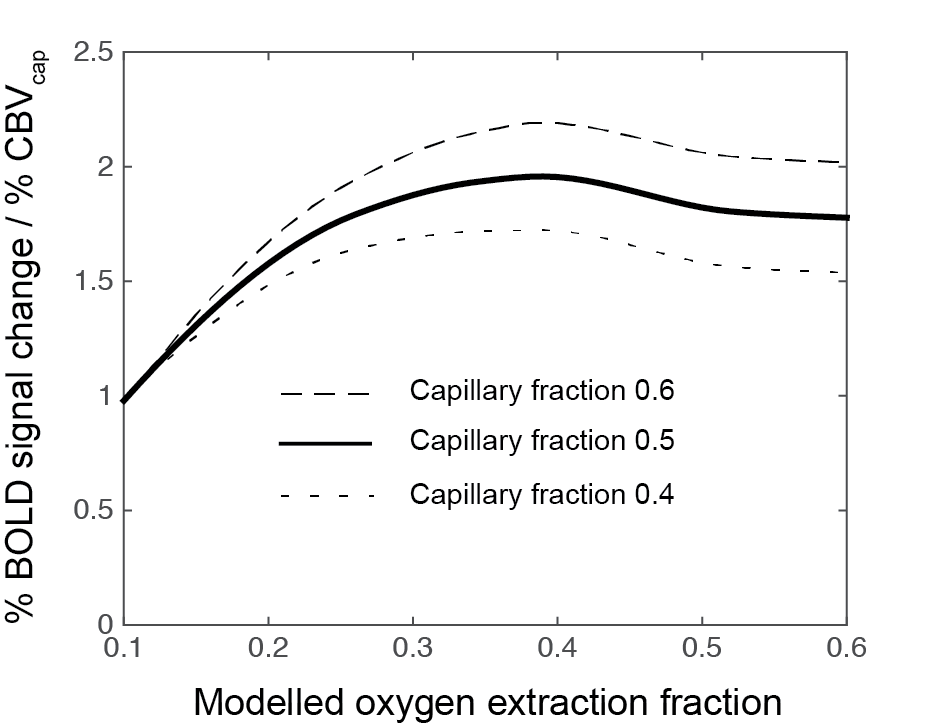
Spin echo signals were calculated at 3T for capillaries (4μm radius) and venules (25μm radius) using a Monte–Carlo simulation of water in a vascular network 2. Briefly, The ODIN framework 3 was used to produce numerical integrations of the Bloch equations along a large number of random walk paths to model extravascular signal. Intravascular signal was included by considering the field distribution inside a vessel, calculated according to Bandettini and Wong 4. Modelling was undertaken for intravascular susceptibility changes, Δχ, ranging from −0.05 to −0.3 p.p.m (SI units) to capture the full range of potential respiratory challenges. The relationship between Δχ and the percentage BOLD signal (per percentage cerebral capillary blood volume (CBVcap)) was calculated for a range of baseline physiology (capillary fraction (CF), the volume fraction of the post-arteriole vasculature that is capillaries, and resting oxygen extraction (OEF)).
Experimental data was acquired from 5 volunteers (4 male, 33.2 ± 7.7 years). Acquisition: 3T Prisma scanner (Siemens, Erlangen). 7 minutes SE data (180 volumes), 64x64 matrix, 220mm FOV, 21 slices, 5mm slice thickness, 25% slice gap, GRAPPA factor 3, TE 90ms. The gas paradigm consisted of two 2-minute blocks of 100% O2 interleaved with normoxia. A hypoxic mix (12% O2) was used to reduce the time taken for the arterial saturation to return to baseline between periods of hyperoxia. In the same scanning session dual-excitation pCASL data were acquired with CO2 and O2 modulation of respiratory gases for the quantification of resting CMRO2 5. During all scanning sessions end-tidal CO2 and O2 were monitored. Data were motion corrected, high-pass filtered, spatially smoothed (Gaussian FWHM=5mm), and fit with a GLM to determine the percentage BOLD signal change, which was then converted to CBVcap using the measured change in end-tidal oxygen content and the modelled BOLD response for an assumed CF of 0.5 and OEF of 0.35. Data from the within session CMRO2 scan were also analysed to obtain resting cerebral blood flow (CBF) and venous CBV 6.
Results and Discussion
The Monte–Carlo simulation demonstrated a near linear relationship between the intravascular susceptibility change and percentage BOLD signal (per percentage CBVcap) for any given baseline oxygenation and capillary volume fraction combination. (This linearity does not hold for large susceptibility changes, e.g. with a standard dose Gd injection). We observed an expected dependence of the SE signal on OEF and capillary volume fraction. However, as shown in figure 1, this variation only causes a moderate modulation of the SE signal over a wide range of physiology, with the deviation in signal magnitude less than ± 11% for OEF 0.2 to 0.55 and CF 0.4 to 0.6.
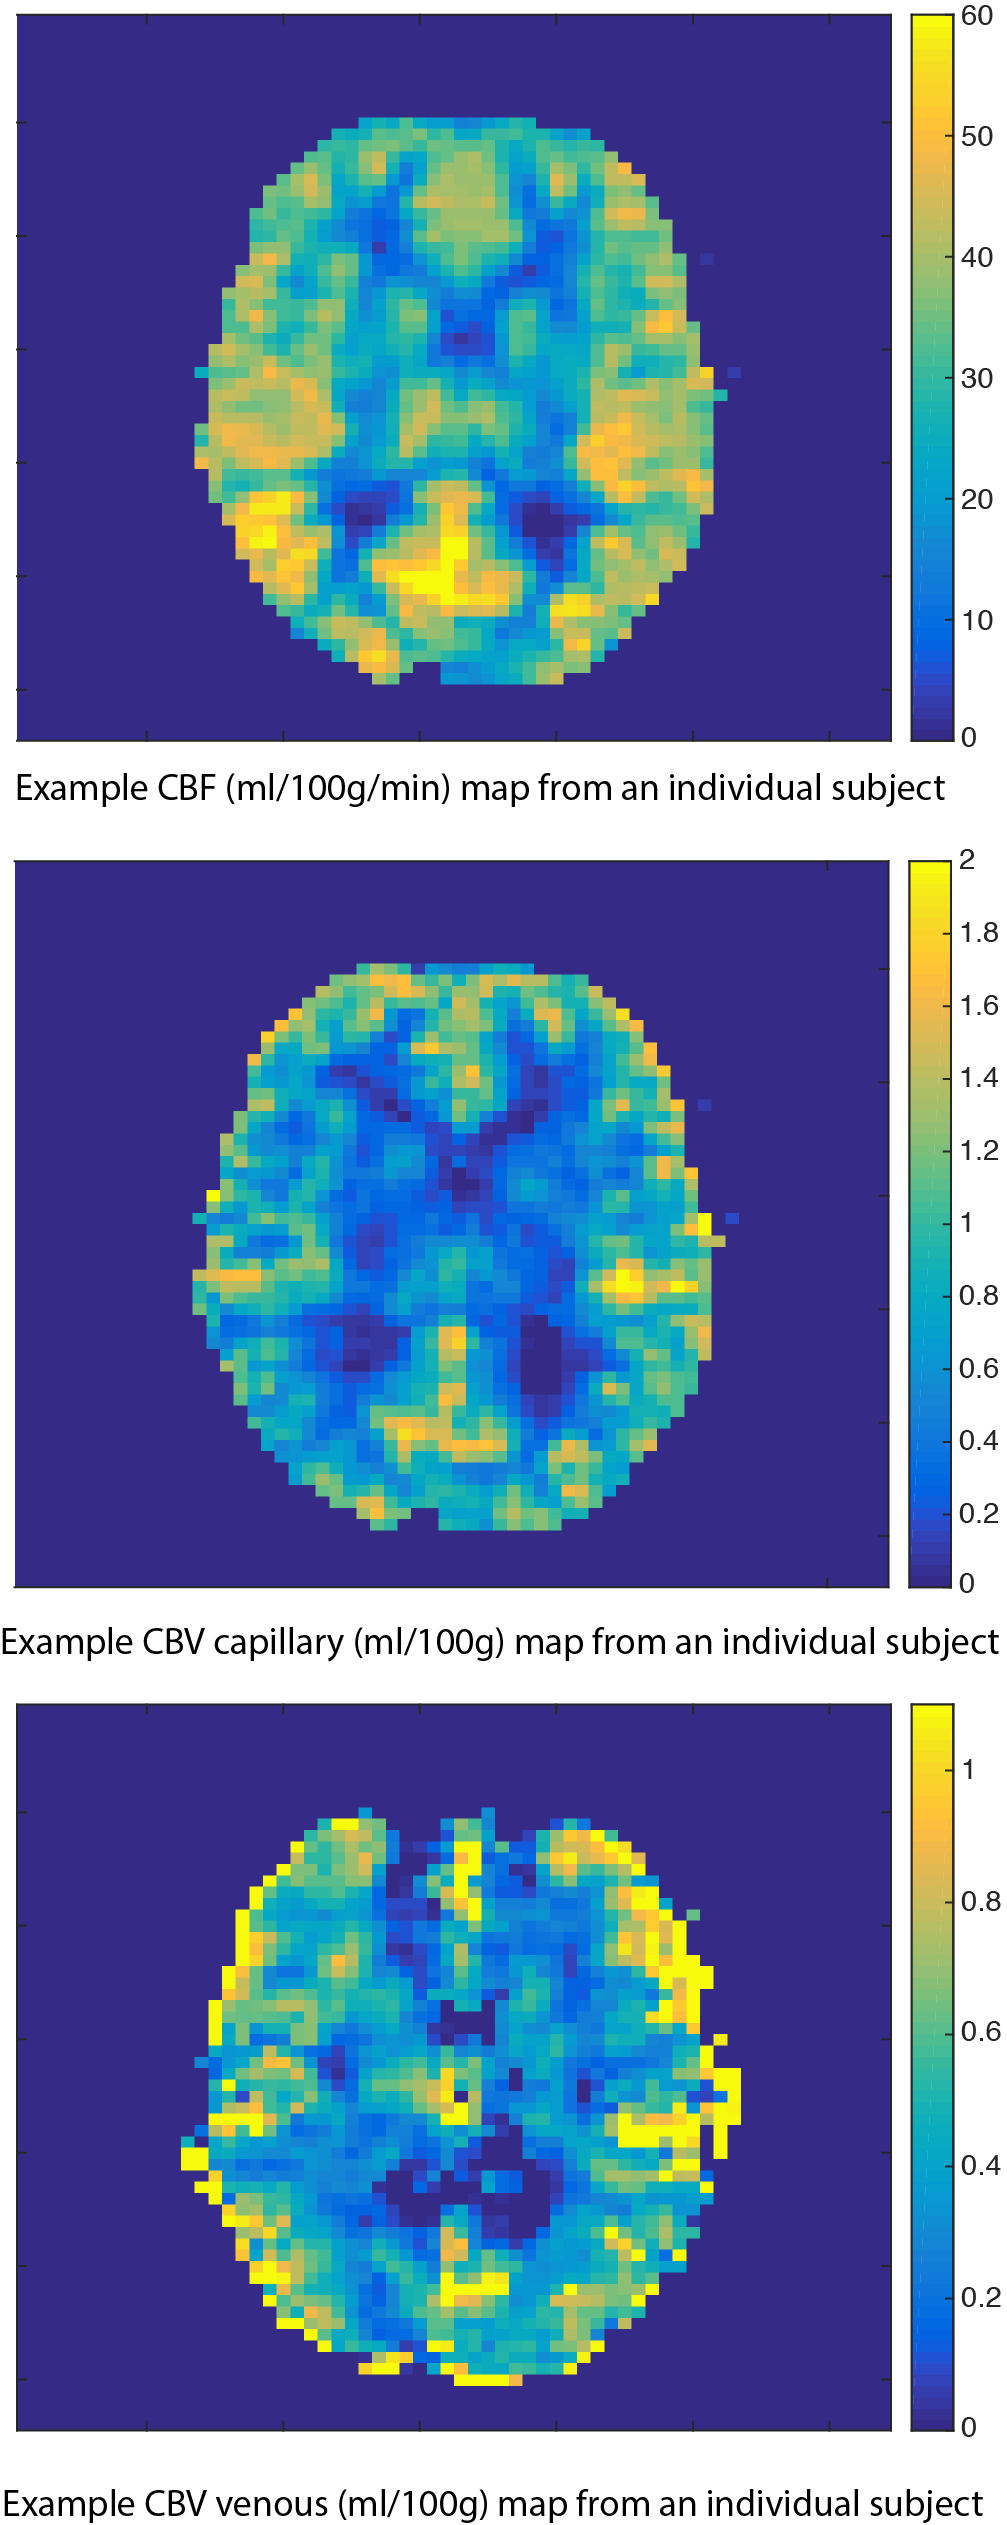
Voxel-wise estimates of CBVcap were highly correlated with baseline CBF, group R2 = 0.63 ± 0.06, p<0.0001. However, there was only moderate agreement between GE-CBV (CBV venous) and CBF, R2 = 0.34 ± 0.13, p<0.0001. Group mean gray matter estimates were 1.13 ± 0.22 ml/100g, 1.05 ± 0.46 ml/100g for CBVcap and CBV venous respectively, and 55.8 ± 6.7 ml/100g/min for CBF. Figure 2 shows example parameter maps for CBVcap, CBV venous and CBF. There are clear similarities between each of the maps. However, gradient echo susceptibility artefacts and large vessel contamination significantly affect the CBV venous map.
Conclusion
The proposed method for measurement of CBVcap is simple to perform, non-invasive and correlates well with baseline CBF in healthy volunteers. The success of the method is aided by minimal variation in capillary fraction across the brain 2 and its relative insensitivity to OEF above approximately 0.2. The BOLD signal will be significantly reduced as the OEF drops below 0.2 and the capillary starts to become non-functional for O2 transport, i.e. does not significantly contribute to the transport of oxygen to the tissue. For this reason the approach is sensitive to the functional capillary volume rather than the absolute volume, and as such should correlate well with the average rate of glucose metabolism in the brain tissue.Acknowledgements
We would like to thank Fabrizio Fasano (Siemens Healthineers) for assistance with pulse sequence programming of the pCASL sequence and the Wellcome Trust for supporting this work: Wellcome Trust Strategic Award, ‘Multi-scale and multi-modal assessment of coupling in the healthy and diseased brain’, grant reference 104943/Z/14/Z.References
1. Gjedde A, Kuwabara H, Hakim A. Reduction of Functional Capillary Density in Human Brain After Stroke. Journal of Cerebral Blood Flow and Metabolism. 1990;10:317-326.
2. Germuska M, Meakin J, Bulte D. The influence of noise on BOLD-mediated vessel size imaging analysis methods. J Cereb. Blood Flow Metab. 2013;33(12): 1857–1863.
3. Jochimsen TH, von Mengershausen M. ODIN-object-oriented development interface for NMR. J Magn Reson. 2004;170(1):67-78.
4. Bandettini PA, Wong EC. Effects of biophysical and physiologic parameters on brain activation-induced R2 * and R2 changes: simulations using a deterministic diffusion model. Int. J. Imag. Syst. Technol. 1995;6:133–152
5. Germuska M, Merola A, Murphy K, et al. A forward modelling approach for the estimation of oxygen extraction fraction by calibrated fMRI. Neuroimage. 2016;139:313-323.
6. Blockley N, Griffeth V, Germuska M, et al. An analysis of the use of hyperoxia for measuring venous cerebral blood volume: Comparison of the existing method with a new analysis approach. Neuroimage. 2013;72: 33–40.
Figures