4631
Contribution of Systemic Vascular Effects on White Matter BOLD fMRI Signal1Advanced MRI Section, LFMI, NINDS, National Institutes of Health, Bethesda, MD, United States
Synopsis
To probe a potential physiological mechanism behind reported BOLD fMRI signals in white matter (WM), we compared pulse-oximetry signals measured from finger-tip photo-plethysmography (PPG) with fMRI signals recorded simultaneously during an overnight sleep study. Intermittent amplitude (AMP) drops were observed during which WM signal increased and grey matter signal decreased. These findings point to a systemic vascular contribution to WM fMRI signals, driven by AMP drops, and possibly linked to fluctuations in arousal state.
Introduction
In recent years, a number of fMRI studies have reported BOLD signal in white matter (WM)1-3. However, because the neurovascular response in WM is expected to be small, to what extent the WM BOLD response reflects local neuronal activity remains unclear. In fact, WM BOLD signal has been found to correlate with systemic hemodynamic fluctuations measured from the fingertip4. To further investigate this, we compared fMRI and pulse-oximetry measured with finger-tip photo-plethysmography (PPG) signals recorded during an overnight sleep study.Methods
BOLD fMRI data was obtained at 3T with gradient-echo-EPI (FA=900, TR=3s, TE=36ms, resolution=2.5mm, slice-thickness=2mm, slice-gap=0.5mm, matrix-size=96x70x50, R=2 GRAPPA). EEG and ECG were acquired concurrently with the fMRI.
PPG signals were aligned with fMRI data according to Biopac-recorded MR triggers and bandpass-filtered between 0.5 and 2Hz to help peak detection. The amplitude of the PPG signal corresponding to each fMRI volume was then defined as the amplitude of the PPG peak occurring closest to each trigger. Zero-mean HR time-series (beats-per-minute) and respiration volumes (RV) were calculated according to the differences between pairs of adjacent heartbeats, and the standard deviation of the respiratory waveform, respectively (for details, see Chang et al.5).
Initial inspection of the data showed that PPG amplitude varied strongly. In about 20% of the data, predominantly during light sleep conditions, intermittent and sudden drops in PPG amplitude were observed, similar to those previously attributed to arousal6. Based on this, we analyzed from each of 8 subjects a 5-10 minute segment of data that was selected was based on good PPG data quality, the presence of sudden amplitude drops, the absence of subject motion, and the presence of light sleep. The latter was based on sleep scoring with Analyzer in 30-s epochs7, after correction of MRI gradient8 and cardio-ballistic artifacts9, and band-pass filtering between 0.3 and 35Hz of the EEG data. fMRI data processing with AFNI included motion coregistration, brain masking, regressing out motion parameters and low-frequency signal drifts with a polynomial regression, and slice timing correction.
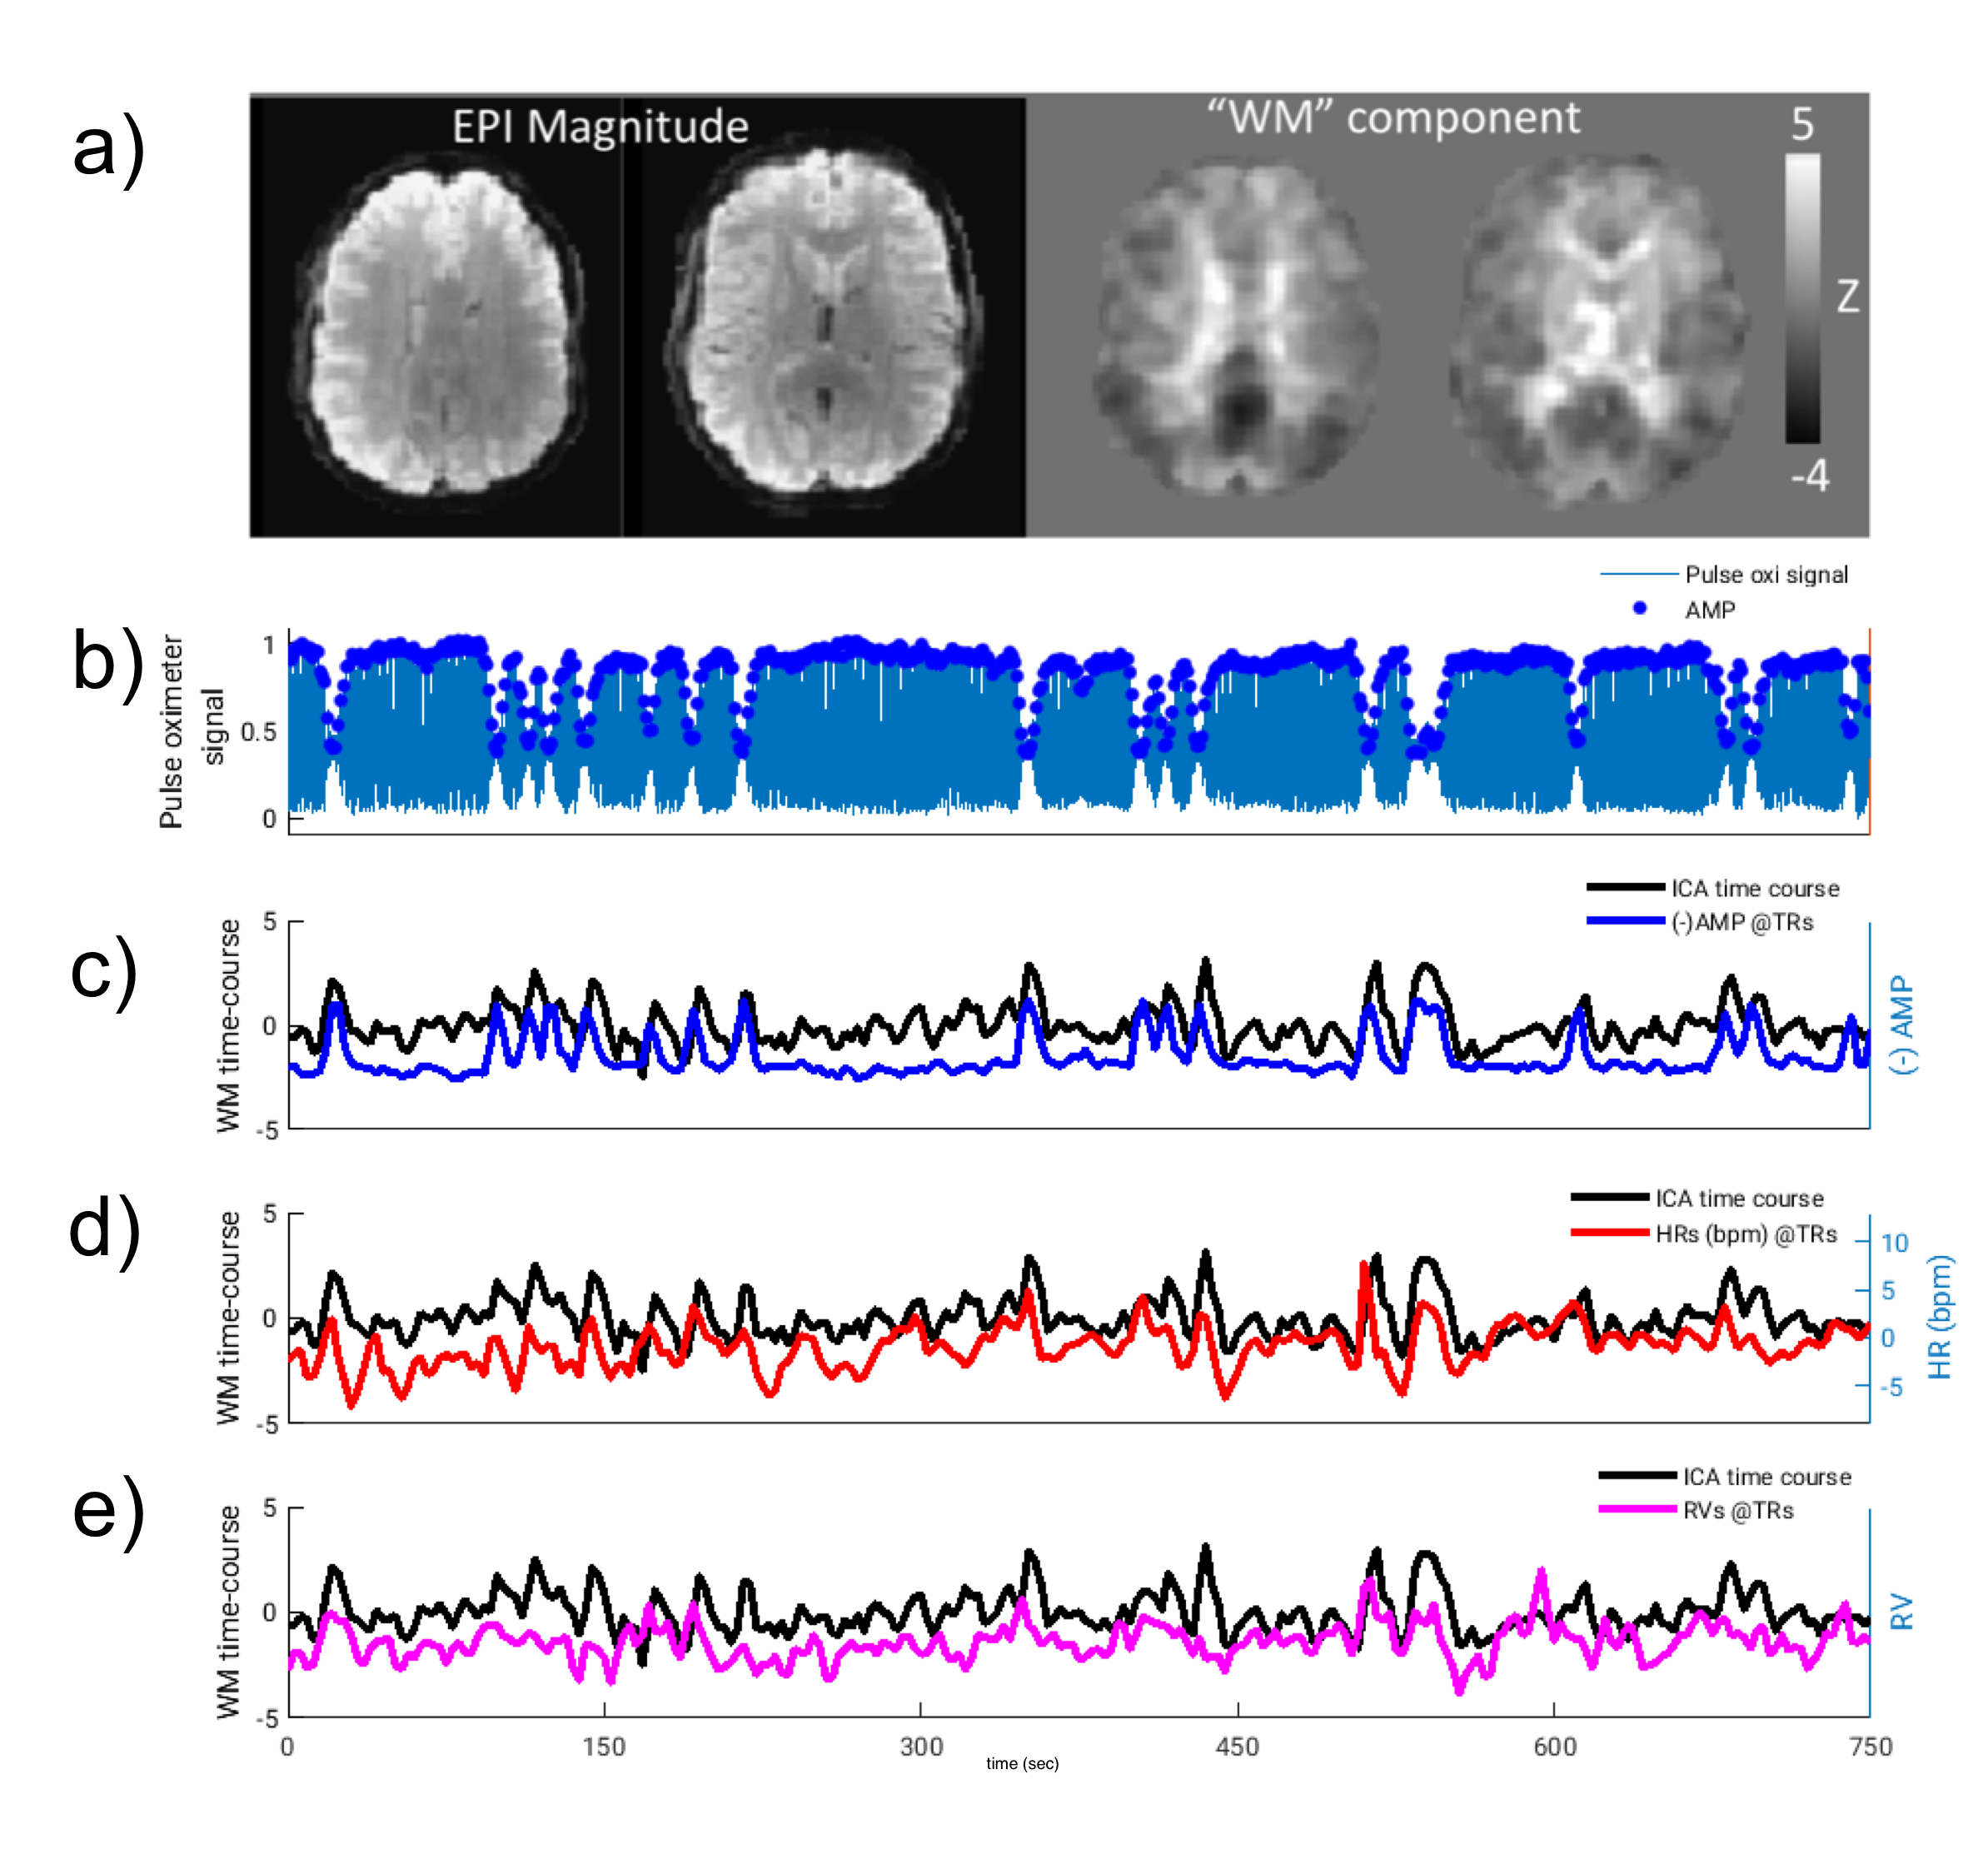
Lag-dependent correlations between AMP and the fMRI signal were performed on a voxel-by-voxel and region-of-interest (ROI) basis. For the latter, ROIs were generated in WM and grey matter (GM) with Independent Component Analysis (ICA) (15 components, MELODIC, FSL10). Selection of components to represent WM and GM (visual (GM-vc) and motor areas (GM-mc)) was performed visually based on their spatial characteristic, and correlations of WM components’ time-courses with AMP, HR and RV are calculated. Thresholded ICs were used to create ROIs, as identified by the MELODIC with alternative hypothesis testing (p>0.5) (z-scores, mean±std: WM=2.05±0.16, GM-vc=2.33±0.15, GM-mc=2.13±0.24). After thresholding, an average of 71±0.13% of WM-ROIs was found to be overlapping with WM-masks (FAST, FSL10). GM-ROIs were multiplied by a GM-mask, to exclude WM and CSF regions. This GM segmentation (GM-all) was used as separate ROI.
Results
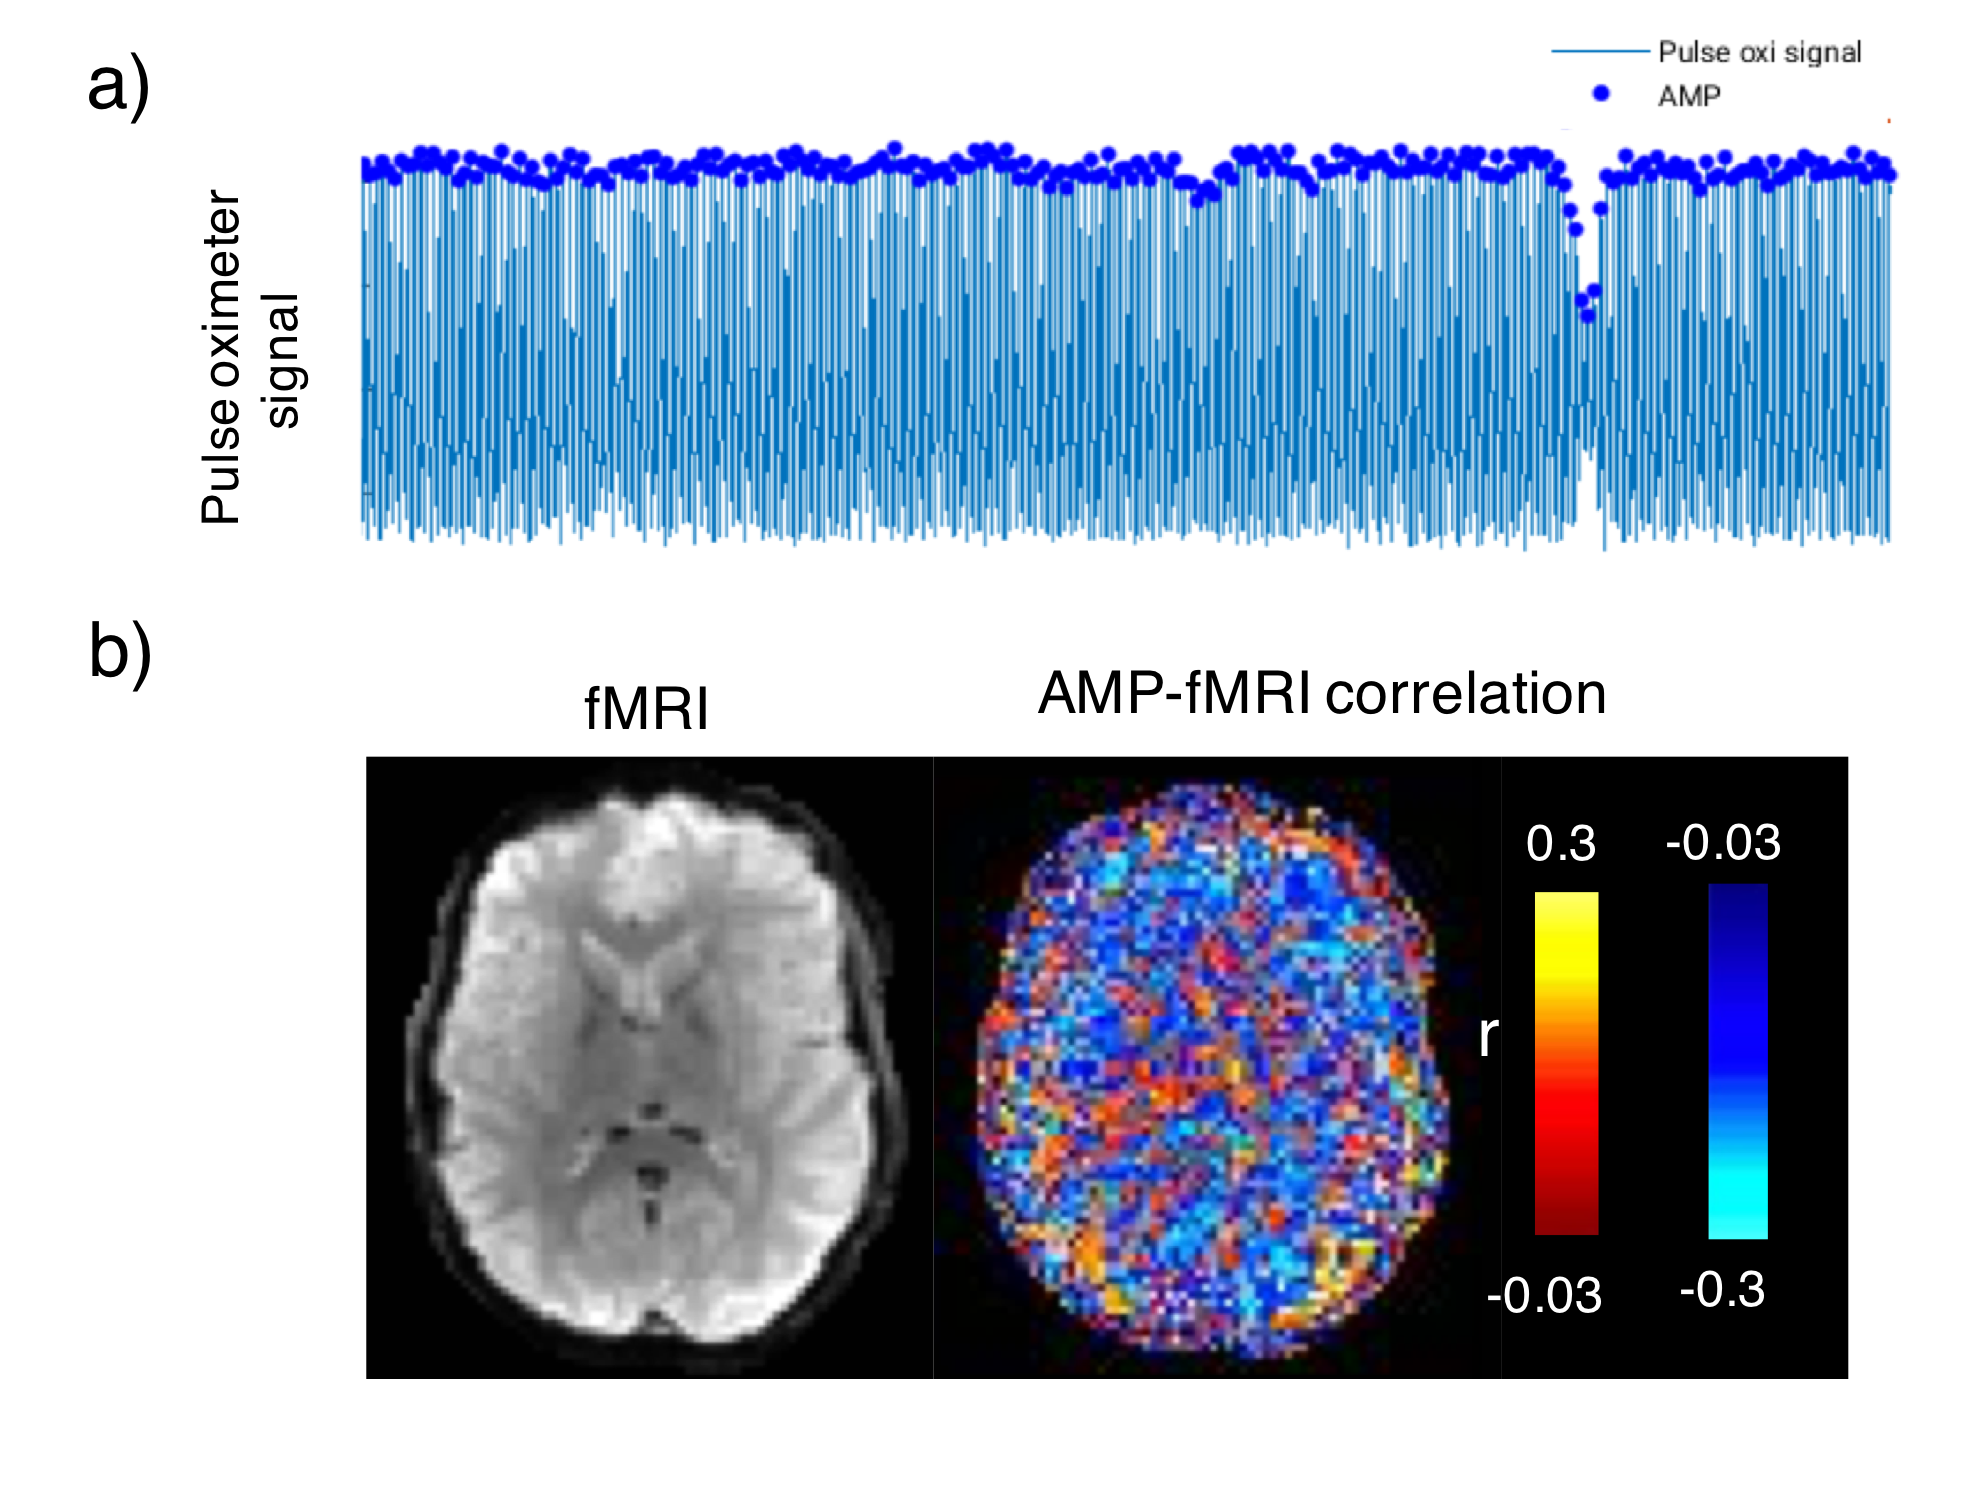
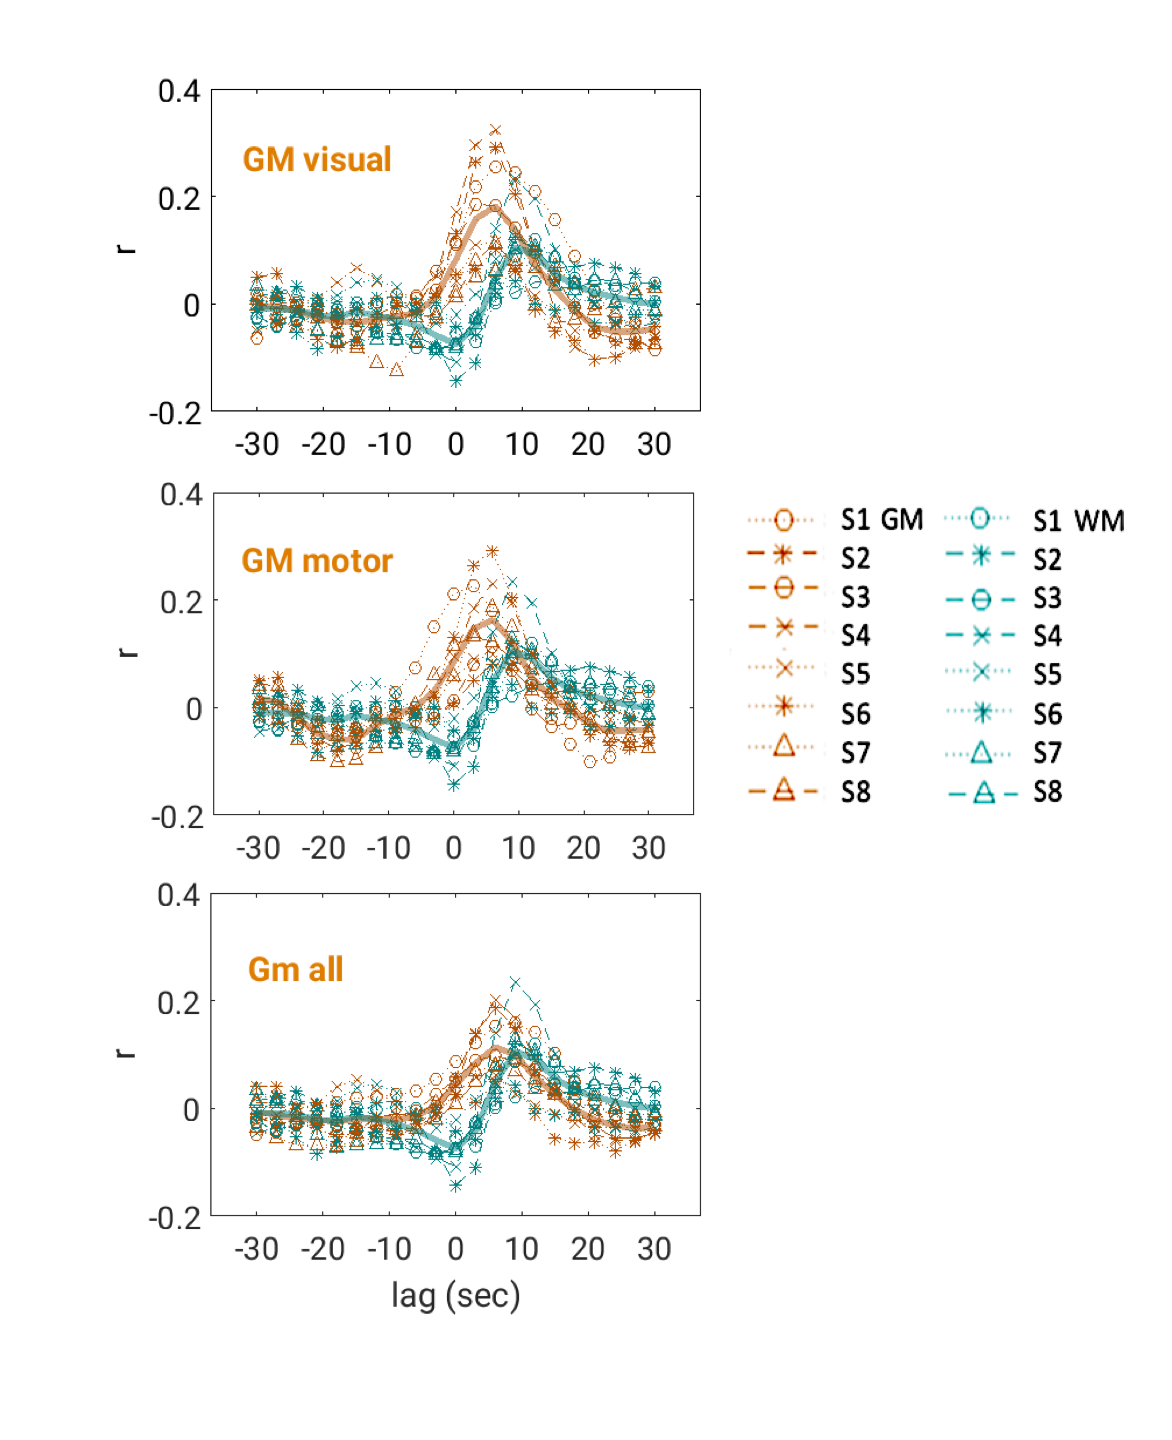
Intermittent AMP drops were associated with strong signal changes in both GM and WM, in particular a 0 and 3s lag of the fMRI signal (Fig. 1). The GM and WM correlations appeared to be distinctly different, and at the early lags antipolar. Time-course information of WM component derived from ICA (Fig. 2) showed irregular occurring peaks corresponded closely to AMP drops. Substantial, but somewhat smaller correlation was also seen between WM component time-course and HR and RV. In the absence of AMP dips, correlation between AMP and fMRI signal was minimal (Fig. 3). The distinct difference between GM and WM correlates of AMP dips is also clear from the ROI-averaged correlation plots (Fig. 4), where WM correlate is bipolar, and GM unipolar.Discussion
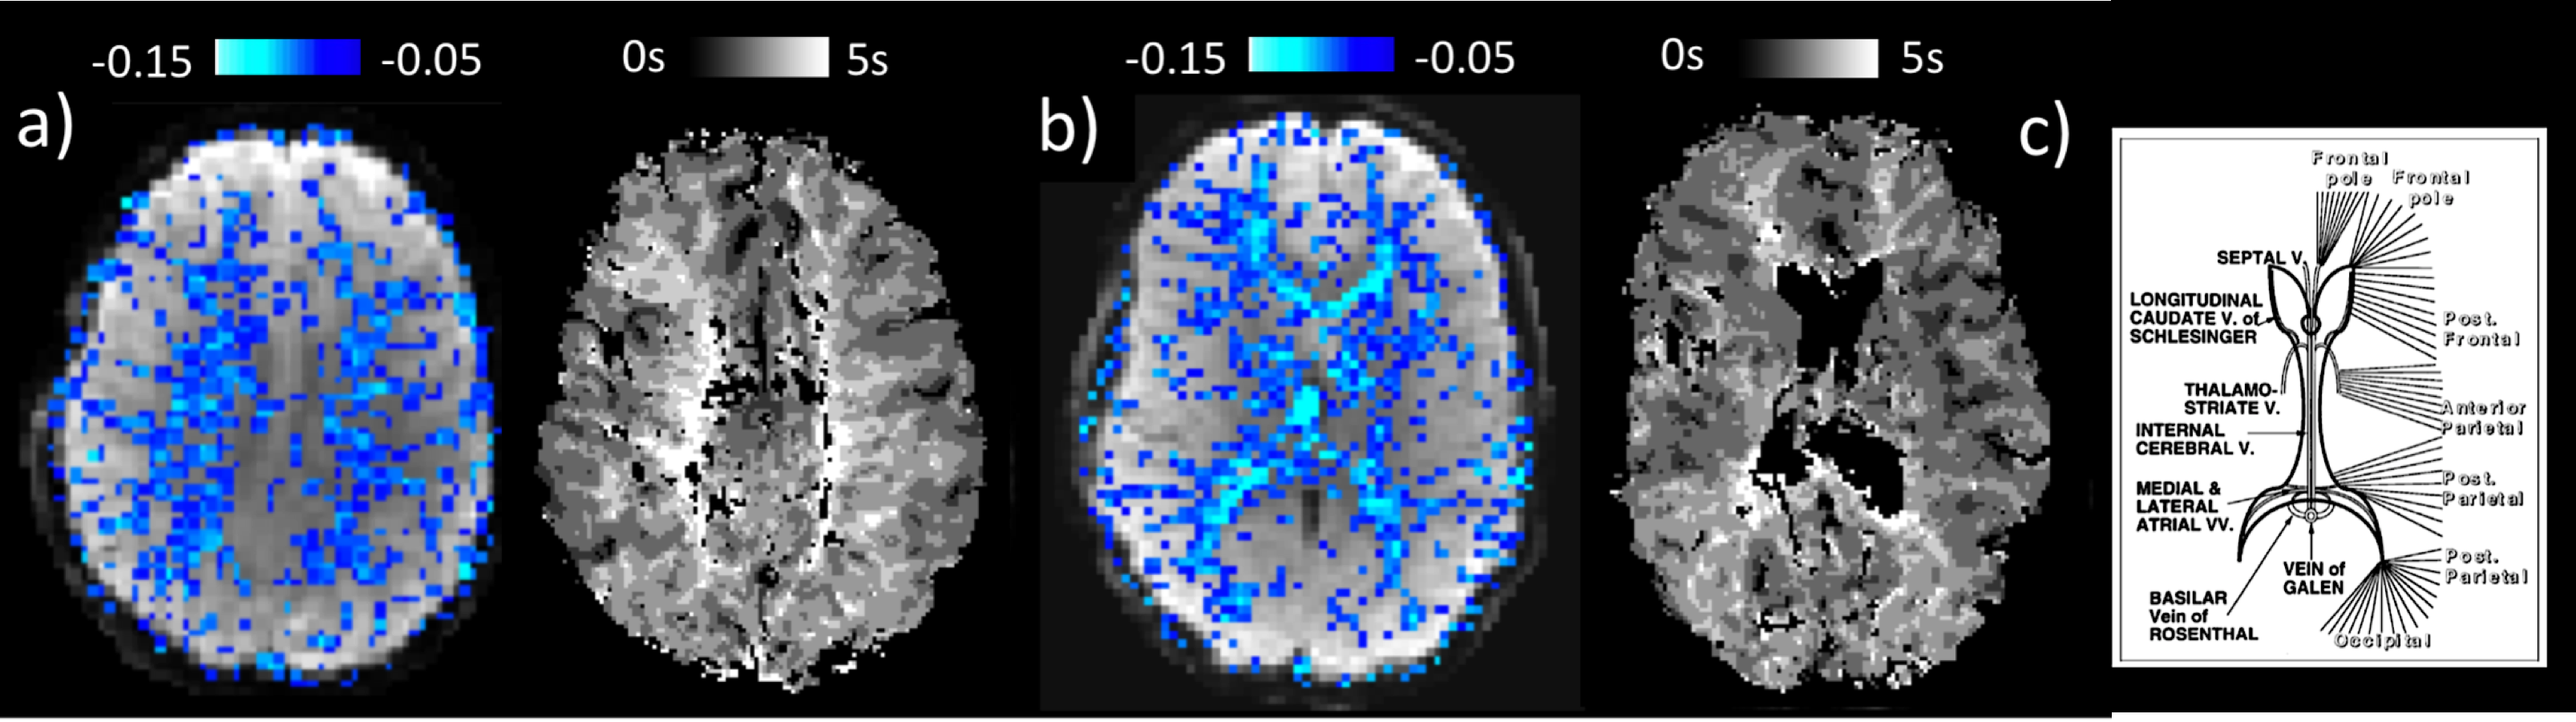
We found intermittent drops in the amplitude of the PPG signal to have a strong correlate in the fMRI signal, both in WM and GM. Our findings point to a systemic vascular contribution to WM signals, in line with previous fMRI-NIRS data4. The PPG drops are interpreted as systemic vasoconstrictions, possibly related to intermittent increases in sympathetic tone due to fluctuations in arousal state6. The distinct difference in temporal characteristics of the effects in GM and WM is attributed to a long blood transit time in the medullary vasculature supplying the deep WM that has been observed previously with bolus-tracking experiments (Fig. 5). This transit time causes a substantial timing mismatch between blood volume and oxygenation changes in WM which have opposing effects on the BOLD signal, with a fast blood volume change associated with upstream pressure changes, and a delayed oxygen change due to the long transit time. A similar mechanism may also explain previous findings of negative WM signals around large draining veins during both task- and resting-state fMRI11.Acknowledgements
This research was supported by the Intramural Research Program of the National Institute of Neurological Disorders and Stroke, National Institutes of Health, Bethesda, MD, USA.References
1.Gawryluk, J. R., Mazerolle, E. L. & D'Arcy, R. C. Does functional MRI detect activation in white matter? A review of emerging evidence, issues, and future directions. Front Neurosci 8, 239 (2014).
2.Mazerolle, E. L. et al. Confirming white matter fMRI activation in the corpus callosum: co-localization with DTI tractography. Neuroimage 50, 616-621 (2010).
3.Marussich, L., Lu, K. H., Wen, H. & Liu, Z. Mapping white-matter functional organization at rest and during naturalistic visual perception. Neuroimage 146, 1128-1141 (2017).
4.Tong, Y. et al. Evaluating the effects of systemic low frequency oscillations measured in the periphery on the independent component analysis results of resting state networks. Neuroimage 76, 202-215 (2013).
5.Chang, C., Cunningham, J. P. & Glover, G. H. Influence of heart rate on the BOLD signal: the cardiac response function. Neuroimage 44, 857-869 (2009).
6.Adler, D. et al. Pulse wave amplitude reduction: a surrogate marker of micro-arousals associated with respiratory events occurring under non-invasive ventilation? Respir Med 107, 2053-2060 (2013).
7.Iber C, A.-I. S., Chesson AL Jr., Quan SF. AASM manual for the scoring of sleep and associated events: Rules, terminology and technical specifications. (American Academy of Sleep Medicine, 2007).
8.Allen, P. J., Josephs, O. & Turner, R. A method for removing imaging artifact from continuous EEG recorded during functional MRI. Neuroimage 12, 230-239 (2000).
9.Liu, Z., de Zwart, J. A., van Gelderen, P., Kuo, L. W. & Duyn, J. H. Statistical feature extraction for artifact removal from concurrent fMRI-EEG recordings. Neuroimage 59, 2073-2087 (2012).
10.Jenkinson, M., Beckmann, C. F., Behrens, T. E., Woolrich, M. W. & Smith, S. M. Fsl. Neuroimage 62, 782-790 (2012).
11.Bianciardi, M., Fukunaga, M., van Gelderen, P., de Zwart, J. A. & Duyn, J. H. Negative BOLD-fMRI signals in large cerebral veins. J Cereb Blood Flow Metab 31, 401-412 (2011).
12.Lee, C., Pennington, M. A. & Kenney, C. M., 3rd. MR evaluation of developmental venous anomalies: medullary venous anatomy of venous angiomas. AJNR Am J Neuroradiol 17, 61-70 (1996).
Figures
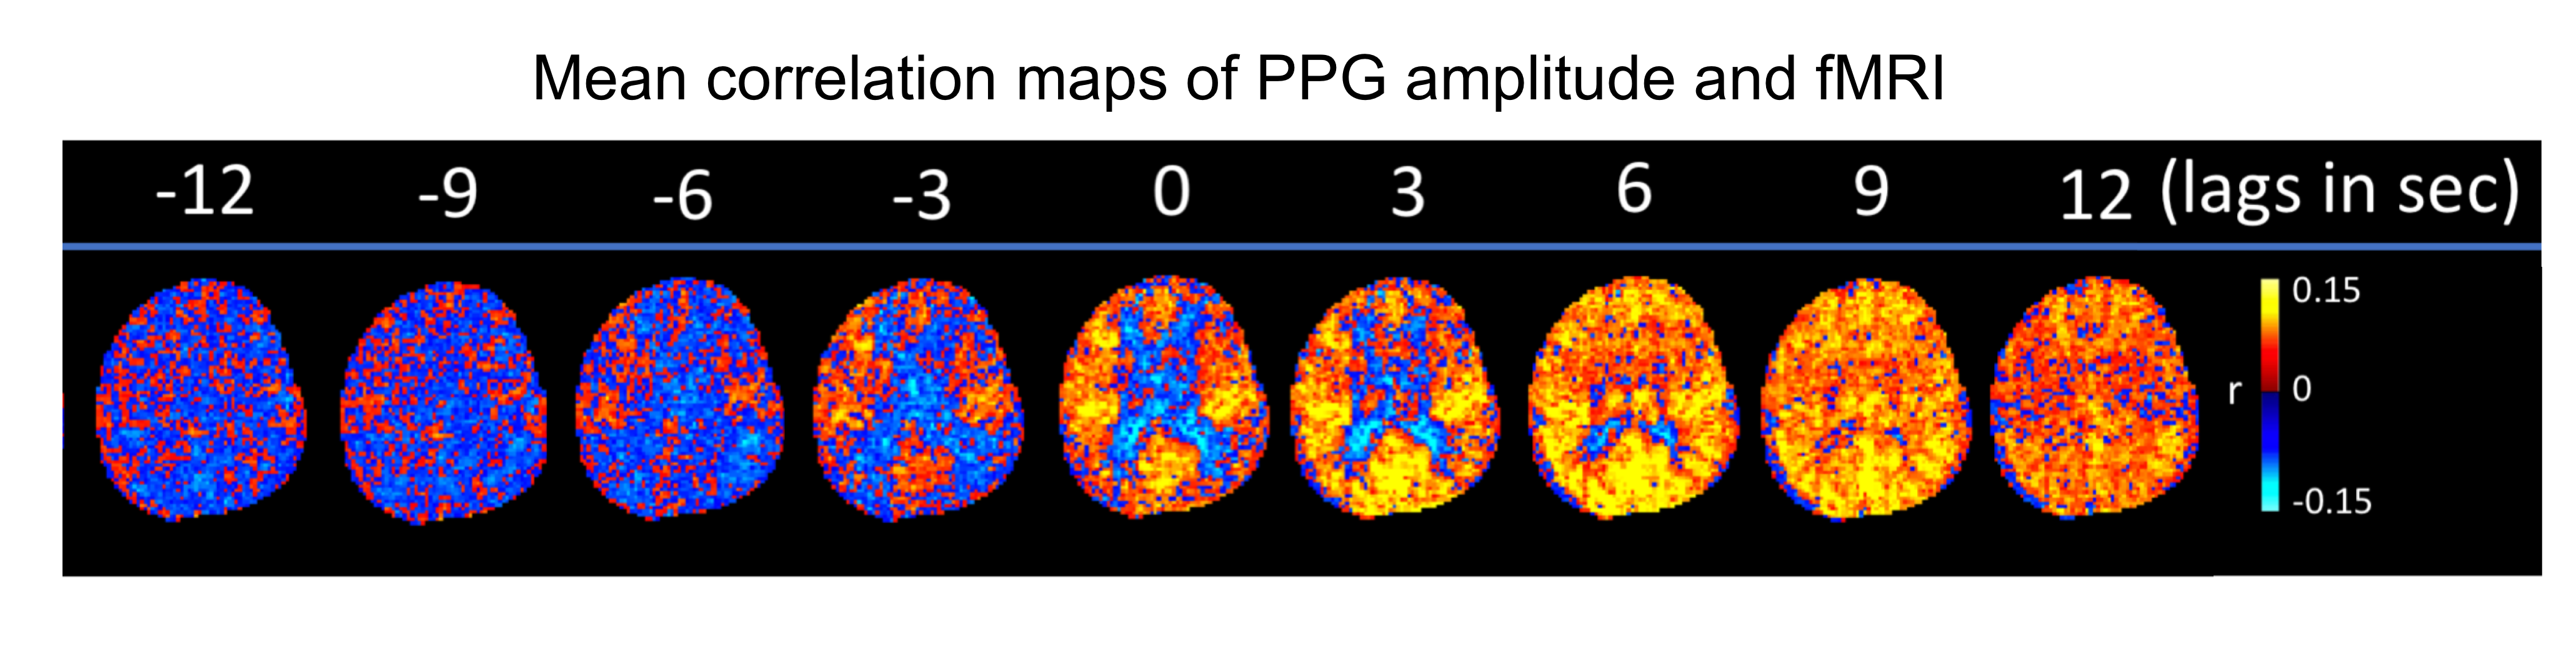
Figure 1: Selected slices from mean (over 8 subjects) correlation maps of AMP and fMRI at different time lags, -4 TR (-12 sec) to 4 TR (+ 12 sec).