4630
Physiology of CO2 and neurovascular coupling: the impact of cerebrovascular reserve on Blood-Oxygenation-Level-Dependent functional MRI measurements1Neuroradiology, University Hospital Zurich, Zurich, Switzerland, 2Neurosurgery, University Hospital Zurich, Zurich, Switzerland
Synopsis
We investigate the effect of a general resting state of 40mmHg CO2 as compared to a physiological resting state on BOLD fMRI cerebrovascular reactivity and task based finger-tapping measurements in healthy subjects.
We found that BOLD CVR and fMRI activation are significantly lower when measured at a set ‘‘isocapnic’’ baseline then at the physiological resting CO2. Our second finding is that fMRI signal changes significantly correlates to CVR and both measurements are similarly affected.
Introduction
In functional magnetic resonance imaging (fMRI), a local increase in cerebral blood flow (CBF) following neuronal activation induces a blood oxygenation-level-dependent (BOLD) signal increase through lowering of the deoxyhemoglobin blood content. The BOLD signal increase is generated by a complex physiological mechanism named neurovascular coupling: neuronal activity increases local CBF superseding the cerebral-metabolic-rate-of-oxygen (CMRO2) increase, leading to a physiological hyperemia and a localized change in deoxyhemoglobin ratio (∆deoxyhemoglobin) that BOLD fMRI can map.
Otherwise, by applying vasodilatory stimuli, e.g. carbon dioxide (CO2), BOLD signal changes can be induced for the entire brain. From this BOLD signal response to CO2 changes, cerebrovascular reactivity (CVR) is measured. CVR is understood as the CBF change due to a vasoactive stimulus and quantifies the cerebrovascular (blood flow) reserve. Recent patient studies have shown that neuronal activity localization using BOLD fMRI may exhibit false negative activation (--i.e. neurovascular uncoupling--) in brain areas with impaired CVR.
CVR examinations under controlled CO2 conditions are the most sensitive and reproducible. To measure CVR, controlled BOLD CVR studies have commonly been performed using a preset isocapnic CO2 baseline at ~40mmHg, independently of subjects’ resting CO2 levels.
This arbitrary baseline might have influenced negatively CVR measurements and task-based BOLD fMRI signal changes. To test this hypothesis, we performed BOLD CVR and controlled BOLD bilateral finger-tapping task fMRI in groupA at subject’s resting CO2 and in groupB at a preset isocapnic CO2 baseline (40mmHg).
Methods
BOLD CVR, as well as a controlled bilateral finger-tapping task BOLD fMRI in two groups of ten subjects: groupA at each subject’s resting CO2 and groupB at a preset isocapnic CO2 baseline (40mmHg) were performed, similarly as explained in 1.
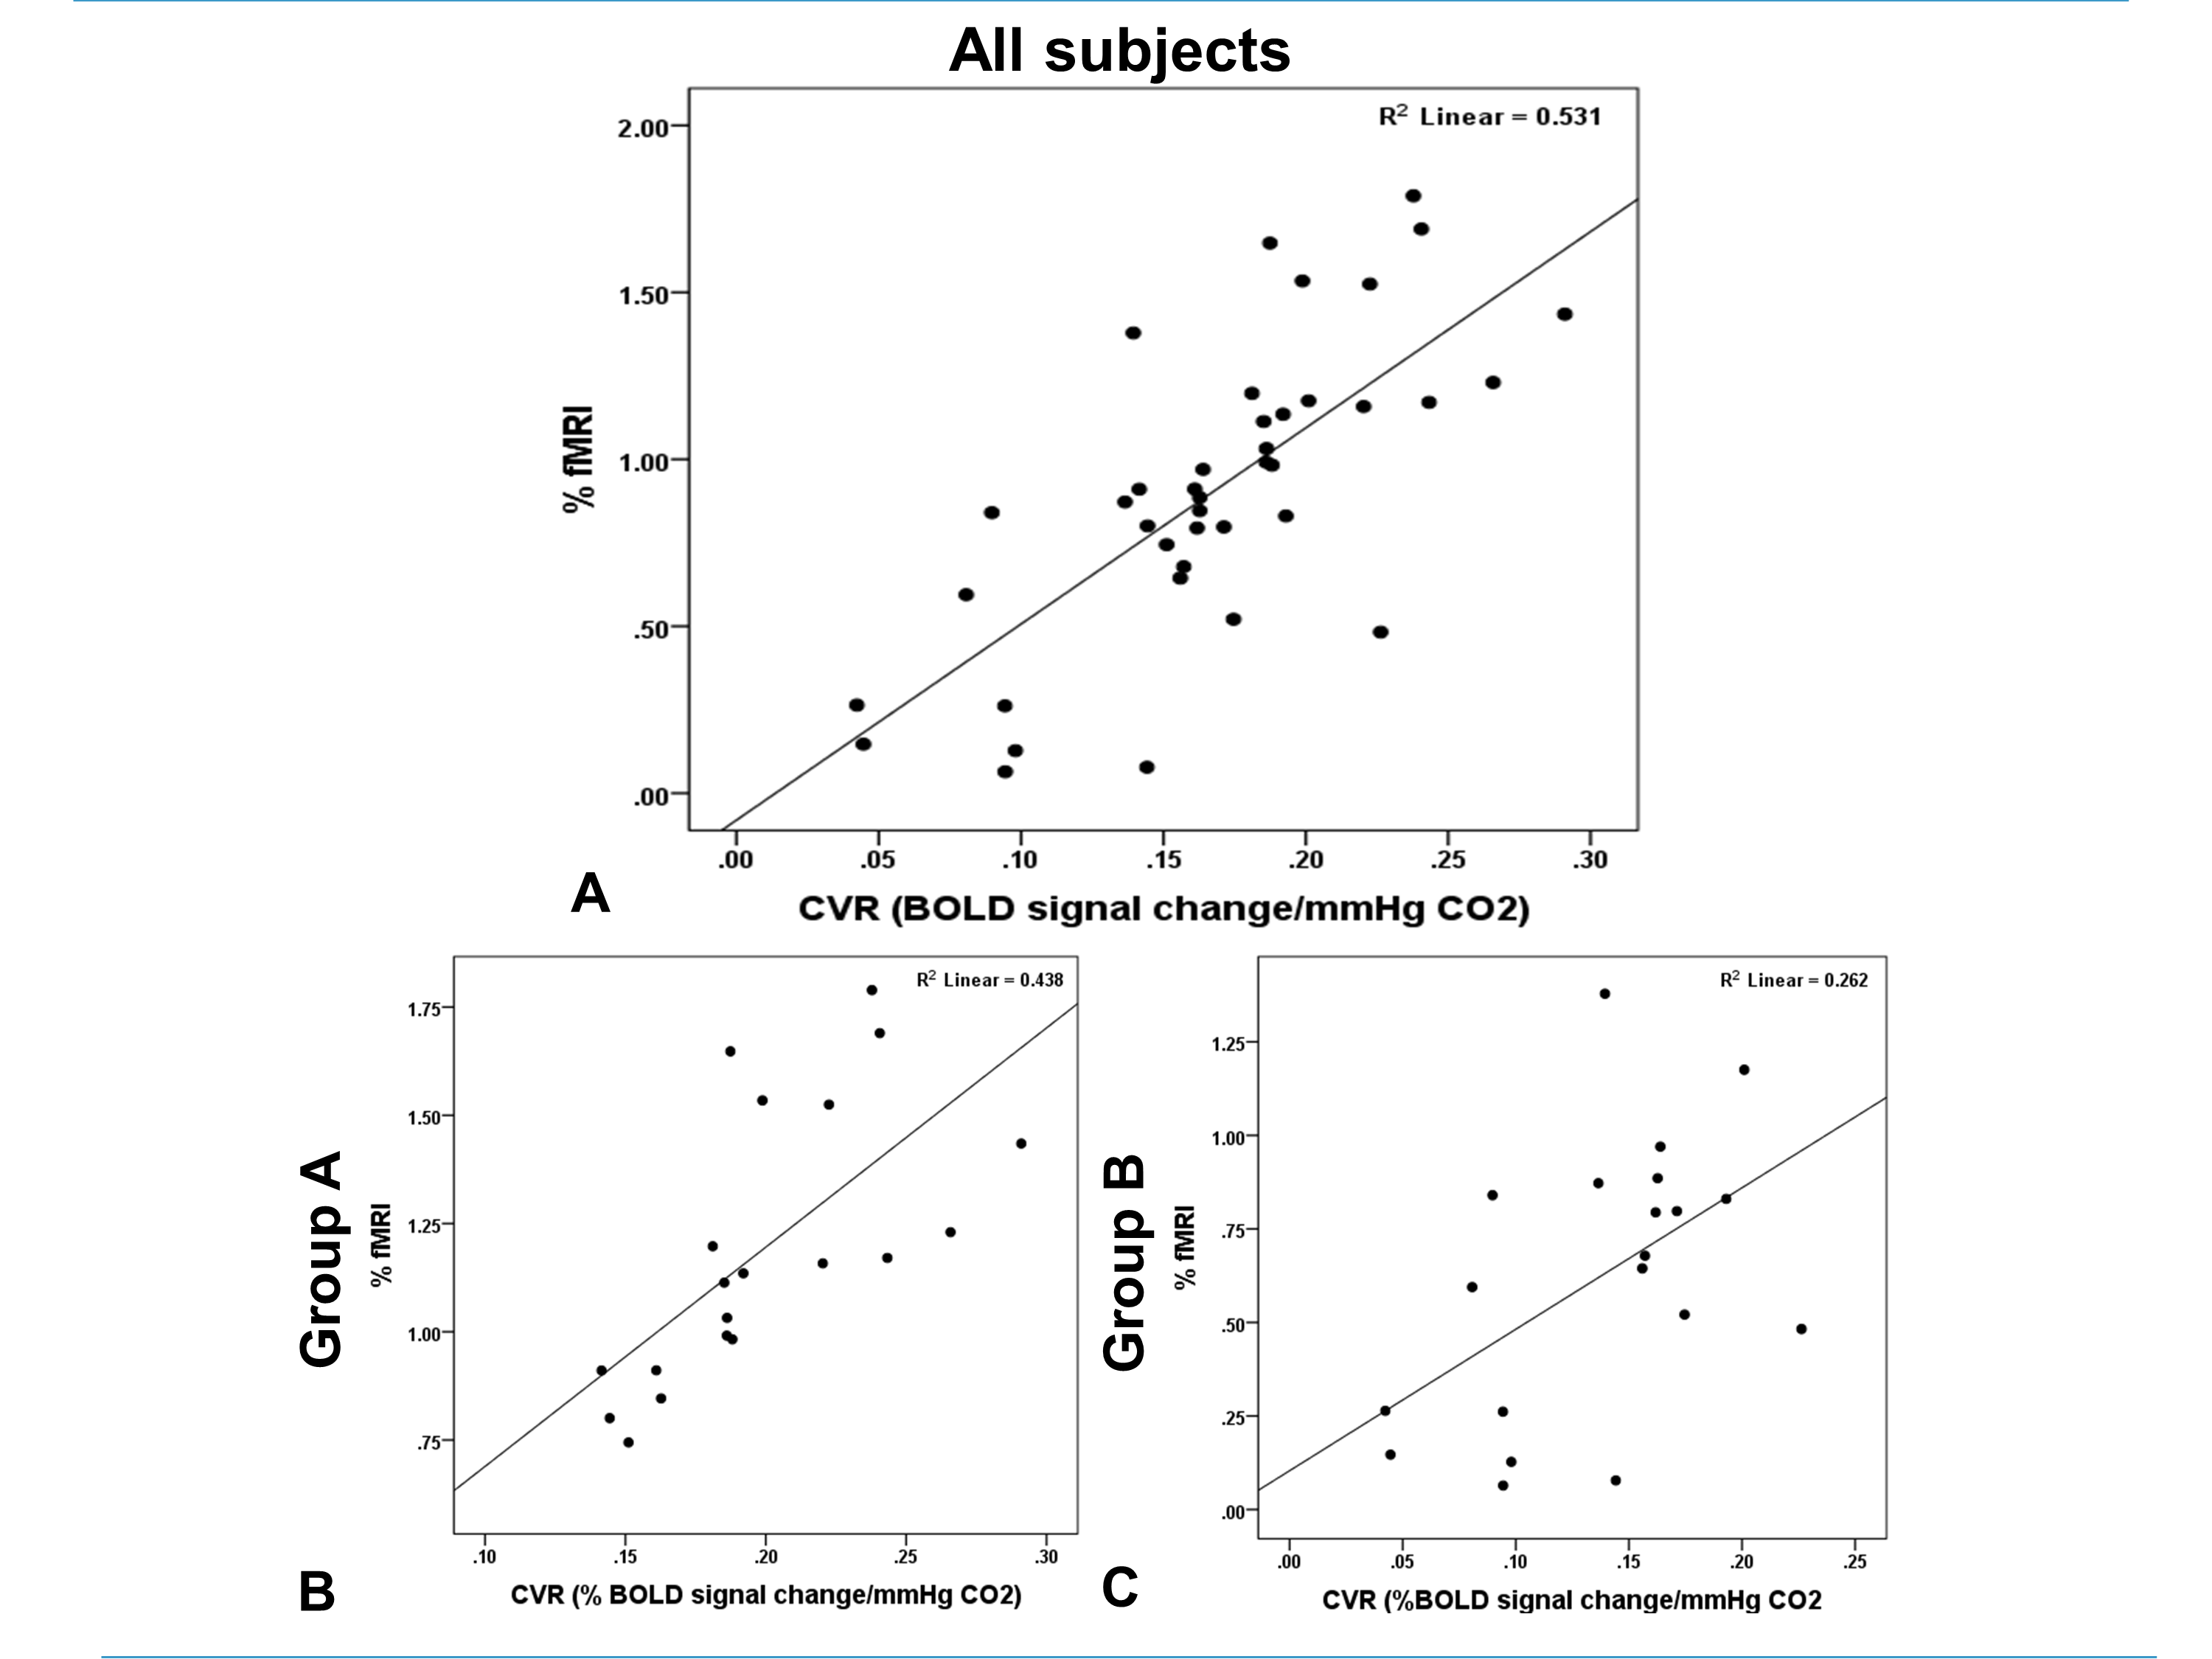
Using CVR and relative BOLD fMRI signal change within the anatomically defined hand area in the precentral cortex, we constructed a generalized linear model between the two variables using CVR as an independent variable. (Figure2)
Results
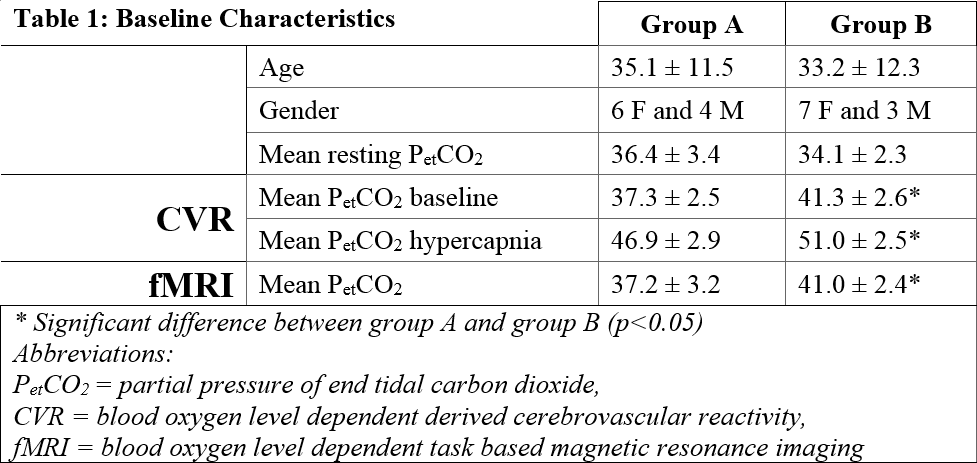
Breathing baseline characteristics of both groups and individual characteristics are shown in Table 1. No significant differences were found between groups’ resting PetCO2 (groupA PetCO2: 35.3±2.9 mmHg; groupB PetCO2: 33.6±1.7).
CVR for groupA were >60% higher than for groupB for the whole brain averaged values (0.26±0.05 vs. 0.16±0.05, BOLD/mmHg, p<0.01), and >40% higher for each hand area (left hand area, groupA vs. groupB: 0.20±0.05 vs. 0.14±0.05, p<0.01; right hand area, groupA vs groupB: 0.20±0.03 vs 0.14±0.06, p<0.01).
fMRI finger-tapping maps also exhibited in the bilateral hand areas decreased signal changes in groupB (relative BOLD fMRI, groupA vs. groupB, left hand area: 1.22±0.36 vs 0.61±0.36, p<0.01; right hand area: 1.16±0.27 vs 0.63±0.41, p=0.04).
The mean hand area’s CVR and BOLD fMRI were highly correlated (r2= 0.53, p<0.05). (Figure2)
Discussion
We found that CO2 levels influence both CVR and BOLD fMRI measurements, and that BOLD CVR and BOLD fMRI are strongly correlated. More than half of the variance of relative BOLD fMRI signal change is explained by the mean CVR in the hand region. This correlation was even stronger for groupA.
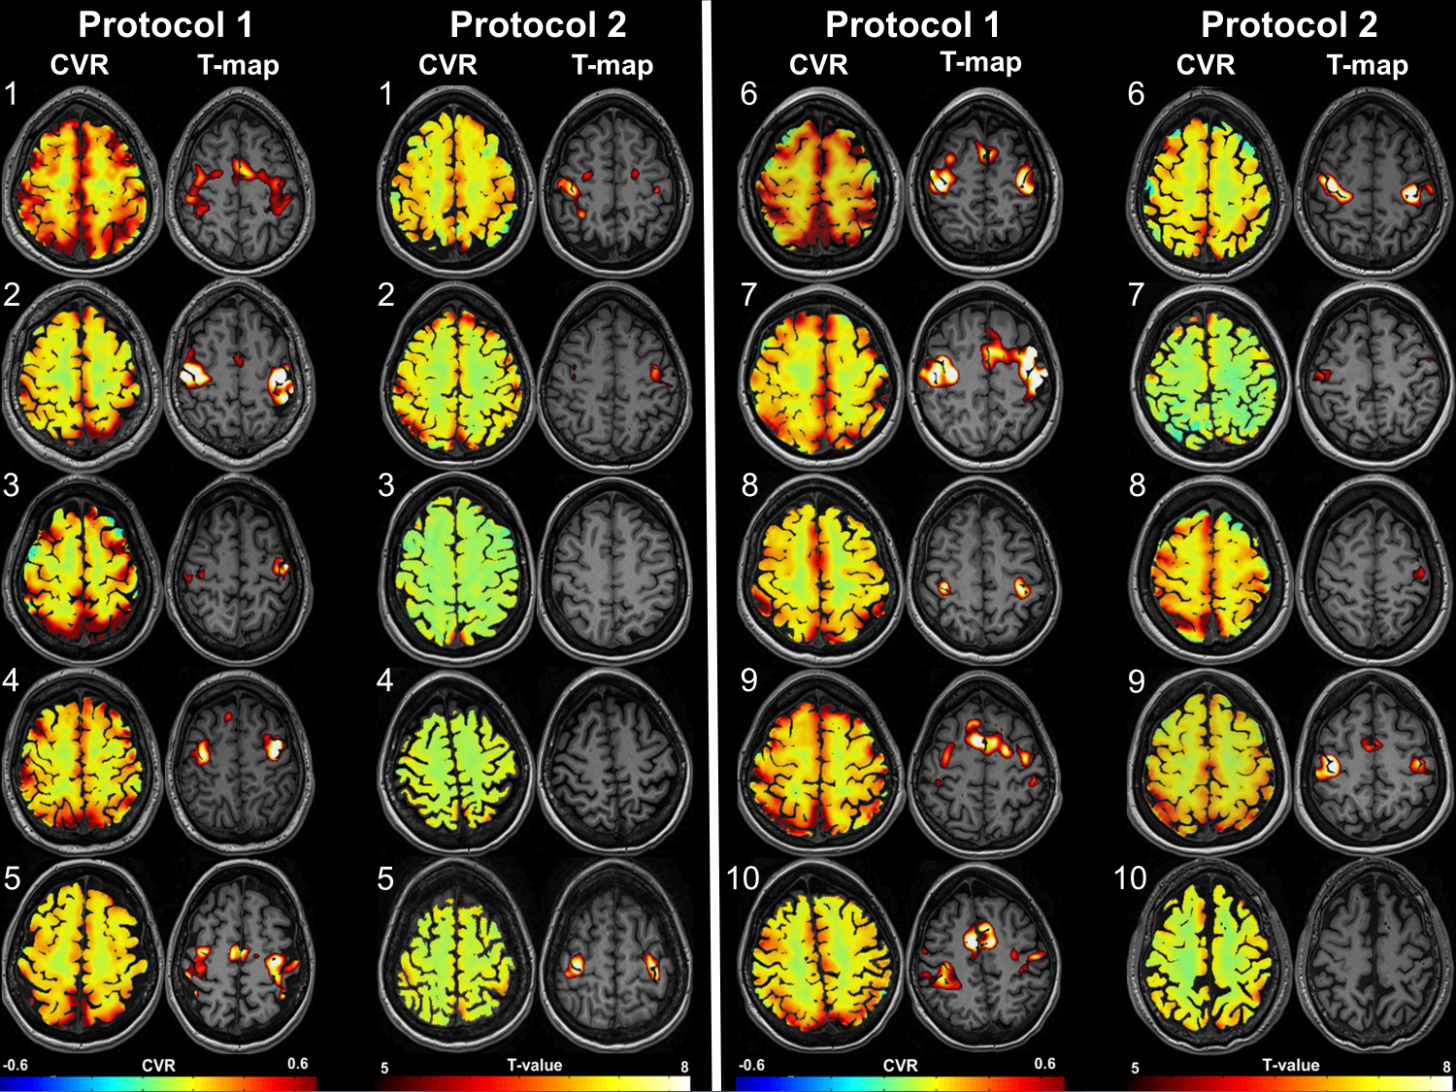
In subjects with higher CVR values, BOLD activation patterns are generally seen in pre-, post-central gyri. as well as the supplementary motor cortex. Decreased CVR does diminish activation in these areas. (Figure1)
These results can be explained by the interaction between CO2 and the BOLD signal, previously described as a sigmoidal curve. BOLD signal changes can reach a sublinear phase of this curve at hypercapnic CO2. Further, CVR measurements are highly influenced by the CO2 baseline level on this curve. For instance, in patients with severe steno-occlusive disease, cerebral arteries dilate ipsilateral to the stenotic or occluded vessel, resulting in a shift of this sigmoidal BOLD/CO2 curve towards lower CO2 resulting, through decreased maximal vasodilatory capacity, in a BOLD fMRI signal diminution.
In earlier studies, ‘isocapnia’ was anticipated around 40mmHg CO2. In our study, however, a preset CO2 baseline of 40 mmHg in healthy subjects with lower resting CO2 resulted in 40% dampened CVR. With the premise that ‘isocapnia’ is at the subjects own resting CO2, a preset baseline of 40mmHg is expected to induce premature vasodilation and shift the BOLD/CO2 levels more towards the sublinear range of the sigmoidal curve. Consequently, using a similar CO2 increase (i.e. 10 mmHg), CVR would artificially be reduced in an otherwise healthy capillary bed.
Conclusion
Hence, truly isocapnic CO2 levels and BOLD CVR determination should be considered complementary to BOLD fMRI for accurate interpretation of neurovascular coupling for activation maps.Acknowledgements
CHBvN and MP contributed equally.References
van Niftrik CHB, Piccirelli M, et al. Iterative analysis of cerebrovascular reactivity dynamic response by temporal decomposition. Brain and behavior. 2017Figures