4624
Variable-TE STIR computed Diffusion Weighted Imaging Technique for the abdomen1MRI Systems Development Department, Toshiba Medical Systems Corporation, Tochigi, Japan
Synopsis
In this study to the authors adapted the variable-TE cDWI (vTE-cDWI) technique to the abdominal region, using ADC map, T2 map and T1 map with IR-based images. The algorithm under evaluation allows computing diffusion images for arbitrary combinations of TE, b-value and TI based on four acquisitions (4-points method). This technique was shown to generate STIR-cDWI with higher SNR compared to the acquired STIR-DWI, as well as obtain ADC maps and T1 maps with optimal TI for any arbitrary tissue. The clinical benefits of the method and the preliminary results on volunteers are discussed.
PURPOSE:
A computed diffusion weighted imaging (cDWI) algorithm was previously presented, demonstrating improvement in lesion detection in oncologic body imaging[1-3]. This algorithm works by computing high b-value-equivalent images from relatively low b images. More recently a variable-TE cDWI (vTE-cDWI) technique was proposed for the brain allowing the computation of DWIs with arbitrary combinations of TE (including zero) and b[4]. This method enables to control the T2-shine-through effects and optimize the SNR and CNR of tissues based on T2 and ADC. In the present study we extended the vTE-cDWI technique, including T1maps with IR-based images, adapting it to the abdomen[5]. Improved CNR and SNR is achieved by computing images with arbitrary TE and b, while reducing the T2-shine-through effects and allowing for selective tissue suppression through the arbitrary TI. Results were tested on three healthy volunteers.METHODS:
Theory: For a SEEPI2D (mDWI) with a set TE and b, the intensity at a voxel location characterized by known T2 and ADC parameters is described by:
$$$S(TE,b) = k\cdot exp(-TE/T2)\cdot exp(-b\cdot ADC)$$$ (1)
k being a constant for the voxel. Similarly, IR-based mDWI signal intensity at given TI, TE, and b when TR is set to infinity is described by:
$$$S(TI,TE,b)=k\cdot(1-2 exp(-TI/T1))\cdot exp(-TE⁄T2)\cdot exp(-b\cdot ADC)$$$ (2)
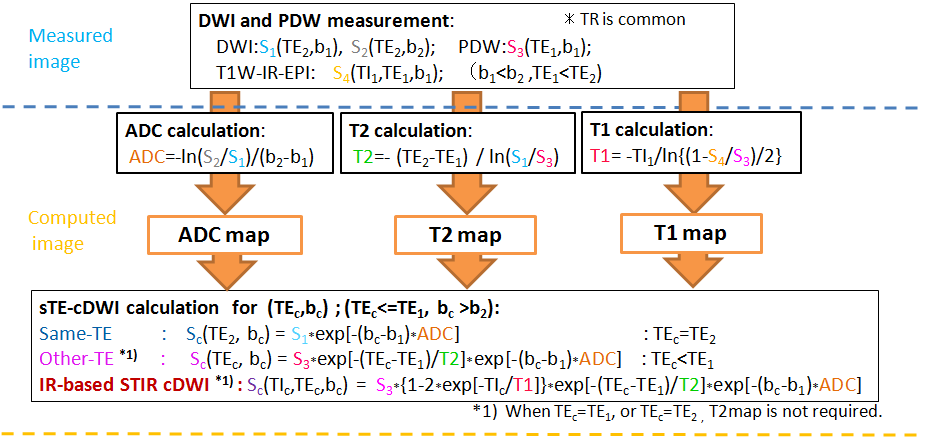
In this study, a 4-point cDWI method was applied, along the algorithm shown in Fig.1, as follows:
a) Same-TE cDWI[1-3]:
A 2-points technique is applied, measuring mDWI signals at the same TE=TE2 for two different b-values (b1<b2), and solving (1) for the ADC:
$$$ADC=-ln[S_{2}(TE_{2},b_{2})⁄S_{1}(TE_{2},b_{1})]⁄(b_{2}-b_{1})$$$ (3)
The cDWI image at the original TE=TE2 and for arbitrary b=bc is obtained by replacing (3) into (1):
$$$Sc(TE_{2},b_{c})=S_{1}(TE_{2},b_{1})\cdot exp[-(b_{c}-b_{1})\cdot ADC]$$$ (4)
b) Different-TE cDWI (vTE-cDWI)[4]:
The tissue T2 can be obtained from (1) by measuring two mDWI with the same b=b1 and different TEs (TE1<TE2):
$$$1⁄T2=-ln[S_{1}(TE_{2},b_{1})⁄S_{3}(TE_{1},b_{1}) ]⁄(TE_{2}-TE_{1})$$$ (5)
The diffusion image at arbitrary TE=TEc and b=bc is obtained replacing the calculated ADC (3) and T2 (5) in (1):
$$$Sc(TEc,bc)=S_{3}(TE_{1},b_{1})\cdot exp[-(TEc-TE_{1})⁄T2]\cdot exp[-(bc-b_{1})\cdot ADC]$$$ (6)
(6) allows to compute sTE-cDWI images free of T2-effects (TEc=0).
c) IR-based STIR vTE-cDWI:
T1 is derived from (2) with the IR term in S4(TI1,TE1,b1) by setting TI=TI1, the SE signal of PDW S3(TE1,b2) , and selecting a sufficiently long TR2:
$$$1⁄T1=-ln[(1-S_{4}/S_{3})/2]⁄TI_{1}$$$ (7)
By replacing the calculated ADC (3), T2 (5), and T1 (7) in (2), we can compute the diffusion image at arbitrary TI=TIc, TE=TEc and b=bc as:
$$$Sc(TIc,TEc,bc) =S_{3}\cdot[1-2\cdot exp(-TIc/T1)]\cdot exp[-(TEc-TE_{1})/T2]\cdot exp[-(bc-b_{1})\cdot ADC]$$$ (8)
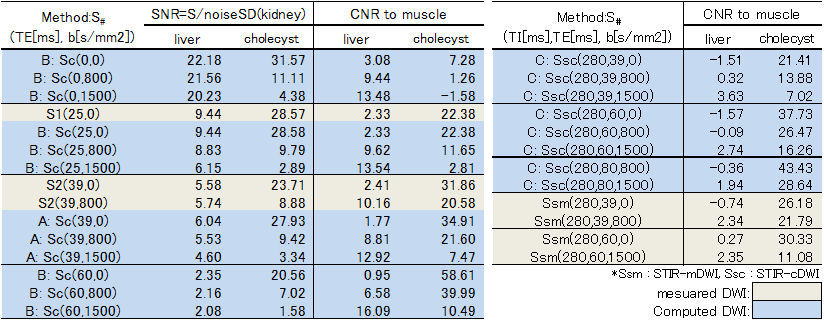
Volunteers study: The models described above were validated on three volunteers. Abdominal axial scans through the liver were acquired on a Toshiba 3T MR system using a single-shot SEEPI2D sequence. Acquisition parameters for the 4-points mDWI scans were: TE1=25ms, b1=0 without inversion and TE1=25ms, b1=0 with TI1=600ms, TE2=39ms with b1=0 and b2=800s/mm2. TE3=45ms and TE4=60ms with b1=0 were also acquired for a more accurate assessment of the T2map. The T1map was calculated with TI-off(=infinity) and TI=600ms for the same TE1=25ms. The cDWI and STIR-cDWI signals for bc=800, and 1500s/mm2 were calculated at different TEc. ROIs were drawn on the liver, cholecyst, kidney, and the erector spinae muscle. SNR related to kidney-SD and CNR with respect to the muscle were measured for each ROI (Table.1).
RESULTS AND DISCUSSION:
Volunteers’ scans demonstrated an increased liver-to-muscle CNR for shorter TEs, suggesting that the cDWI can improve the characterization of tissues with short T2. The SNR of the cholecyst in vTE-cDWI images at (TE,b)=(60,800) was reduced compared to lower TEs at the same b=800s/mm2, suggesting that T2-shine-thorough effects are reduced in short-TE cDWI images.
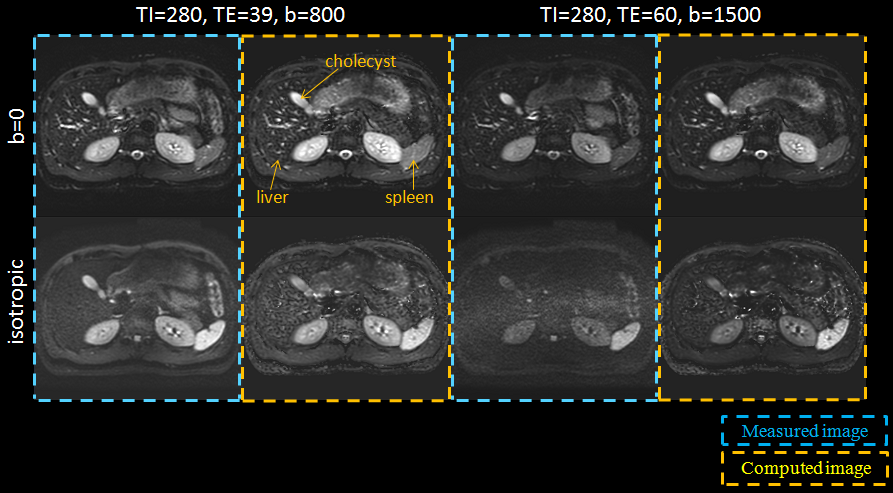
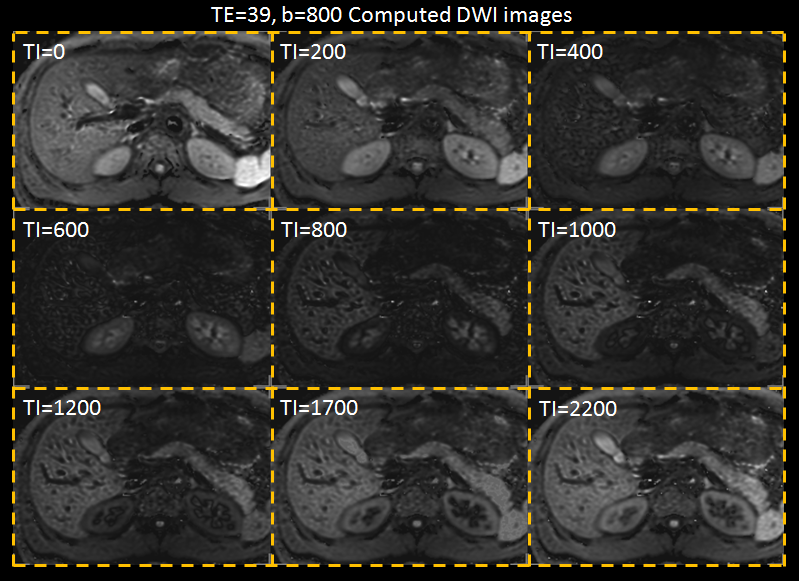
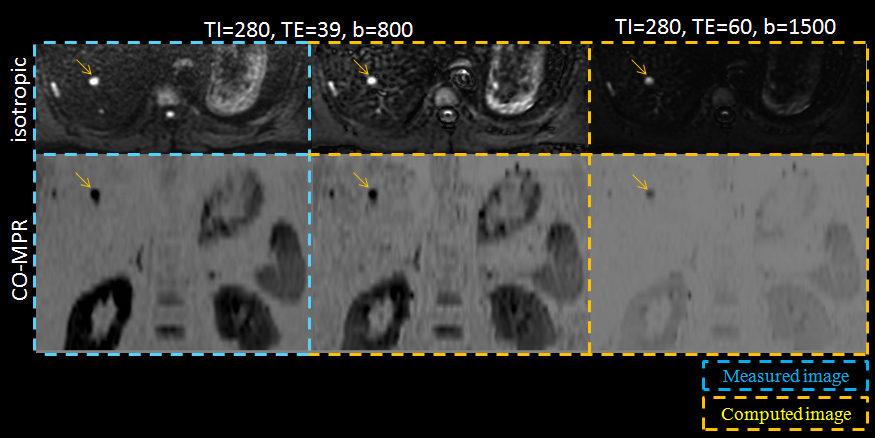
SNRs in the liver and cholecyst for the IR-based STIR vTE-cDWI (method-C) increased at (TI1,TE,b)=(280,60,1500) compared to the STIR-mDWI (Fig.2). The IR-based STIR vTE-cDWI in the abdomen is meant for fat suppression or background suppression, and benefits from controlling TE, b and TI (Fig.3,Fig4).
This technique demonstrated an improved CNR compared to acquired images because of the contribution of the T1map. Lastly, STIR-mDWI is difficult to acquire using Respiratory-Gating due to the longer TI. This technique allows to overcome this limitation by calculating cDWI images with any arbitrary TI.
CONCLUSION:
In this study the authors adapted the IR based STIR vTE-cDWI technique[4] to the relevant case of abdominal imaging.
It was demonstrated that the techniques is capable of generating STIR-cDWI with higher SNR compared to acquired STIR-DWI, with the additional benefit of generating the ADCmap and T1map with an optimal TI for any predetermined tissue. While further investigation is necessary, the method is expected to be clinically useful for an improved characterization of liver masses through a more efficient suppression of surrounding tissues.
Acknowledgements
No acknowledgement found.References
[1] Blackledge MD, Leach MO, Collins DJ, et al. Computed Diffusion-weighted MR Imaging May Improve Tumor Detection. Radiology: 261,573-581(2011).
[2] Ueno Y, Takahashi S, Kitajima K, Kimura T et al. Computed diffusion-weighted imaging using 3-T magnetic resonance imaging for prostate cancer diagnosis. Eur Radiol 23,3509-16 (2013).
[3] Kimura T, Machi Y. Computed Diffusion Weighted Imaging Under Rician Noise Distribution. In: Proceedings of the 20th Annual Meeting of ISMRM, 2012;p3574.
[4] Kimura T, Machi Y et al. A short-TE Computed Diffusion Imaging (cDWI). In: Proceedings of the 23th Annual Meeting of ISMRM, 2015;p2929.
[5] Warntjes JBM et al. Rapid Magnetic Resonance Quantification on the Brain. Magn Reson Med 60:320–329 (2008).
Figures