4622
Toward quantification of renal tubular volume fraction using diffusion-weighted split-echo RARE in conjunction with a three-compartment IVIM model1Berlin Ultrahigh Field Facility (B.U.F.F.), Max Delbrueck Center for Molecular Medicine, Berlin, Germany, 2Institute for Vegetative Physiology, Charité – University Medicine Berlin, Berlin, Germany, 3Physikalisch-Technische Bundesanstalt (PTB), Berlin, Germany, 4Experimental and Clinical Research Center (ECRC), a joint cooperation between the Charité Medical Faculty and the Max Delbrueck Center for Molecular Medicine in the Helmholtz Association, Berlin, Germany
Synopsis
T2* mapping does not fully represent renal tissue oxygenation. Diffusion-weighted imaging (DWI) can provide information about confounding factors such as tubular volume fraction, which can be used to correct T2*. By using a three compartment IVIM model, tubular volume fraction can be mapped with DWI. The most widely used DWI technique is spin-echo EPI which is sensitive to magnetic field inhomogeneities and hence prone to geometric distortions. In this work we propose a diffusion-weighted Rapid Acquisition Relaxation Enhancement (RARE) variant for DWI of the rat kidney free of geometric distortions to quantify tubular volume fraction at 9.4 Tesla.
Introduction
The imbalance between oxygen-demand and oxygen-supply is considered to be a common cause of several kidney diseases. Blood oxygenation sensitized MRI (T2*mapping) can provide information about changes in renal oxygenation. Yet, experiments combining MRI and invasive physiological measurements of the kidney under (patho)physiologically relevant conditions demonstrated that T2* does not accurately represent renal-tissue oxygenation1,2. Confounding factors such as tubular volume fraction(tvf) should be taken into account for the interpretation of renal T2* mapping and for a reliable information about renal-tissue oxygenation. The tvf is a unique feature of the kidney, which can go up to 45% in the medulla and can rapidly change due to alterations in filtration or tubular-outflow3,11. Diffusion-weighted imaging(DWI) provides a method for in-vivo evaluation of tissue-water mobility. Renal-DWI studies commonly use a mono-exponential signal decay model which does not differentiate between water diffusion in blood and urine. For quantification of tvf a three-compartment IVIM (intra-voxel-incoherent-motion) approach is conceptually appealing since it allows the separation of the true-diffusion coefficient(D), the intermediate-diffusion coefficient(Di*) related to pseudo-diffusion of flowing tubular fluid and the fast-pseudo-diffusion(Df*) due to blood. A three-compartment IVIM model can be implemented using the following tri-exponential equation5,6:
$$S(b)=S_0*((1-f_i-f_f)*exp(-b*D)+f_i*exp(-b*D_i^*)+f_f*exp(-b*D_f^*))$$
The contribution of the signal(fi) coming from the is related to tvf4-6. En route to non-invasive assessment of changes in renal tvf this work employs a diffusion-weighted split-echo RARE7 variant in conjunction with a three-compartment IVIM-model.
Methods
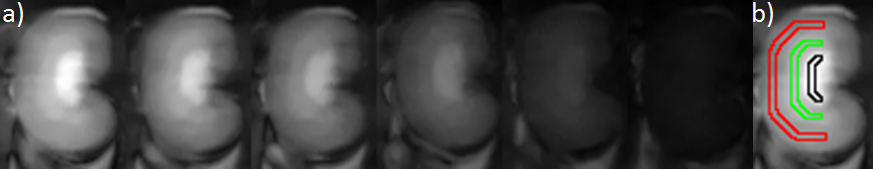
The Stejskal-Tanner preparation was used to introduce diffusion sensitization to a split-echo RARE7 variant to ensure renal-DWI free-of-geometric distortion. Diffusion-gradients were placed around the first refocusing RF-pulse. A split-echo acquisition was used to avoid destructive interferences between even and odd echoes8,9. The 3-compartment model parameters diffusion (D,Di*,Df*) and fraction (ff,fi) were obtained by fitting the data to equation(1). In-vivo experiments with adult female Wistar-rats with respiration-triggering were performed at a 9.4Tesla small-animal scanner (Bruker Biospec, Ettlingen, Germany). Data were reconstructed using custom-made MATLAB code. All images were de-noised with a spatially-adaptive-non-local-means filter to improve signal-to-noise-ratio. The b-values used were: 0,4,8,12,18,24,34,43,52,75,115,201,300,460,600 and 800s/mm2. Three-orthogonal diffusion directions were taken and averaged to account for the non-isotropy of the kidney. A tri-exponential pixelwise fit was employed over the whole kidney and three manually created ROIs: cortex (red), outer-medulla (green) and inner-medulla (black).Results
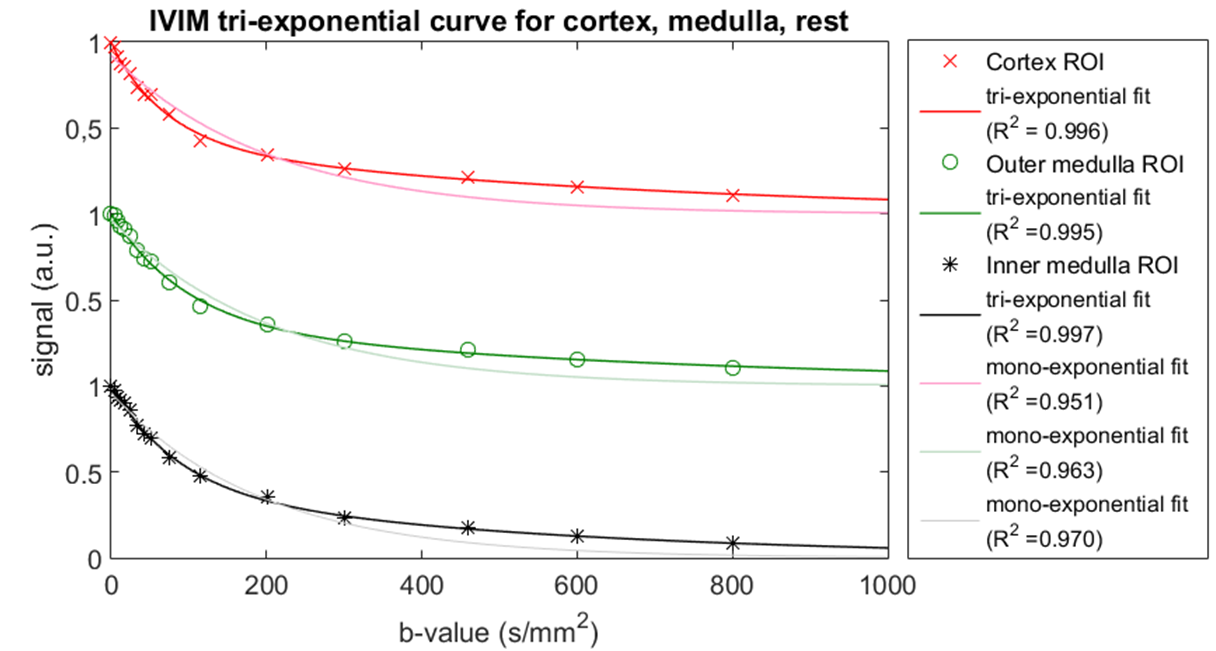
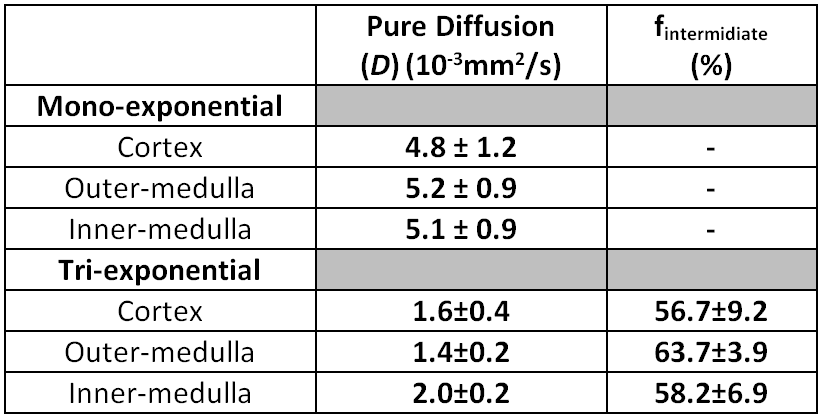
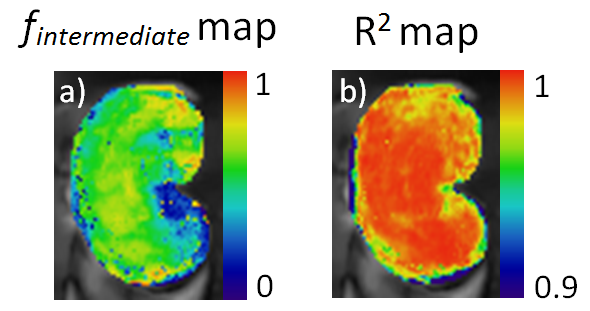
Figure 1.a demonstrates excellent image quality, anatomic fidelity free-of-geometric distortions and ample diffusion contrast in the rat kidney obtained with diffusion weighted split-RARE using diffusion-sensitization ranging from b=0s/mm2 to b=800s/mm2. For b<115s/mm2 renal cortex (outer-layer) and renal medulla (inner-layer) can be conveniently distinguished based upon differences in water diffusion. A comparison of the mono and tri-exponential fit performed for the ROIs is provided in Figure 2. For all three ROIs, the R2 regression coefficients derived from the fit of the three-compartment IVIM-model to the real-data points are superior to those deduced from the mono-exponential fit. Table 1 surveys the diffusion coefficients obtained from the mono and the tri-exponential fit of the diffusion-weighted signal decay data for the renal cortex, outer-medulla and inner-medulla. The pure-diffusion coefficient(D) was 1.6x10⁻³mm2/s for the renal cortex, 1.4x10⁻³mm2/s for the outer-medulla, and 2.0x10⁻³mm2/s for the inner-medulla. The volume fraction of the intermediate water diffusion compartment was 57% for the cortex, 64% for the outer-medulla and 58% for the inner-medulla. Figure 3 displays a fractional volume map(fi) for the intermediate-compartment together with a map of R2.Discussion and Conclusion
Probing vascular and tvf of the kidney is essential for detailing and interpreting the impact of changes in renal hemodynamics, tissue oxygenation, vascular and tvf under various (patho)physiological conditions. This work examined the applicability of diffusion-weighted RARE for the assessment of renal tvf. For this purpose a three-dimensional IVIM-model was used. Our results demonstrate that the quality of the regression of the fit to the real data is superior for the tri-exponential compartment model versus a mono-exponential fit. The pure-diffusion coefficients derived from a mono-exponential model are overestimated, which is in line with previous studies5. IVIM-parameter for pure-diffusion(D) is closer to the ADC of free-water (2.13×10⁻³mm2/s)10 in the inner-medulla, where the volume-fraction of the interstitium is increased11. The volume of the intermediate-compartment(fi) was found to be larger than 50% in the cortex and in the medulla. The numbers are larger than the expected, opening the question if the blood-flow and pseudo-diffusion in the capillaries are fast enough to allow the separation from the intermediate-compartment using a tri-exponential model. No values for intrarenal capillary blood-flow velocity were found in the literature. Further in-vivo studies employing diuretic-challenges and other pathophysiologically relevant changes in the tvf are needed to validate and understand the impact of the three-compartment IVIM-model.Acknowledgements
This work was supported in part by the Bundesministerium für Bildung und Forschung (BMBF, German Federal Ministry for Education and Research; grants VIP+ 03P00081, VIP+ 03P00082, VIP+ 03P00083).References
[1] Pohlmann et.al. , Acta Physiologica (2013) 8(2) ; [2] Pohlmann et al. Invest. Radiol. (2014) 49(8):547-60; [3] Niendorf et al. Acta Physiologica (2014) 213(1):19-38; [4] Le Bihan et al. Radiology (1988) 168(2):497-505; [5] van Baalen et al, Magn Reson Med. (2017) 46(1):228-239; [6] van der Bel et al, European Journal of Radiology (2017) 91(3) 168-174; [7] Hennig J, Magn Reson Med. (1986) 3 823-833; [8] Norris DG, Magn Reson Med. (1992) 27(1) 142-164; [9] Schick F, Magn Reson Med. (1997) 38(4) 638-644; [10] Deoni, Magn Reson Med. (2004) 51(2):428-433; [11] Knepper et al. (1977) 12 313-323Figures