4619
Repeatability of Apparent Diffusion Coefficient measurements using Simultaneous Multi-slice Diffusion-Weighted imaging with elastic in-plane motion correction: a Comparison with Conventional DWI in Healthy Liver Parenchyma1Department of Radiology, Peking Union Medical College Hospital, Beijing, China, 2Siemens Healthcare, MR Collaboration NE Asia, Beijing, China
Synopsis
The simultaneous multi-slice (SMS) technique allows reducing the scan time of DWI without significant compromises in image quality. An adequate test-retest reliability of apparent diffusion coefficient (ADC) is essential for clinical use. The aim of this study was to prospectively compare the ADC value and test-retest repeatability of SMS-DWI with elastic in-plane motion correction in comparison to conventional DWI in healthy liver parenchyma. SMS-DWI and motion corrected SMS-DWI images (Moco-SMS) demonstrated significantly higher ADC values than conventional DWI in almost all liver regions. Moco-SMS showed significantly higher test-retest repeatability than conventional DWI in regions close to liver edges.
Introduction
Diffusion-weighted imaging (DWI) allows quantitative assessment of water proton mobility by calculating the apparent diffusion coefficient (ADC). It has been widely used in hepatic imaging, and the ADC has been proposed as a potential imaging biomarker for monitoring the treatment response of malignant tumors.1 Adequate test-retest reliability is essential to monitor changes in mean ADC value during treatment. The scan time of DWI is generally long in the abdomen so that motion artifacts can be an issue.2 The simultaneous multi-slice (SMS) technique allows reducing the scan time by simultaneous excitation of multiple slices and without compromise in image quality. 3,4 Here we investigate the use of an elastic in-plane motion correction that aligns images of repeated acquisitions as well as different diffusion encodings and analyze its role on the reliability of SMS-DWI in the abdomen. The aims of this study were 1) to compare the ADC value and test-retest reliability of SMS-DWI with conventional DWI in healthy liver parenchyma, and 2) to compare the ADC reliability of conventional DWI and SMS-DWI with motion correction in different liver regions (e.g. near edge or center, right or left lobes).Methods
Eleven healthy volunteers underwent abdominal DWI on a MAGNETOM Skyra 3T MR scanner (Siemens Healthcare, Erlangen, Germany). Axial DWI of the liver was performed with two different protocols using a standard and a prototype SMS body diffusion sequence. Each sequence was performed twice during the same examination. All DWI measurements were performed with the following parameters: TR/TE=6400ms/62ms (conventional DWI), 3400ms/60ms (SMS-DWI); FOV=420mm×347mm; matrix size=132×160; voxel size=1.3×1.3×4mm; slice acceleration factor=2; b-values of 50 (3 average) and 800 s/mm2 (6 average); scan time 3:12min (conventional DWI), 2:02min (SMS-DWI). Motion-corrected b-value images (Moco-SMS) including both DWI and ADC series were automatically averaged and calculated from the SMS-accelerated DWI datasets after an elastic registration.
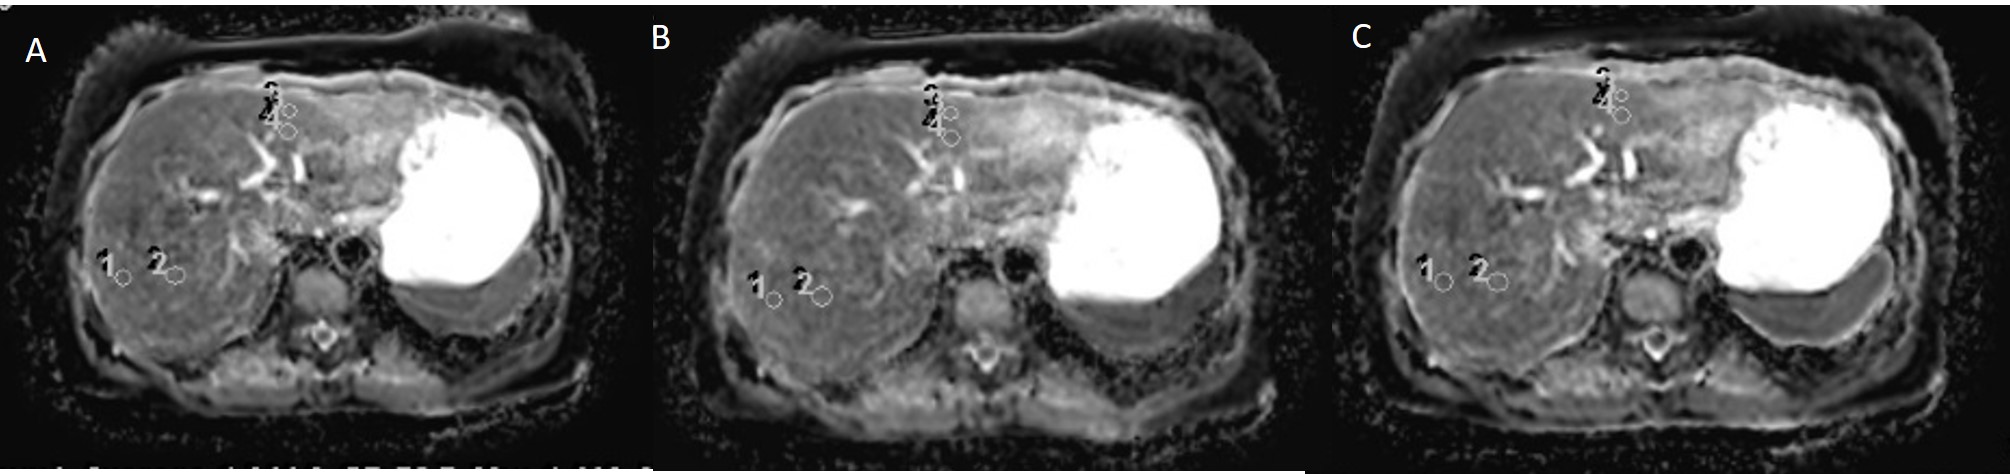
One radiologist performed the quantitative image analysis of ADC maps from conventional DWI (DWI-test, DWI-retest), SMS-DWI (SMS-test, SMS-retest), and Moco-SMS (Moco-SMS-test, Moco-SMS-retest) of the volunteers. 12 circular ROIs (area 0.4-0.7 cm2 ) were positioned in the liver——four ROIs on each of the upper, middle and lower sections of the liver, devoid of large intrahepatic vessels and prominent artifacts (one ROI near liver edge on right hepatic lobe, one ROI near center on right hepatic lobe, one ROI near liver edge on left hepatic lobe, one ROI near center on left hepatic lobe). ROIs were copied and pasted on the same image level on the other five datasets. The mean ADC value and the test-retest variability [TRV = 2|ADCtest-ADCretest|/(ADCtest + ADCretest)] were recorded and calculated for each ROI. The ADC values (test sequences) and TRV of all ROIs/ ROIs in right lobe/ ROIs in left lobe/ ROIs near liver edge/ ROIs near liver center/ ROIs near right edge/right center/left edge/left center in different ADC maps were compared using a paired t-test.
Results
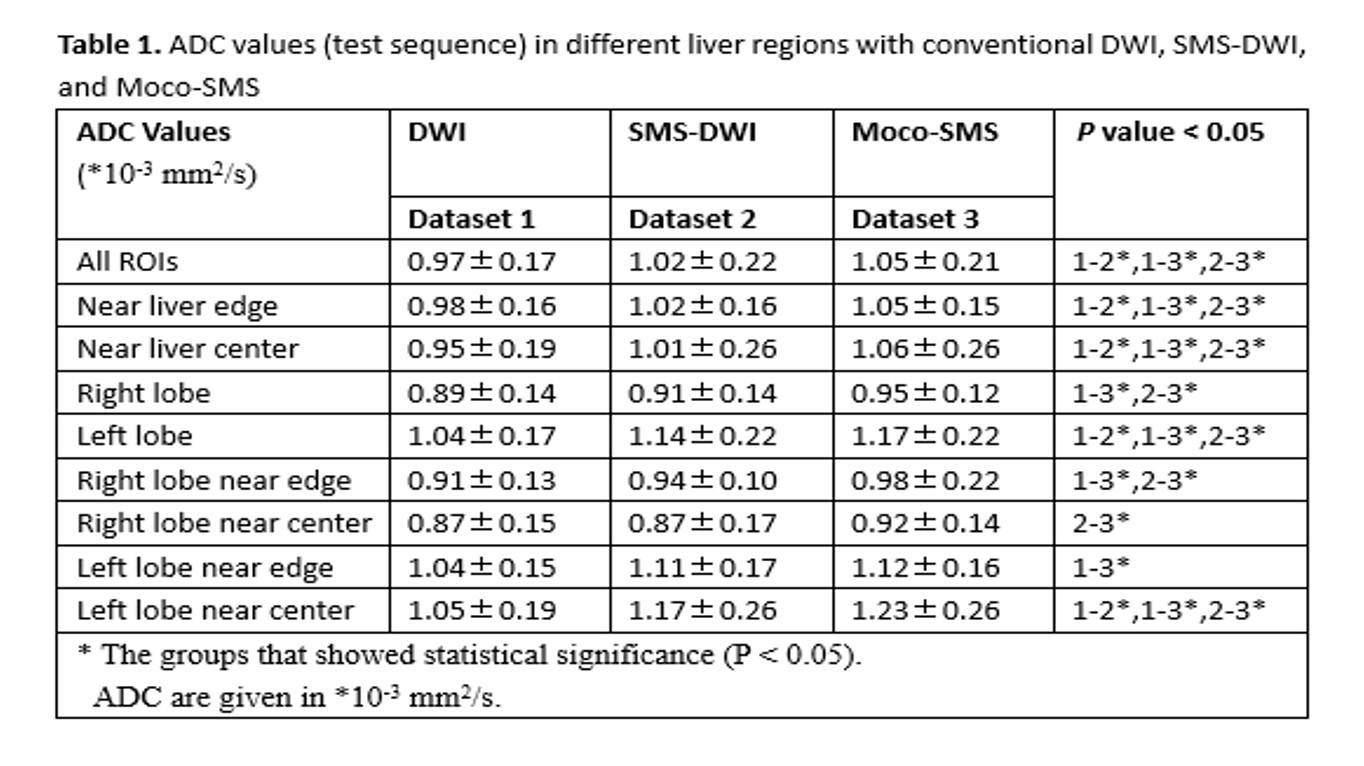
The ADC values of different datasets are shown in Table 1. ADC showed significant differences between DWI and SMS-DWI, DWI and Moco-SMS, SMS-DWI and Moco-SMS when analyzing all ROIs, ROIs near liver edge, ROIs near liver center, and ROIs in left hepatic lobe. Conventional DWI presented the lowest ADC value and Moco-SMS obtained the highest. When analyzing right liver lobe, significant differences were found between DWI and Moco-SMS as well as SMS-DWI and Moco-SMS. The TRV in different datasets are shown in Table 2. The TRV of Moco-SMS was significantly smaller than that of conventional DWI when analyzing ROIs which were located near liver edges, and in right lobe edges (9.1±9.3% V.S 13.2±10.2%, 7.3±6.5% V.S 11.6±8.2).Discussion
Our results showed that the ADC value is significantly different between conventional DWI, SMS-DWI and Moco-SMS in almost all liver regions (near liver edge or center, right or left hepatic lobe). These findings indicate that the ADC value may not be comparable when using different scanning protocols. Thus, it might be better to use the same DWI protocol during follow-up examination. Moco-SMS showed significantly smaller TRV than conventional DWI in area near liver edges, while no significant differences were found between the other datasets and in other liver regions. These findings suggest that the SMS-DWI with elastic in-plane motion correction has better reliability especially in the areas most likely affected by motion.Conclusion
SMS-DWI and Moco-SMS demonstrated significantly higher ADC values than conventional DWI in almost all liver regions. Moco-SMS showed better TRV than conventional DWI in regions near liver edges, and regions near edges in the right lobe.Acknowledgements
No acknowledgement found.References
1. Deckers F, De Foer B, Van Mieghem F, et al. Apparent diffusion coefficient measurements as very early predictive markers of response to chemotherapy in hepatic metastasis: a preliminary investigation of reproducibility and diagnostic value. Journal of magnetic resonance imaging : JMRI, 2014,40(2):448-456.
2. Pathak R, Ragheb H, Thacker NA, et al. A data-driven statistical model that estimates measurement uncertainty improves interpretation of ADC reproducibility: a multi-site study of liver metastases. Scientific reports, 2017,7(1):14084.
3. Taron J, Martirosian P, Erb M, et al. Simultaneous multislice diffusion-weighted MRI of the liver: Analysis of different breathing schemes in comparison to standard sequences. Journal of magnetic resonance imaging : JMRI, 2016,44(4):865-879.
4. Boss A, Barth B, Filli L, et al. Simultaneous multi-slice echo planar diffusion weighted imaging of the liver and the pancreas: Optimization of signal-to-noise ratio and acquisition time and application to intravoxel incoherent motion analysis. European journal of radiology, 2016,85(11):1948-1955.
Figures