4612
Contrast-enhanced MR Imaging 3D texture analyses as a potential tool for preoperative prediction of microvascular invasion in hepatocellular carcinoma: Comparison with postoperative pathology1Department Of Imaging Diagnosis, National Cancer Center / Cancer Hospital, Chinese Academy of Medical Sciences & Peking Union Medical College, Beijing, China, 2GE healthcare, China, Beijing, China
Synopsis
Microvascular invasion (MVI) is a significant risk factor contributing to high recurrence ratio and poor prognosis of hepatocellular carcinoma (HCC). Therefore, it is of great clinical significance to accurately predict MVI of HCC preoperatively. Texture analyses (TA) is a novel image post-processing technique, which analyze the distribution and associations of pixel intensities in images with a series of quantitative texture parameters. However, there was limited report on applying TA on MVI of HCC . The purpose of this study was to explore the value of contrast enhanced MRI texture analyses in the preoperative prediction of MVI of HCC preoperative.
Purpose
To investigate the application of contrast enhanced MR imaging (MRI) TA in predicting the microvascular invasion (MVI) status of hepatocellular carcinoma (HCC) preoperatively.Materials and Methods
One hundred and forty-two pathologically confirmed patients were enrolled in the current study and were classified into MVI positive (MP, n=53) and MVI negative (MN, n=89) groups. They were also divided into two cohorts, including the training cohort (n=99) and validation cohort (n=43). Training cohort was designated for training the predictive model, while the validation cohort was designated for the accuracy evaluation of the predictive model. All the patients underwent contrast enhanced MR examination on a 3.0T MRI system (Discovery MR 750 3.0 T, GE Medical Systems, Milwaukee, WI, USA) prior to operation. The images of arterial phase (AP) and portal-venous phase (PP) were acquired and used for TA. A 3D volume of interest (VOI) of the tumor was generated using an in-house developed software, namely as Omni-kinetics (OK) (GE Healthcare, Life Science, China). A total number of 58 texture features were automatically extracted on OK . The texture features can be classified into four categories: 29 Histogram features, 8 gray level co-occurrence matrix (GLCM) features, 11 Haralick features, and 10 run-length matrix (RLM) features. For the clinical-radiologic features, the Student’s t-test, Kruskal-Wallis test and Pearson’s χ2 test were used to compare the MVI positive and negative groups. For the texture parameters, firstly, independent t-test or Kruskal-Wallis test was applied in texture features. Then, features demonstrated significant difference (P<0.05) were further screened using univariate logistic regression. As well, the features in univariate logistic regression analyses with P<0.05 were selected. The remaining features after adjusting redundancy were entered into model building, where multivariate logistic regression analyses were applied. The model of texture features was obtained by a directly enter mode. The texture signature score (Texscore) were calculated for each patient based on the selected features and corresponding coefficients. Thereafter, the combined model with clinical features showed significant difference (P<0.05), and Texscore were generated by multivariate logistic regression in both AP and PP. The performance of each model was analyzed for both training and validation cohorts through receiver operating characteristic curve (ROC) analysis.Results
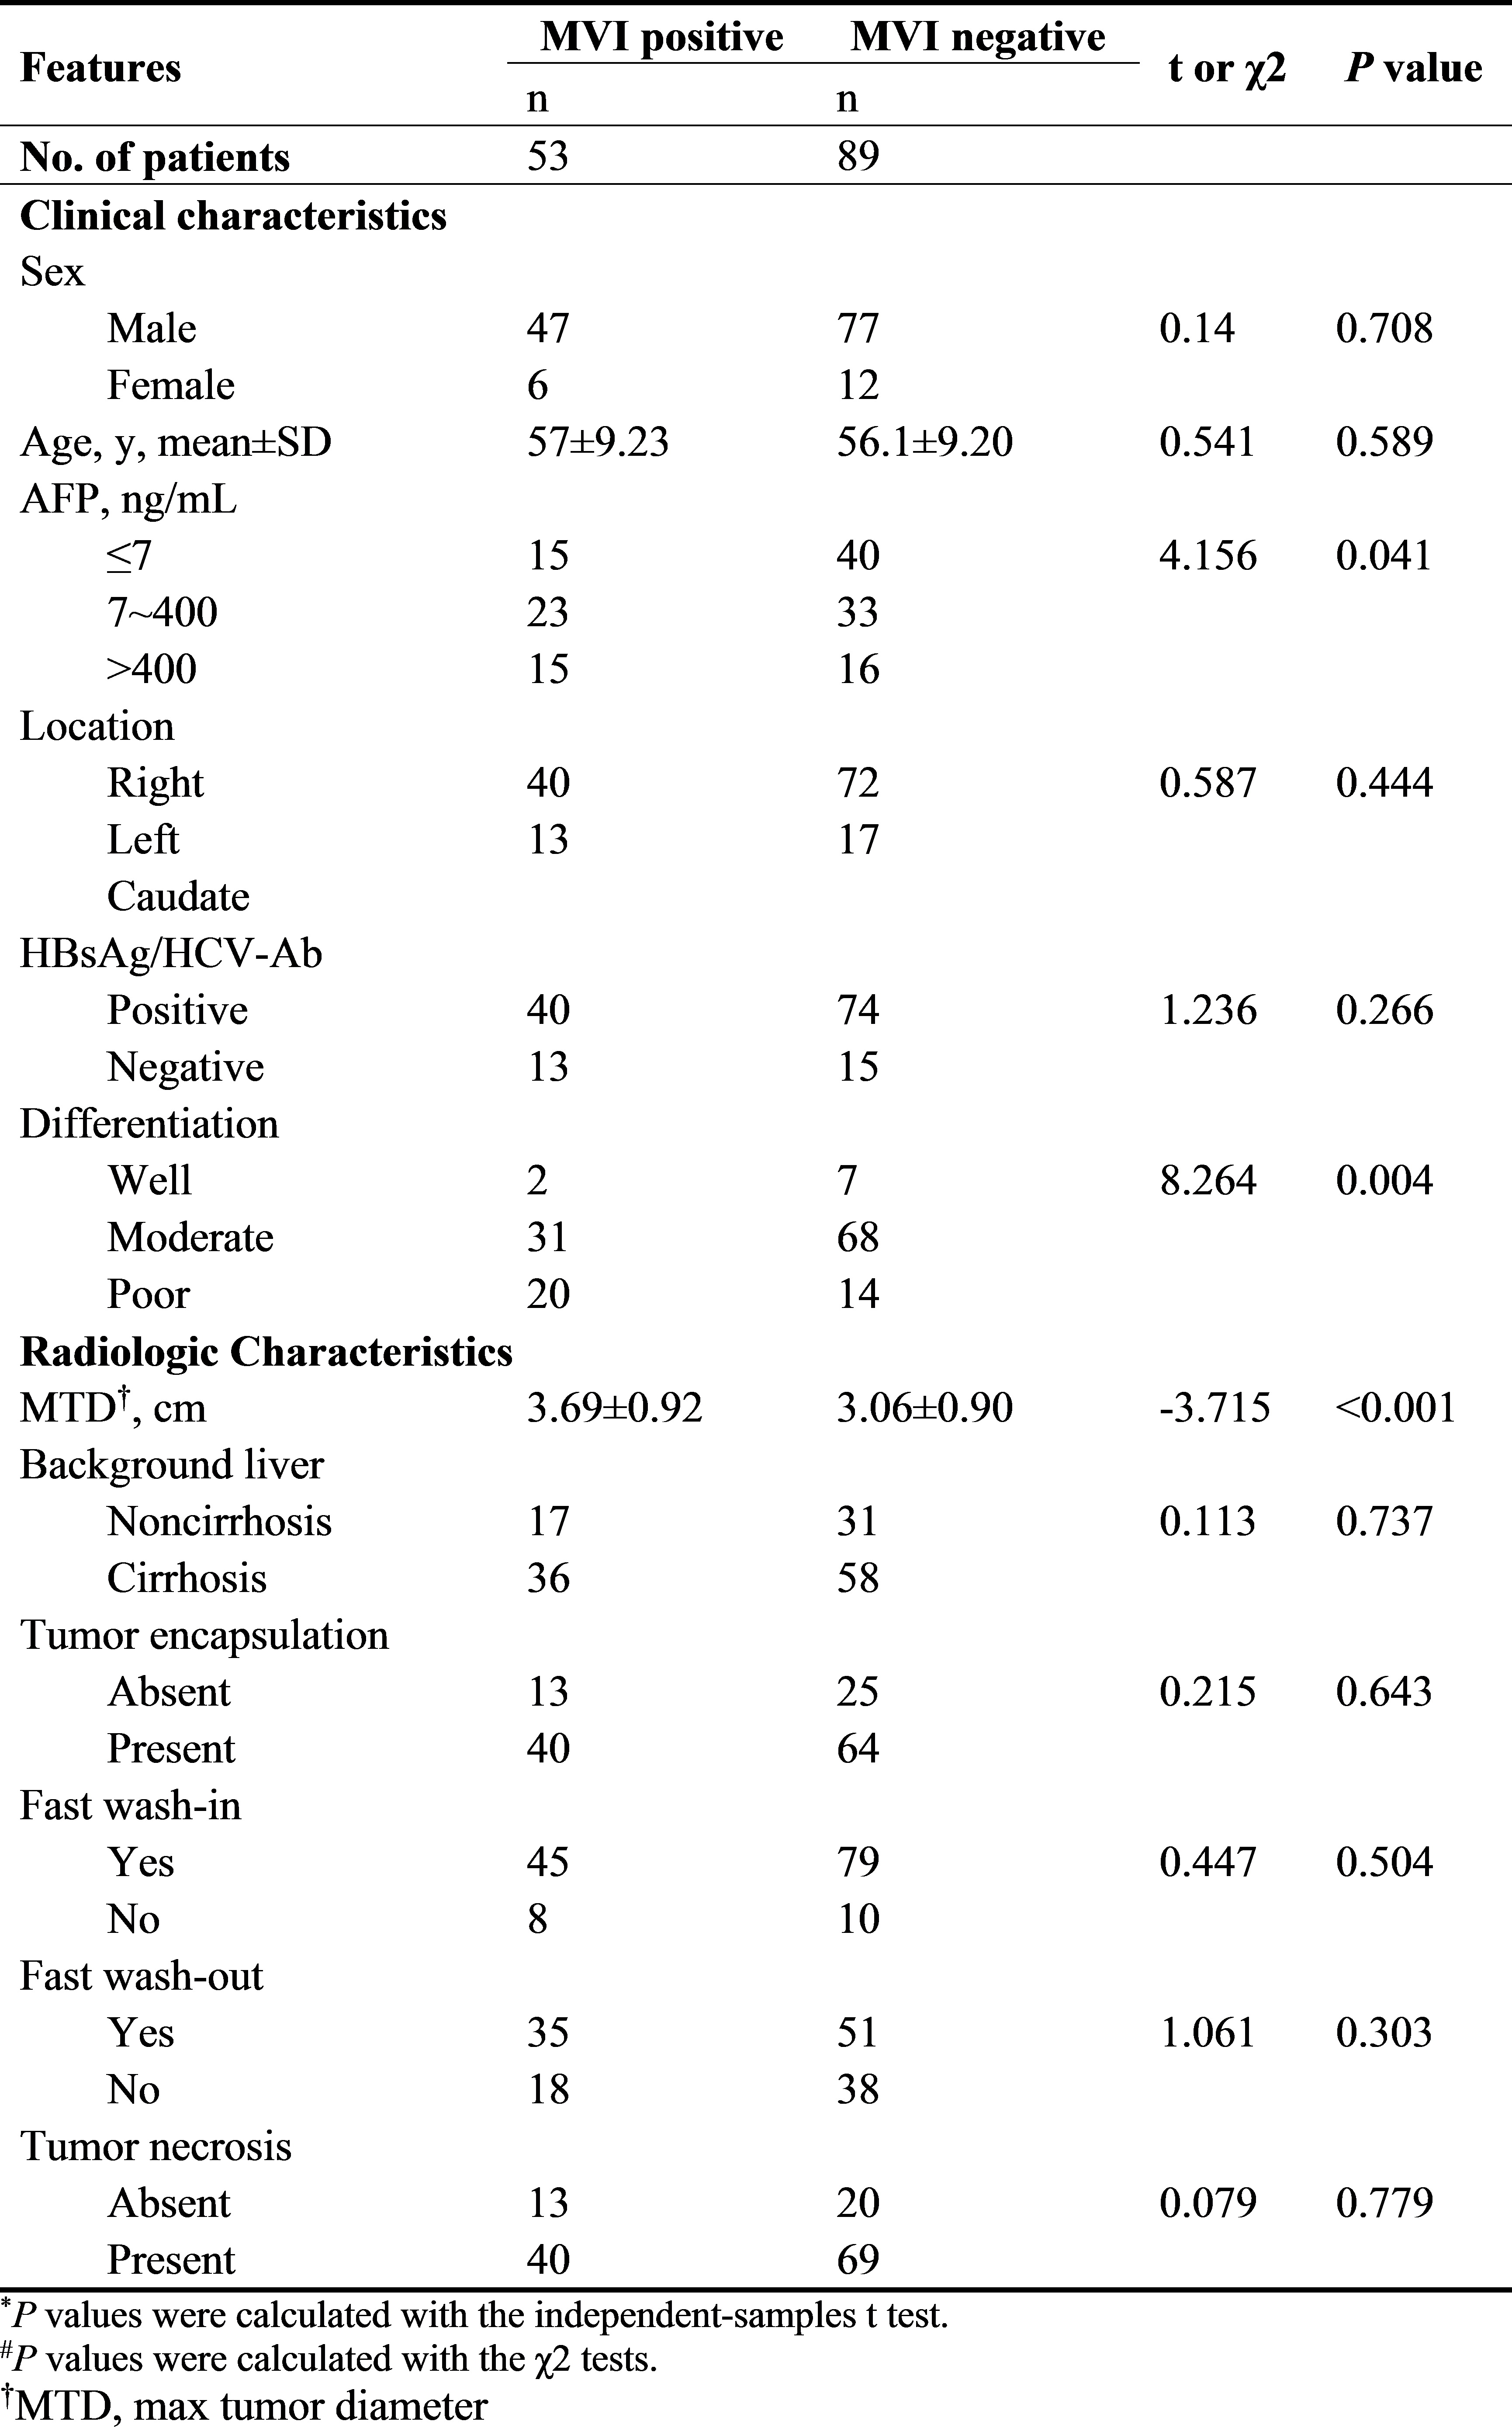
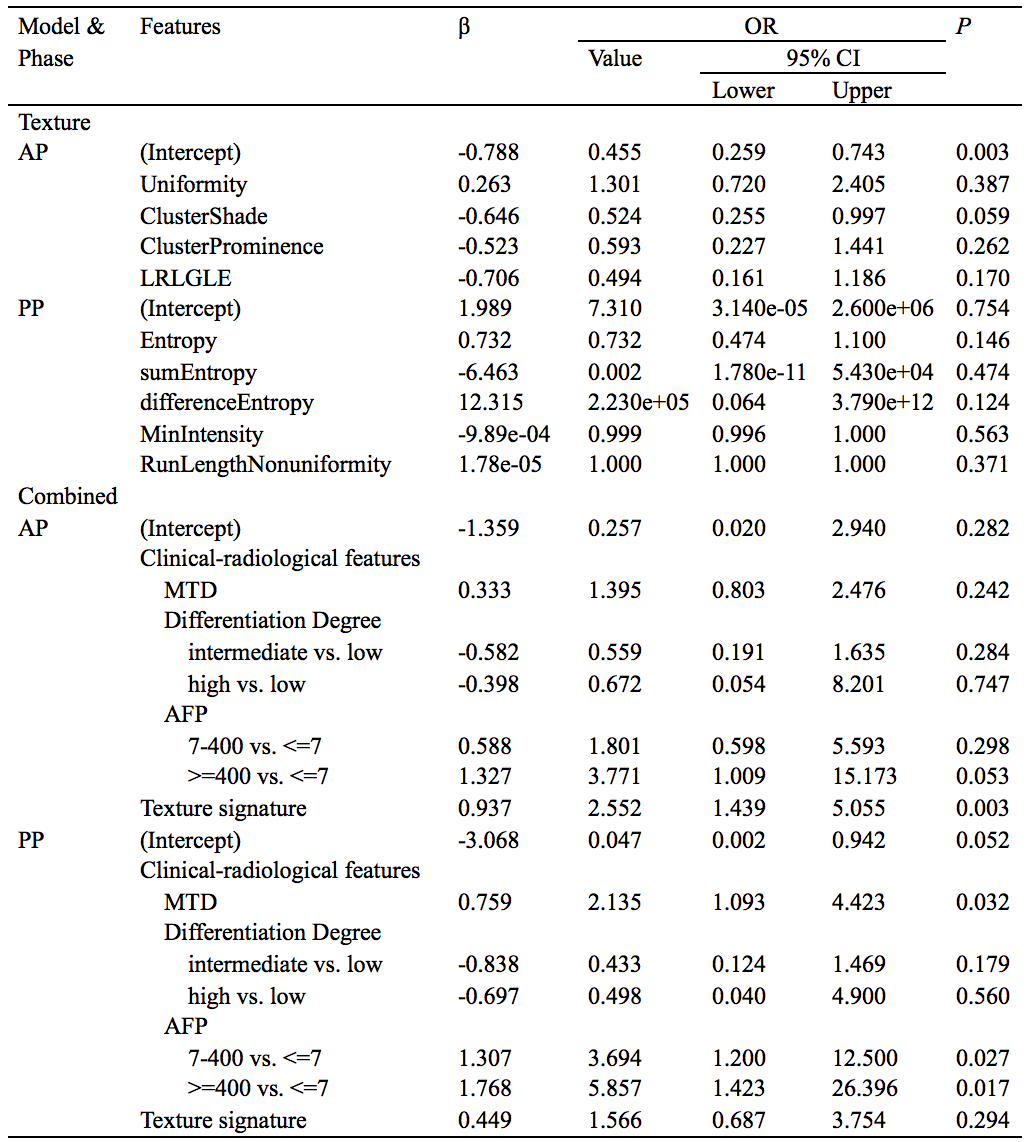
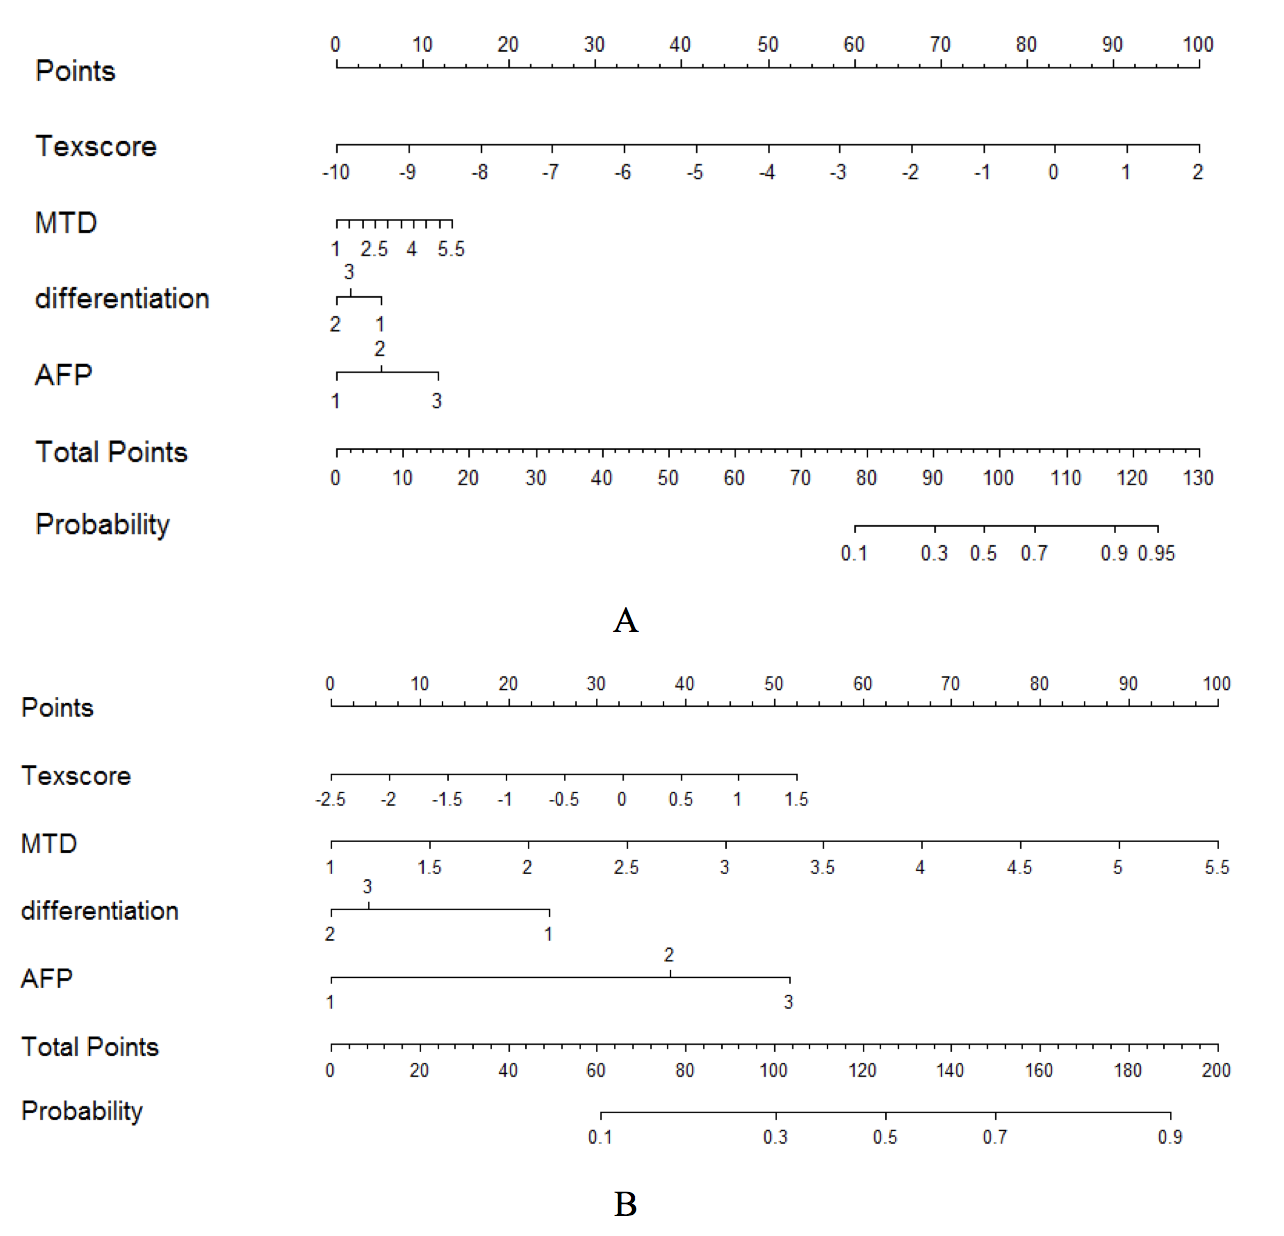
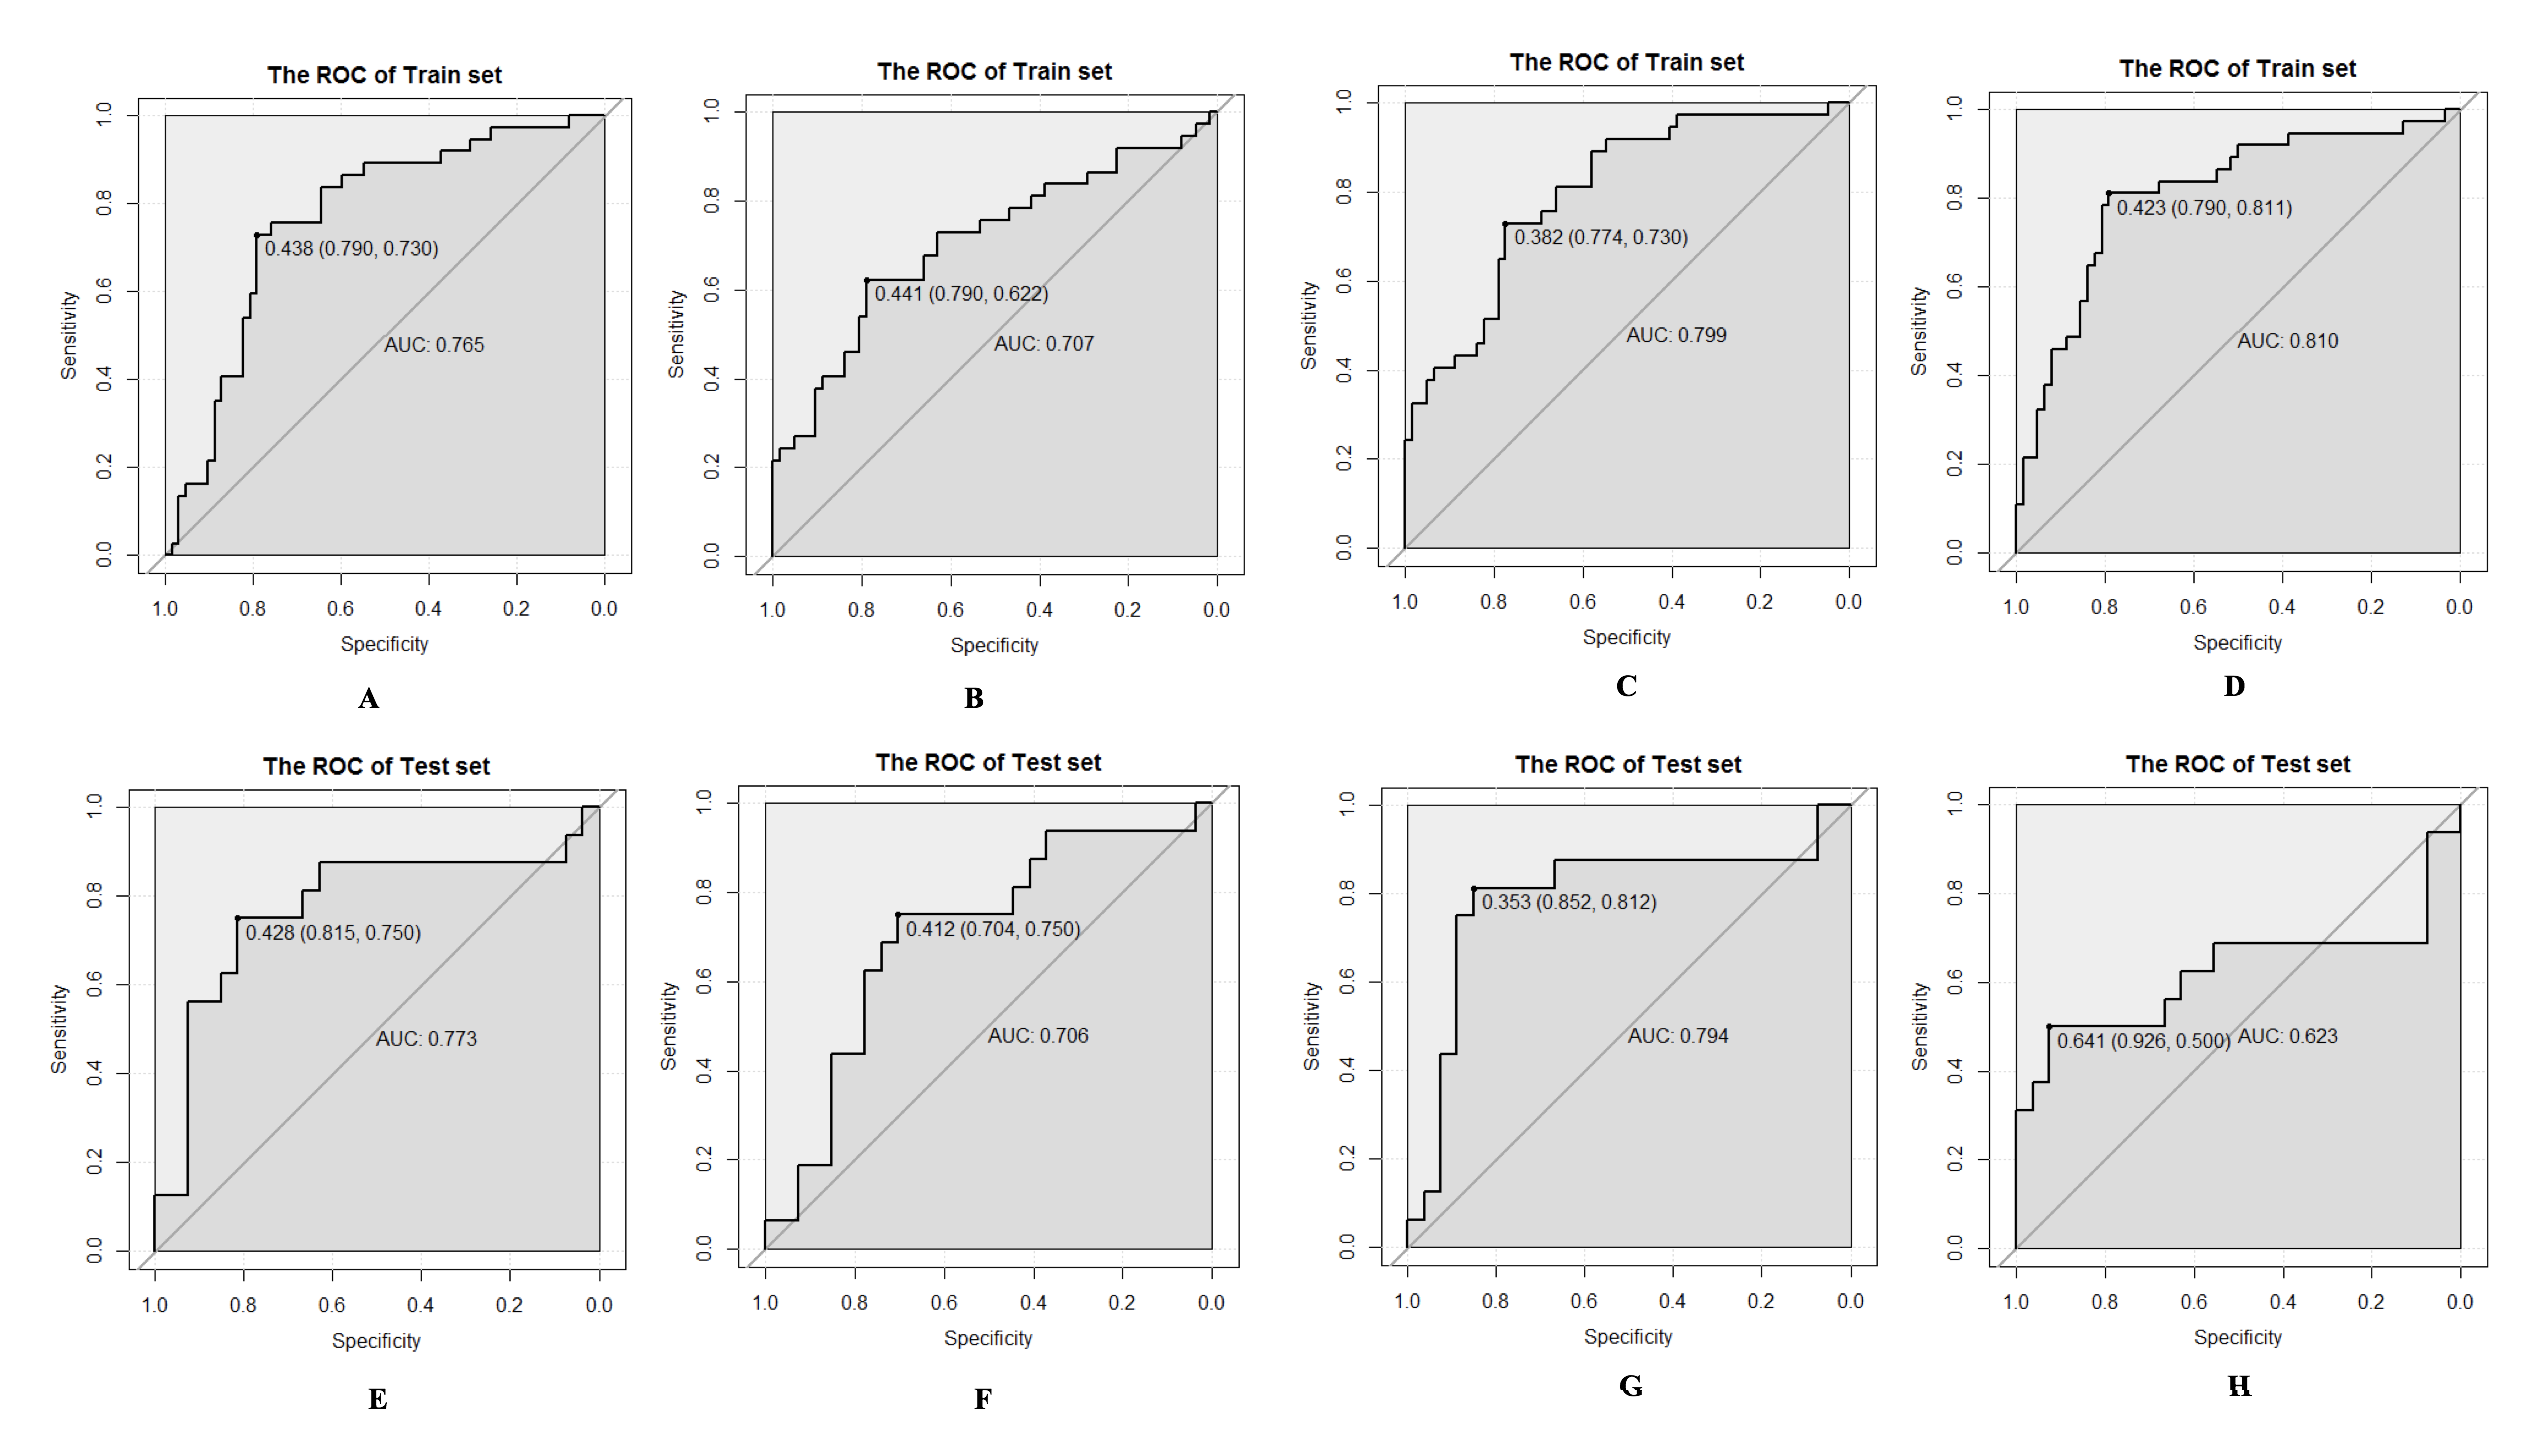
In the clinical-radiological features, significant inter-group difference was observed in max tumor diameter (MTD) (P<0.001), tumor differentiation (P=0.004) and AFP (P=0.041). Detailed clinical and radiologic characteristics of the patients in MVI positive and negative group were demonstrated in Table 1. Four MR texture parameters in AP and five in PP were entered into the multivariate logistic regression to build the texture model (Table 2). The nomograms integrating the parameters involved in multivariate logistic regression were displayed in Figure 1. C-indices of the nomograms for MVI predictions in AP and PP were 0.810 (95 % CI: 0.718-0.9019) and 0.799 (95 % CI: 0.710-0.889), respectively. Along with clinical features, ROC analyses indicated that the combined model in AP showed a better diagnostic performance than that of PP (Table 3), with AUC of 0.810 vs 0.799, accuracy of 0.798 vs 0.758, sensitivity of 0.811 vs 0.730, and specificity 0.790 vs 0.774, respectively. The ROC curves of the models were demonstrated in Figure 2.Discussion
MVI is a major risk factor for the recurrence and poor prognosis in HCC. Accurate prediction of MVI preparation noninvasive is of great clinical importance. Recently, TA was widely used in clinical studies. But the role of MRI TA in predicting the MVI in HCC has yet to be reported. In this study, the contrast enhanced MRI texture analyses of AP and PP images were used to build model for predicting MVI status. After univariate logistic regression analyses, 4 texture parameters in AP and 5 in PP were entered for the multivariate logistic regression analyses. Each of these features reflected the heterogeneity of an image from a unique perspective, and thus, were related to tumor heterogeneity from a clinical point of view. In the ROC analyses, the combined model showed better predictive performance than texture model on training cohort. The predictive ability was better in AP than that in PP, where consistent result were observed in the validation cohort.Conclusion
Contrast enhanced MR image texture analyses can pre-operatively and noninvasively predict MVI of HCC, and the combined model in arterial phase demonstrates promising diagnosis accuracy.Acknowledgements
No acknowledgement found.References
[1] Rodríguez-Perálvarez M, Luong TV, Andreana L, et al. A systematic review of microvascular invasion in hepatocellular carcinoma: diagnostic and prognostic variability. Ann Surg Oncol. 2013 Jan;20(1):325-39. doi: 10.1245/s10434-012-2513-1. Epub 2012 Nov 13.
[2] Chou CT, Chen RC, Lin WC, et al. Prediction of microvascular invasion of hepatocellular carcinoma: preoperative CT and histopathologic correlation. AJR Am J Roentgenol. 2014 Sep;203(3):W253-9. doi: 10.2214/AJR.13.10595.
[3] Yang C, Wang H, Sheng R, et al. Microvascular invasion in hepatocellular carcinoma: is it predictable with a new, preoperative application of diffusion-weighted imaging? Clin Imaging. 2017 Jan - Feb;41:101-105. doi: 10.1016/j.clinimag.2016.10.004. Epub 2016 Oct 17.
[4] Castellano G, Bonilha L, Li LM, Cendes F. Texture analysis of medical images. Clin Radiol. 2004 Dec;59(12):1061-9.
[5] Scalco E, Rizzo G. Texture analysis of medical images for radiotherapy applications. Br J Radiol. 2017 Feb;90(1070):20160642. doi: 10.1259/bjr.20160642. Epub 2016 Nov 25.
[6] Giganti F, Antunes S, Salerno A, et al. Gastric cancer: texture analysis from multidetector computed tomography as a potential preoperative prognostic biomarker. Eur Radiol. 2017 May;27(5):1831-1839. doi: 10.1007/s00330-016-4540-y. Epub 2016 Aug 23.
[7] Alobaidli S, McQuaid S, South C, et al. The role of texture analysis in imaging as an outcome predictor and potential tool in radiotherapy treatment planning. Br J Radiol. 2014 Oct;87(1042):20140369. doi: 10.1259/bjr.20140369. Epub 2014 Jul 23.
[8] Lubner MG, Malecki K, Kloke J, et al. Texture analysis of the liver at MDCT for assessing hepatic fibrosis. Abdom Radiol (NY). 2017 Aug;42(8):2069-2078. doi: 10.1007/s00261-017-1096-5.
Figures