4611
Diffusion Kurtosis Imaging for Assessing the Therapeutic Response of Transcatheter Arterial Chemoembolization in Hepatocellular Carcinoma1Shandong Medical Imaging Research Institute, School of Medicine, Shandong University, Jinan, China, 2Philips Healthcare, Shanghai, China
Synopsis
Hepatocellular carcinoma (HCC) is one of the major causes of morbidity and mortality in patients with chronic liver disease. Transcatheter arterial chemoembolization (TACE) play an important role in treatment for HCC. Evaluation of the response to TACE treatment affects not only the therapeutic efficacy but also the treatment plan. Data from 43 patients with hepatic cancer between January 2017 and September 2017 were recruited for this study. Magnetic resonance imaging (MRI) and DKI (b=0, 800, 1500, 2000 mm2/s) were performed before and 3 weeks after initiating TACE. Contrast-enhanced MRI was performed 3 months and 6 months after initiating TACE. We observed a significant decrease in MK in HCC tissues that were completely necrotic after TACE. The MK value can reflect the complexity of tissue structure. A lower MK value indicates evidence of necrosis, implying more stable lesions and hence better treatment outcomes. Therefore, the differences in MK values observed in our study reflected the differences in tissue microstructural complexity between the progressing and non-progressing groups. The change of MK values before and after TACE can thus be used to estimate the degree of tumor necrosis and to further evaluate the effect of interventional therapy.
INTRODUCTION
Hepatocellular carcinoma (HCC) is one of the major causes of morbidity and mortality in patients with chronic liver disease. Transcatheter arterial chemoembolization (TACE) blocks the blood supply to cancerous lesions and induces ischemia and necrosis in the tumor tissue. Evaluation of the response to TACE treatment affects not only the therapeutic efficacy but also the treatment plan. It has been known that diffusion kurtosis imaging (DKI) can be used provide information about tissue heterogeneity and irregularity. The viable and necrotic areas of HCC after TACE can be distinguished from the surroundings based mean kurtosis (MK) values obtained from DKI. The MK values thus play an important role in evaluating the therapeutic effect of TACE for HCC.METHODS
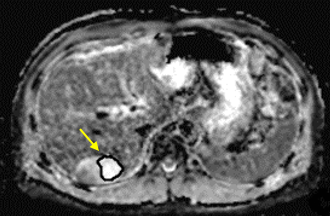
To compare DKI with conventional diffusion-weighted imaging (DWI) for the application of assessing the therapeutic effect of TACE in HCC. Data from 43 patients (31 males, 12 females; median age, 57.8 years; range, 25–77 years) with hepatic cancer between January 2017 and September 2017 were recruited for this study. Magnetic resonance imaging (MRI) and DKI (b=0, 800, 1500, 2000 mm2/s) were performed before and 3 weeks after initiating TACE. Contrast-enhanced MRI was performed 3 months and 6 months after initiating TACE. Patients were classified as either progressing or non-progressing according to morphological features (size change, metastasis, Microvascular invasion, etc.) and enhancement features (enhancement degree, enhancement curve, etc.). Mean kurtosis (MK), mean diffusion (MD) and apparent diffusion coefficient (ADC) values of the tumor tissue before and 3 weeks after TACE were analyzed using paired t-tests in both progressing and non-progressing groups.RESULTS
27 patients were classified as progressing, and 16 non-progressing. There was no significant difference in the preoperative MK, MD and ADC values of tumor between the progressing and non-progressing groups. After TACE, the MK, MD and ADC values of normal hepatic parenchyma showed no evident changes when compared to the preoperative values. The MK value of tumor among non-progressing patients decreased 3 weeks after TACE (mean ± SD, 0.58 ± 0.15) relative to the preoperative value (mean ± SD, 0.77± 0.13). There was a significant difference between the 2 groups (P<0.05). In the non-progressing group, the MD and ADC values of tumor became higher than their preoperative values (P<0.05). In the progressing group, the MK, MD and ADC values of tumor remained similar before and 3 weeks after TACE(P>0.05). After TACE, there was a significant difference in the MK, MD and ADC values of tumor between the progressing and non-progressing groups. The increase of the MK values in the progressing group was significantly greater that observed in the non-progressing group (p < 0.05). And the decrease of the MD and ADC values in the progressing group was also more significant than that observed in the non-progressing group (p < 0.05). The sensitivity, specificity, and AUC of the ROC curve for the assessment of HCC progress after TACE were greater (p < 0.001) using MK (85.2%, 97.5%, and 0.95, respectively; cutoff value = 0.720) than using ADC (78.6%, 66.5%, and 0.75, respectively; cutoff value = 1.478 ×10⁻³mm2/s). The sensitivity, specificity, and AUC of the ROC curve for the assessment of HCC progress after TACE were greater (p < 0.05) using MK (85.2%, 97.5%, and 0.95, respectively; cutoff value = 0.720) than using MD (76.2%, 64.3%, and 0.71, respectively; cutoff value = 1.521×10⁻³mm2/s).DISCUSSION
DKI assumes that the diffusion of water molecules in vivo is characterized as a non-Gaussian distribution due to the differences in structures and functions of local tissues and cells. The TACE procedure causes tumor cell apoptosis, necrosis, cell membrane rupture and nuclear dissolution, and thus changes the tissue structure. Necrotic HCC tissues lose their cellularity, usually develop coagulation necrosis, and contain the fewest diffusion barriers .We observed a significant decrease in MK in HCC tissues that were completely necrotic after TACE. The MK value can reflect the complexity of tissue structure. A lower MK value indicates evidence of necrosis, implying more stable lesions and hence better treatment outcomes. Therefore, the differences in MK values observed in our study reflected the differences in tissue microstructural complexity between the progressing and non-progressing groups. The change of MK values before and after TACE can thus be used to estimate the degree of tumor necrosis and to further evaluate the effect of interventional therapy.CONCLUSION
DKI shows great promise for assessing the therapeutic response of TACE in HCC.Acknowledgements
No acknowledgement found.References
1.Goshima S, Kanematsu M, Noda Y, Kondo H, Watanabe H, Bae KT. Diffusion kurtosis imaging to assess response to treatment in hypervascular hepatocellular carcinoma. AJR Am J Roentgenol 2015;204(5):W543–W549.
2.Yang K, Zhang XM, Yang L, Xu H, Peng J. Advanced imaging techniques in the therapeutic response of transarterial chemoembolization for hepatocellular carcinoma. World J Gastroenterology. 2016; 22(20): 4835–4847. pmid: 27239110
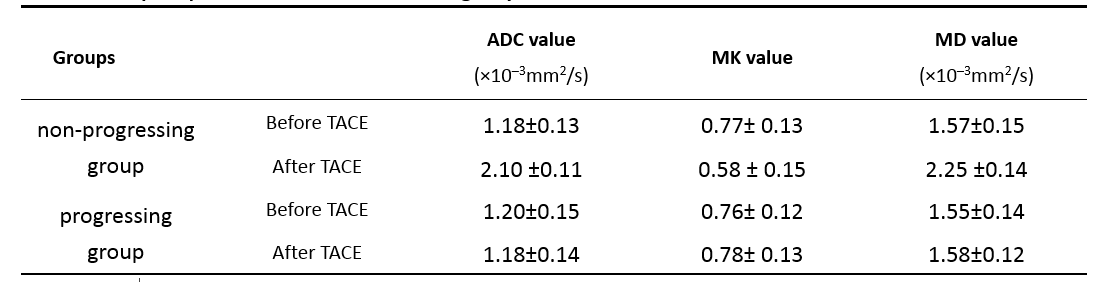
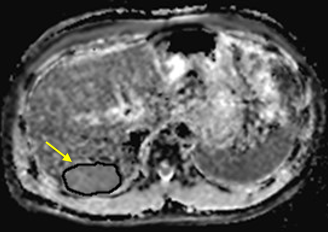
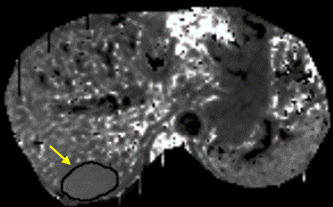
Figures