4610
Changes in HCC tumor stiffness post 90Yttrium radioembolization assessed with MR elastography: Early results.1Translational and Molecular Imaging Institute, Icahn School of Medicine at Mount Sinai Hospital, New York, NY, United States, 2Department of Radiology, Icahn School of Medicine at Mount Sinai Hospital, New York, NY, United States
Synopsis
The goal of the current study was to assess the changes in hepatocellular carcinoma (HCC) stiffness using 2D MR elastography (MRE) at baseline and 6 weeks after 90Yttrium radioembolization (RE). Preliminary results are presented in 10 patients and show that HCC stiffness and liver stiffness adjacent to the treated lesion are both significantly increased 6w after therapy. Percentage change in tumor stiffness is significantly correlated with degree of tumor necrosis at 6w.
Introduction
90Yttrium radioembolization (RE) is a locoregional therapy that may be used as a bridge to liver transplantation in patients with HCC or in advanced HCC. In this study we assess prospectively the effect of RE on the mechanical properties of the index treated lesions and the surrounding liver parenchyma by measuring tissue stiffness using MRE.Methods
In this preliminary IRB-approved single center study, MRE was performed on 13 prospectively enrolled cirrhotic patients (M/F 9/4, mean age 69y) before and approximately 6w after RE (12 segmental, 1 lobar) for HCC (mean interval between RE and post treatment MRI: 42.4±2.6 d). MRE was performed at 1.5T (Aera, Siemens) using a single breath hold axial 2D SE-EPI sequence. Data was reconstructed inline by a commercially available inversion algorithm1. The change in stiffness, measured as the magnitude of the complex shear modulus, |G*|, was assessed in the liver parenchyma away from the treated lobe/segment, liver parenchyma in the treated lobe/segment and the index lesion. A radiologist assessed treatment response at 6w by calculating degree of tumor necrosis on subtracted post-contrast T1 weighted VIBE images (after injection of gadoxetic acid, Eovist/Primovist, Bayer). Stiffness changes following RE were tested for significance using Wilcoxon signed-rank tests. Mann-Whitney U tests were used to determine the significance of within-subject differences in parenchyma and lesion stiffness. Spearman correlations were calculated between stiffness measurements and degree of tumor necrosis at 6w.Results
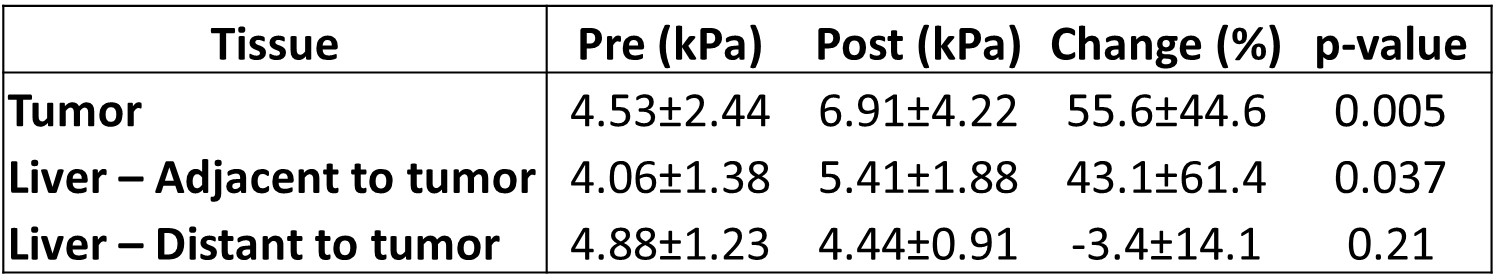
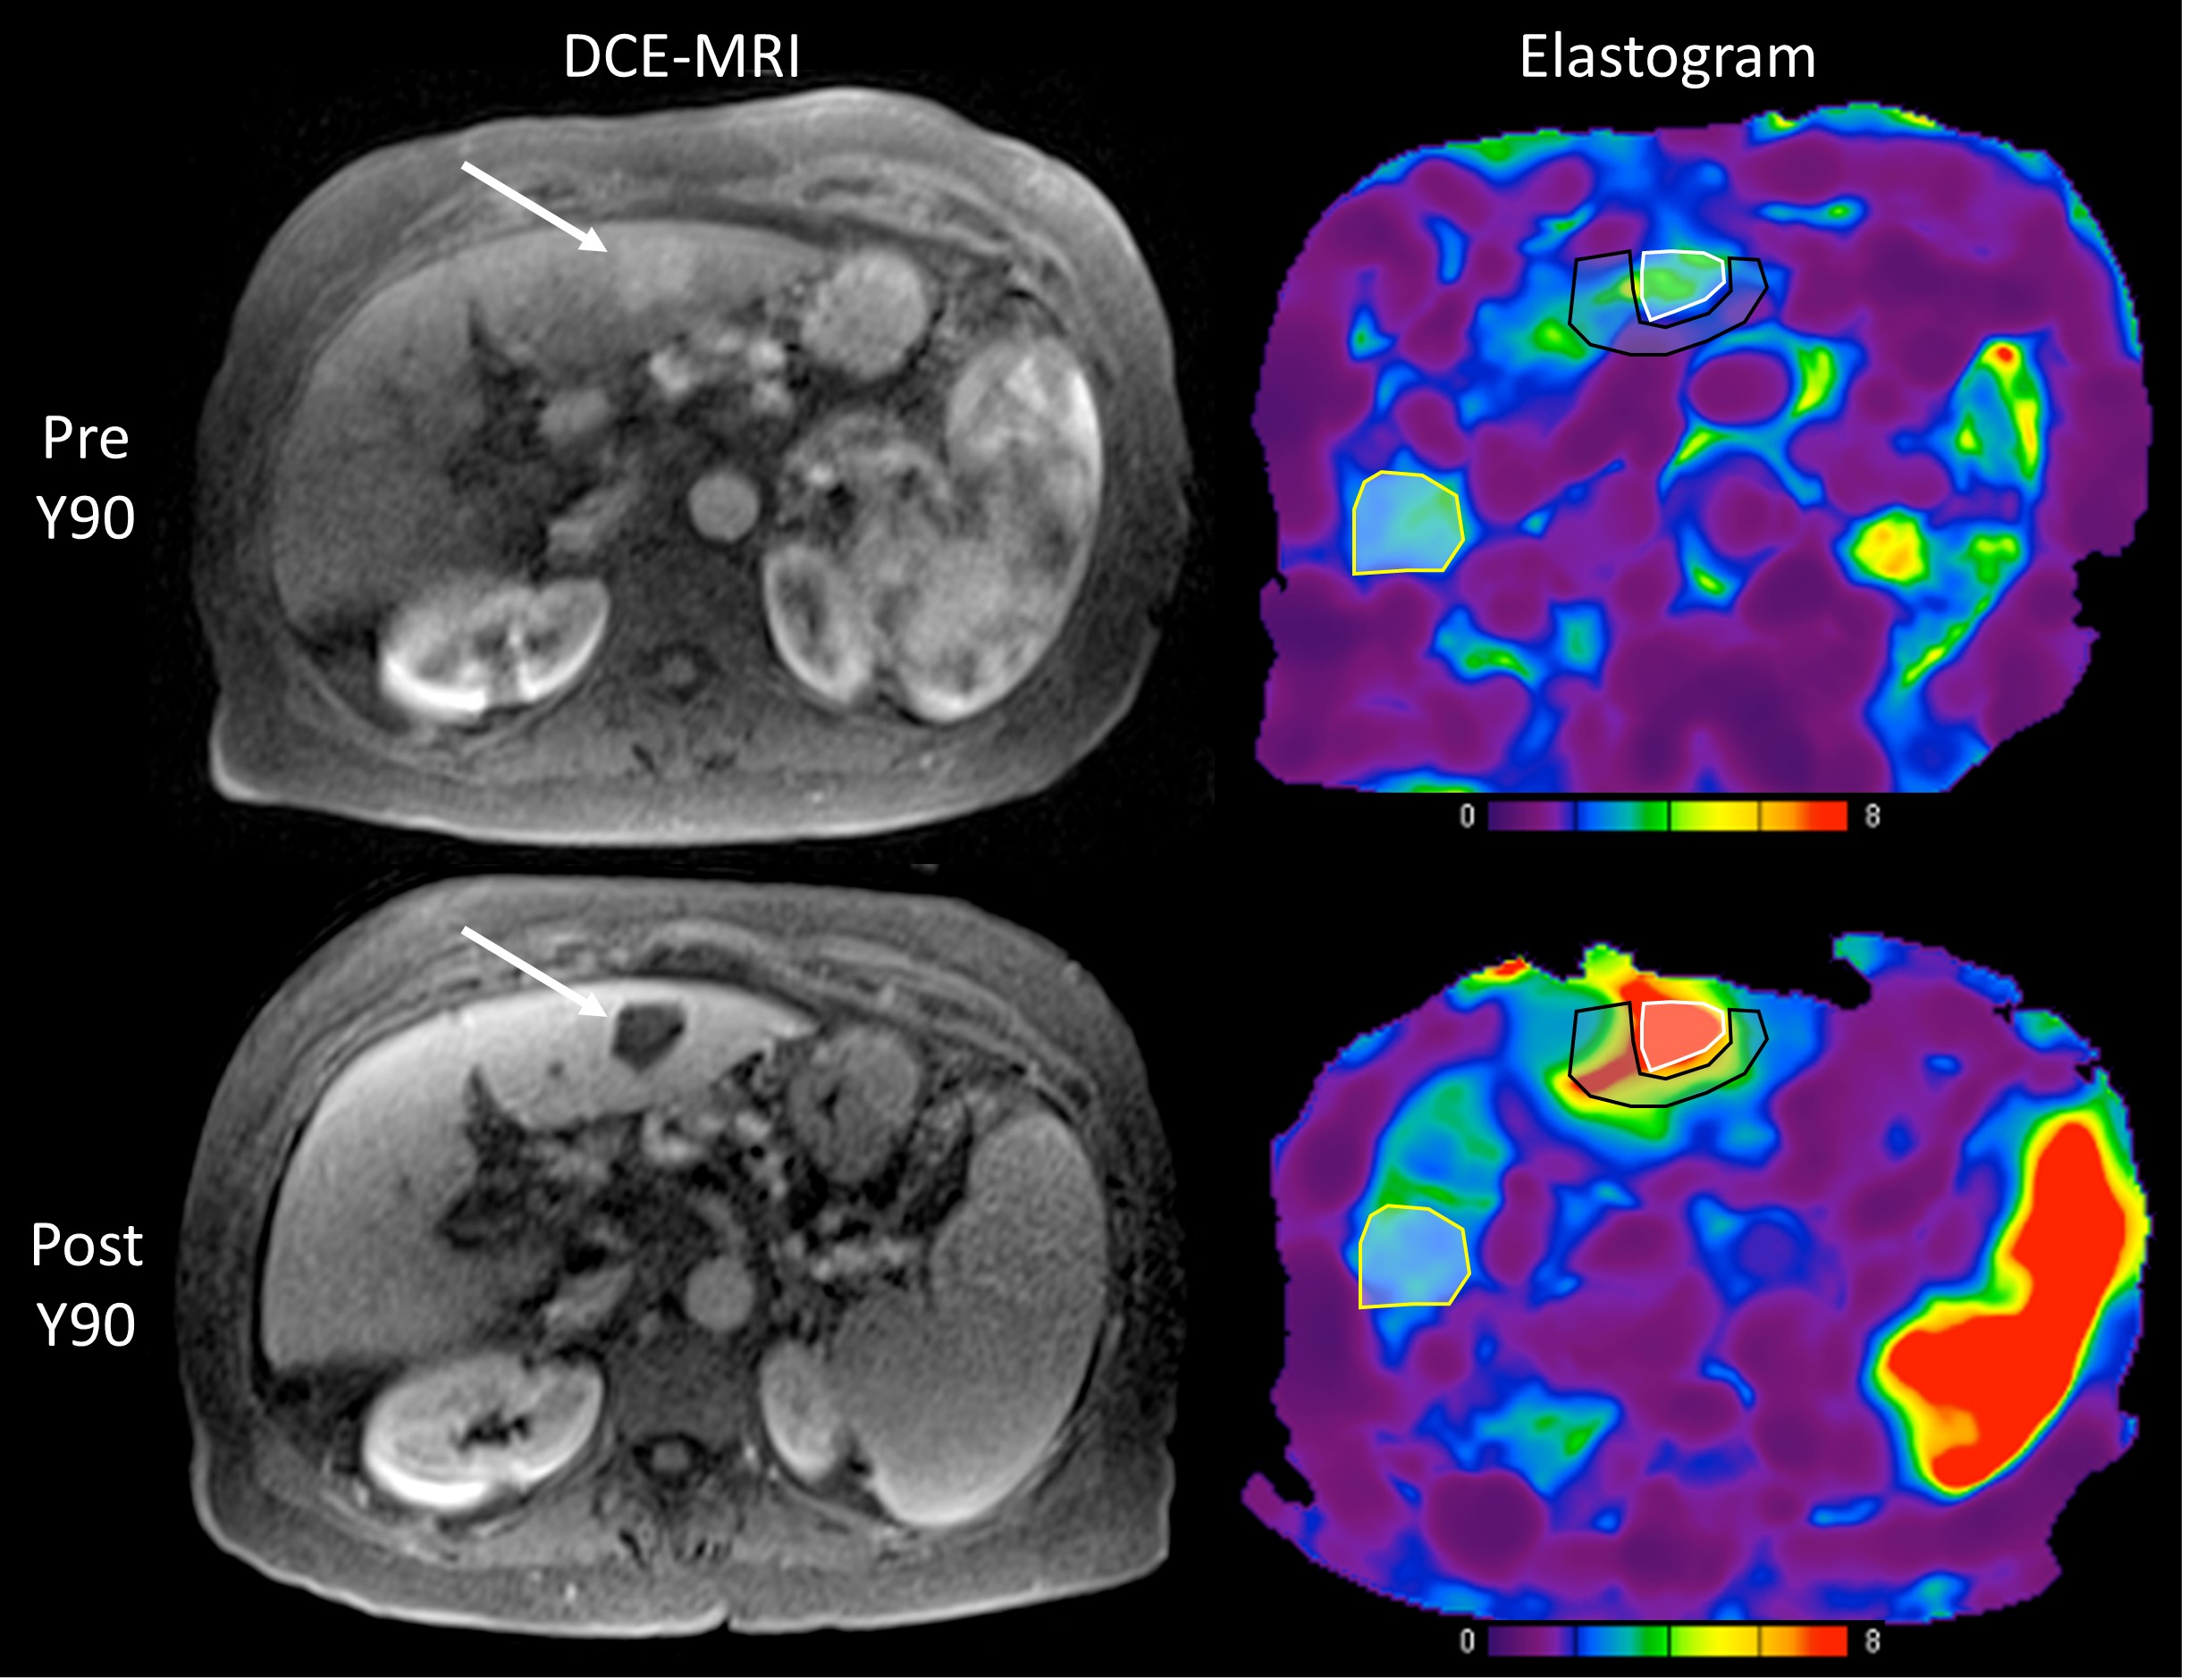
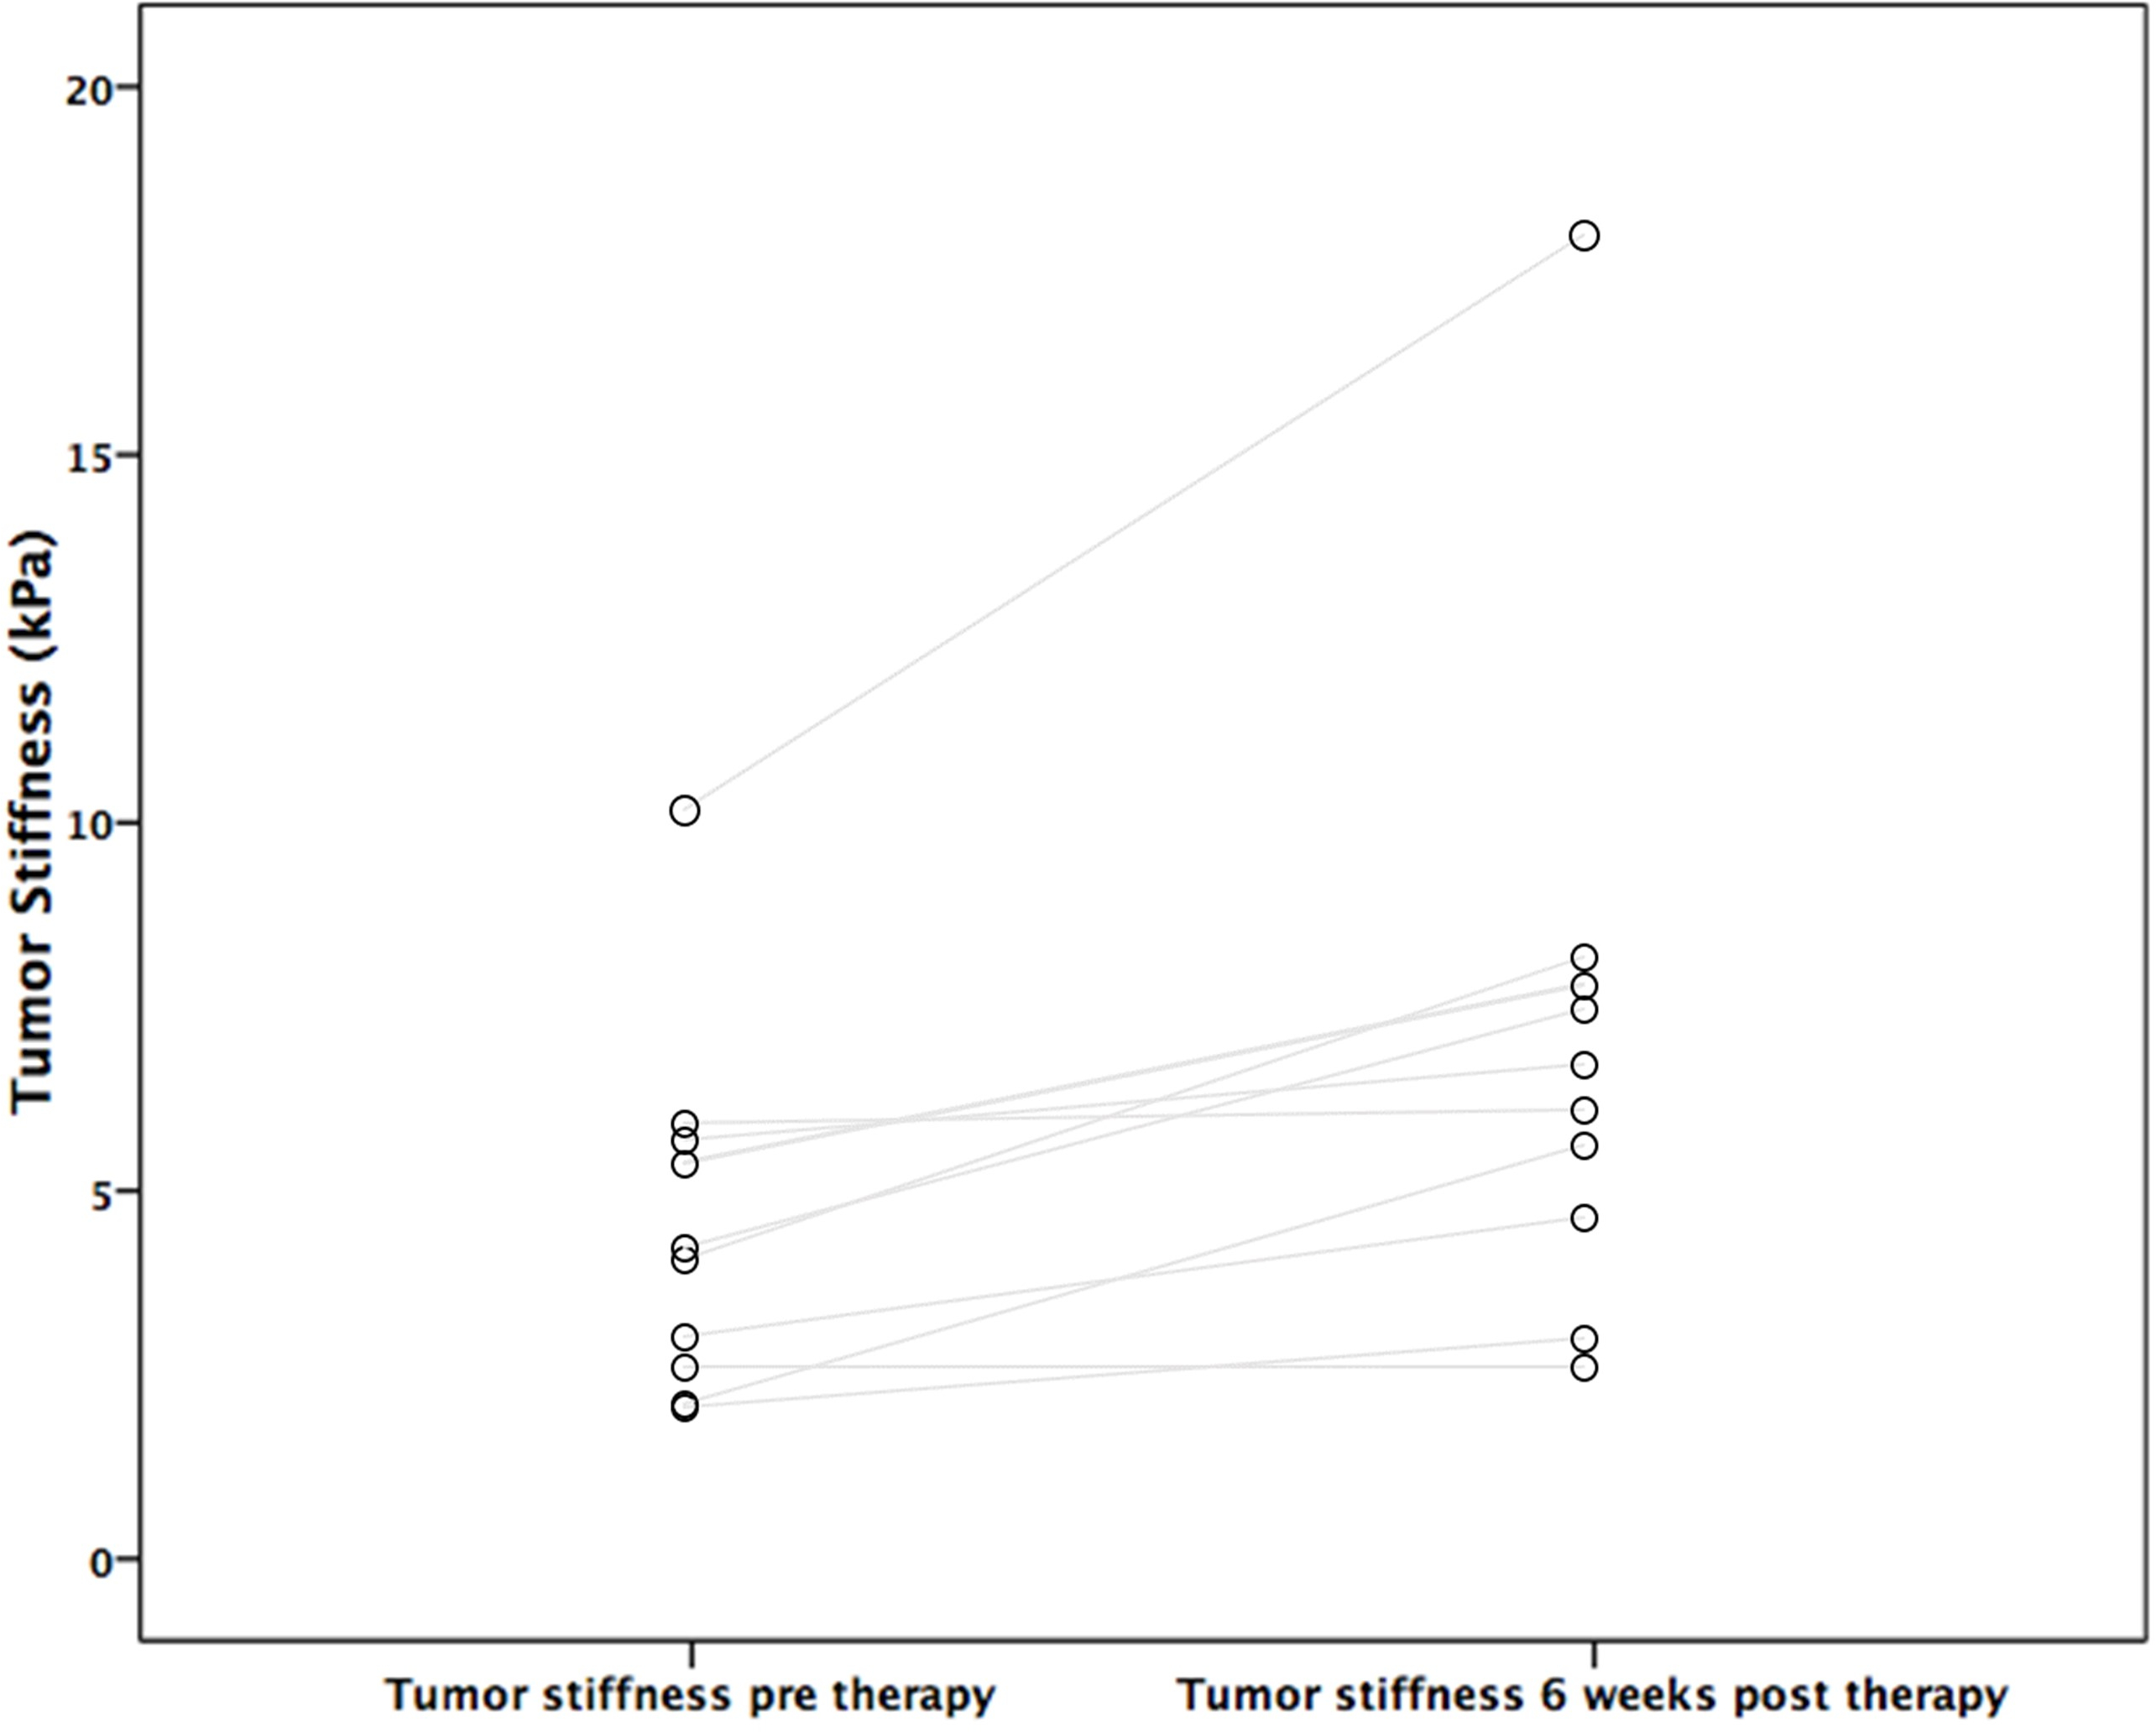
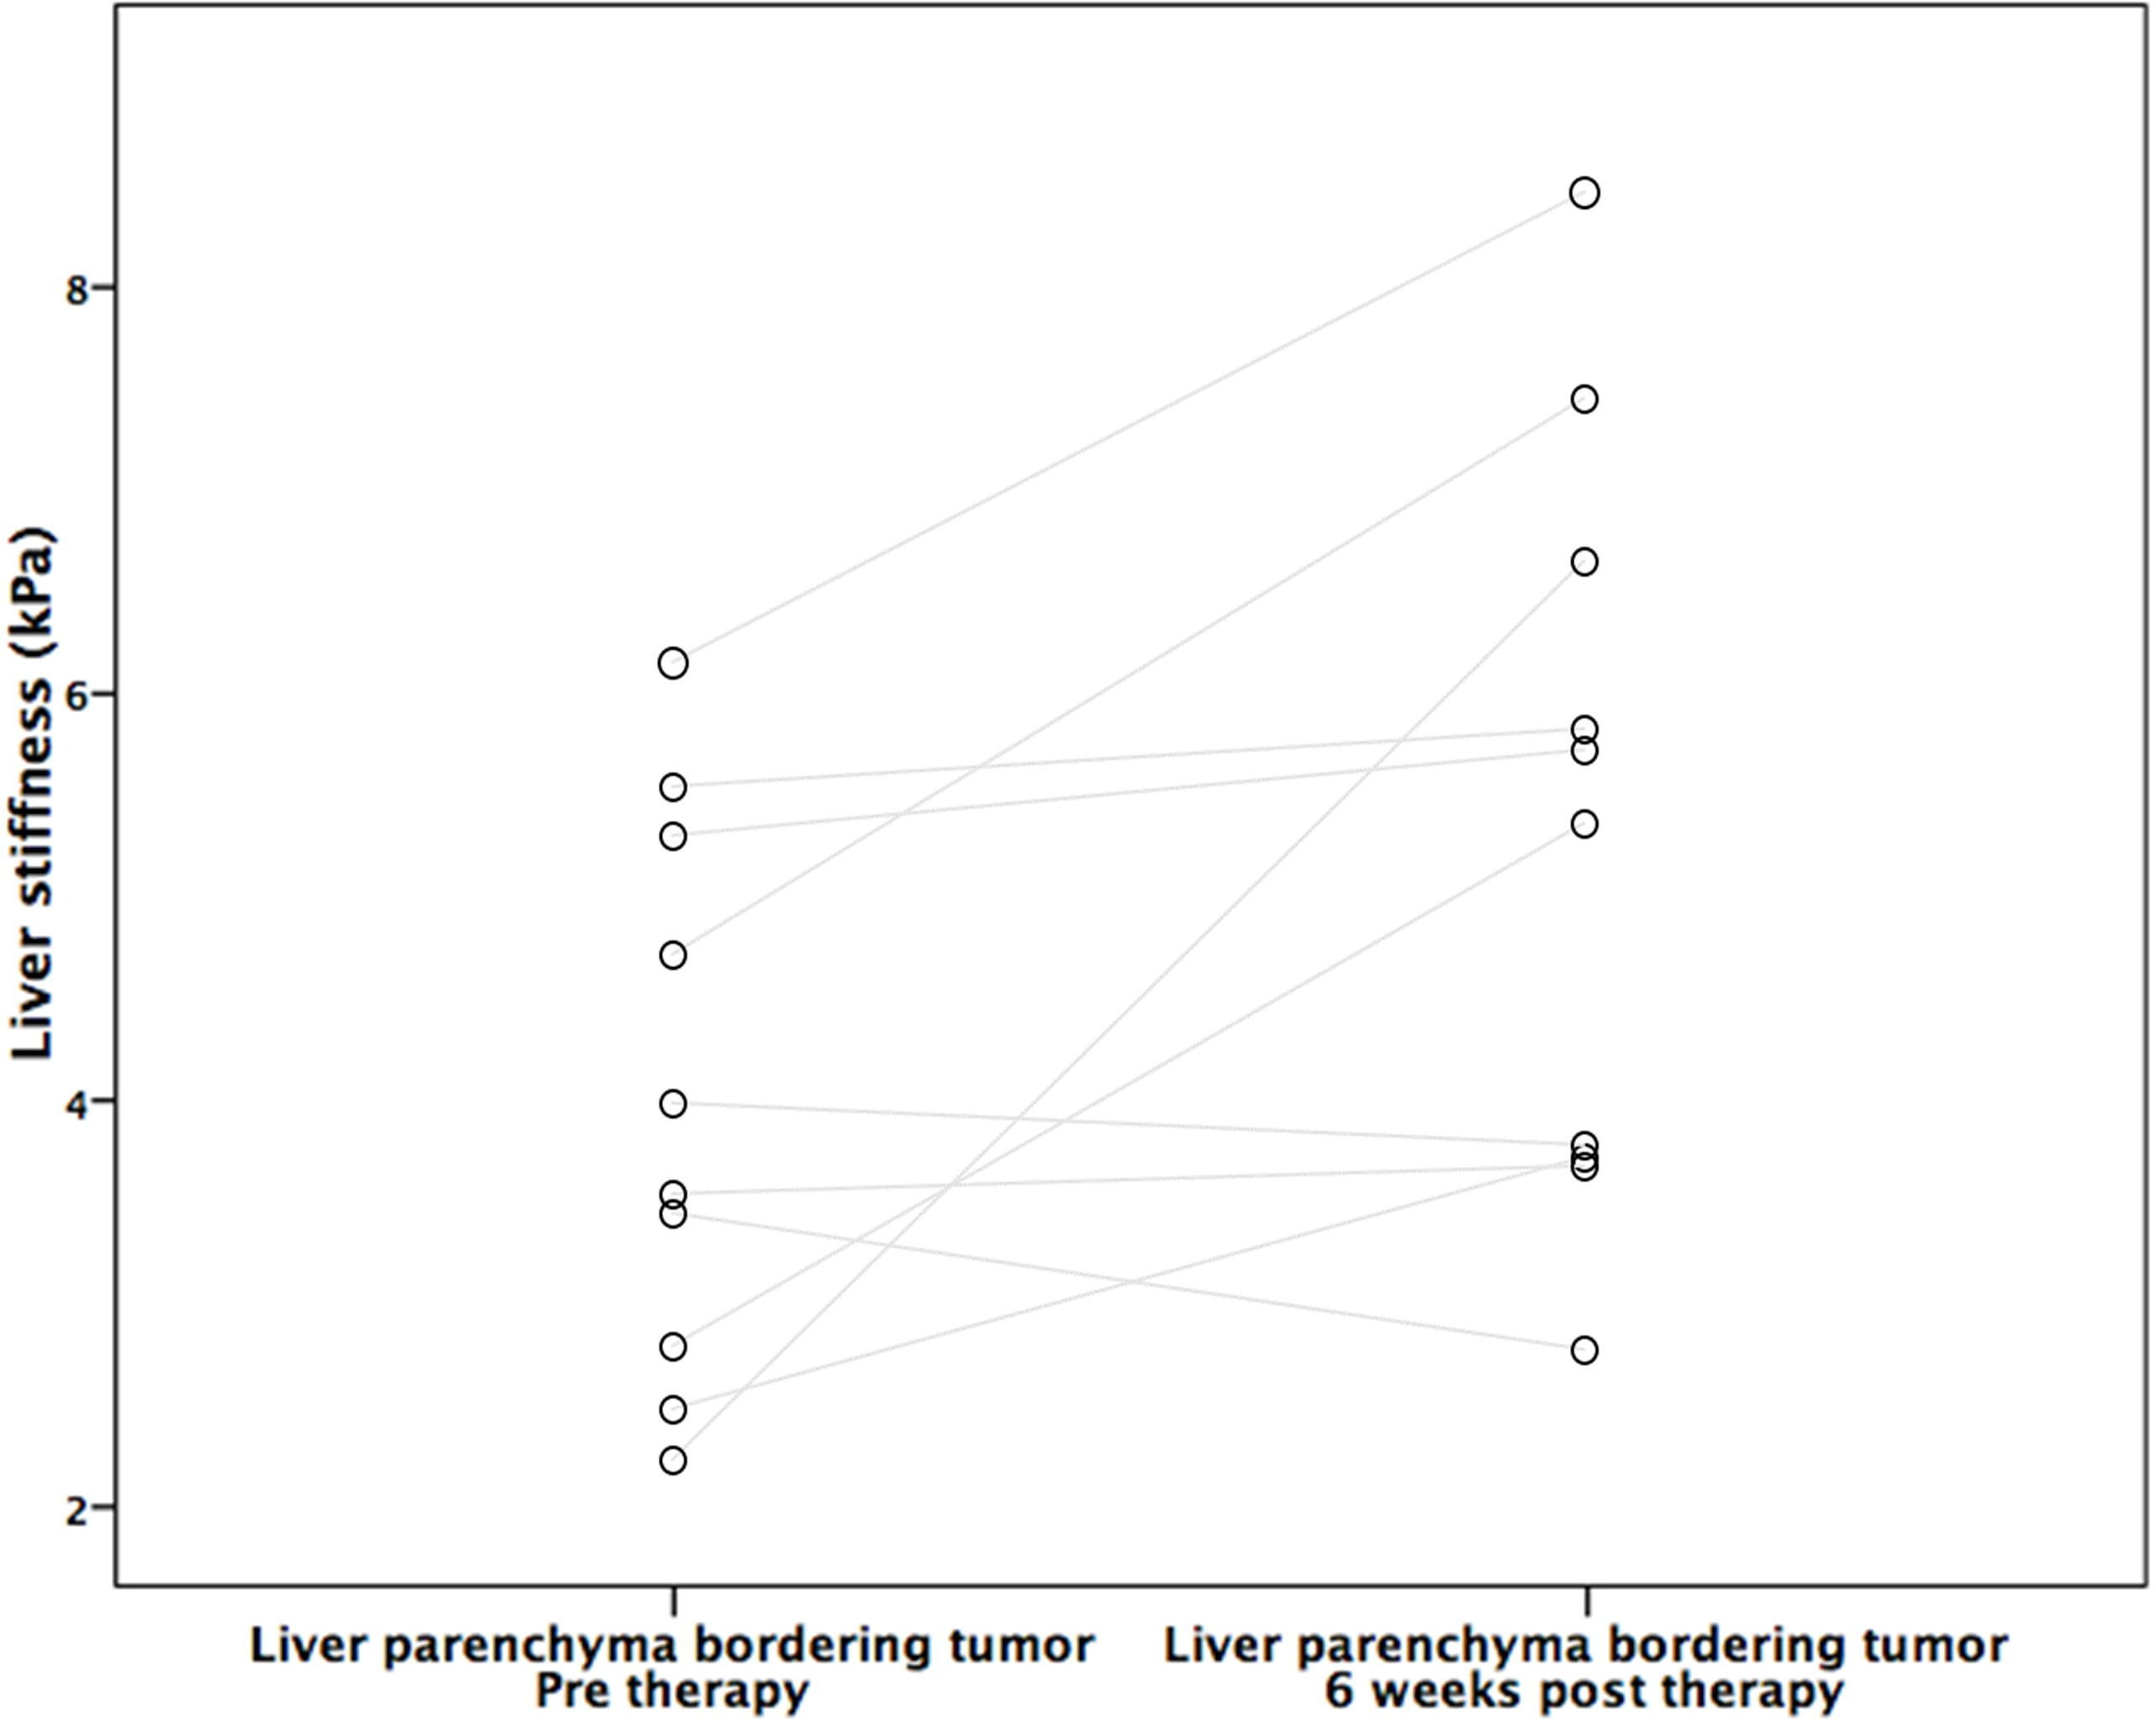
MRE was unsuccessful in 3 patients. Thus, 10 HCCs (mean size 3.4±1.9 cm, range 1.5cm-8cm) were analyzed in 10 patients. Hemorrhage was present in 9/10 treated lesions at 6w. An example pre and post RE elastogram is shown in Figure 1. Pre and post stiffness values for the measured tissues are displayed in Table 1. At baseline there was no significant difference between liver parenchyma stiffness and tumor stiffness (p=0.44). However, following RE, tumor stiffness was higher than liver stiffness away from the treated area, with a trend towards significance (4.44±0.91 vs 6.91±4.22 kPa, p=0.053). Tumor stiffness was significantly increased after RE (4.53±2.44 vs 6.91±4.22 kPa, p=0.005; Figure 2), with mean percentage increase of 55.6%±44.6%. Tumor stiffness increase was <5% in 2/10 tumors and >15% in the remaining 8 tumors (range 17%-155%). Percentage change in tumor stiffness was significantly associated with degree of tumor necrosis at 6w post RE (r=0.665, p=0.036). Tumor stiffness at 6w was negatively correlated with necrosis but the relationship was not significant (r=-0.540, p=0.11). Liver stiffness adjacent to the treated lesion was also significantly increased following therapy (4.06±1.38 vs 5.41±1.87 kPa, p=0.037; Figure 3). No difference was observed in liver stiffness away from the treated area after RE (4.88±1.23 vs 4.44±0.91 kPa, p=0.21).Discussion
These preliminary results suggest that HCC tumor stiffness and stiffness of surrounding liver increase at 6w after RE, and the percentage change in stiffness is significantly correlated with degree of tumor necrosis at 6w. A previous study reported a significant negative correlation between tumor stiffness post treatment and necrosis2. In our study we also observed a negative correlation between tumor stiffness post treatment and degree of necrosis however it was not significant, potentially due to the small sample size. Also, the median interval between treatment and imaging was twice as long as that in our study (85 vs 42 days). The time course of stiffness change following therapy is as yet unknown.Conclusion
The results indicate mechanical properties of tumor tissue and surrounding liver parenchyma change significantly early after RE therapy. The time course of stiffness change following therapy will be studied in a future larger study, including data on response to therapy at 6 months.Acknowledgements
This research was supported by NCI grant U01 CA172320.References
1. Dzyubak B, Glaser K, Yin M, et al. Automated Liver Stiffness Measurements with Magnetic Resonance Elastography. Journal of magnetic resonance imaging : JMRI 2013;38(2):371-379.
2. Gordic S, Ayache JB, Kennedy P, et al. Value of tumor stiffness measured with MR elastography for assessment of response of hepatocellular carcinoma to locoregional therapy. Abdom Radiol 2017:1-10.
Figures