4602
A comparison of 7 and 3 Tesla time-of-flight renal MR angiography for detection of intrarenal vessels1Sir Peter Mansfield Imaging Centre, University of Nottingham, Nottingham, United Kingdom
Synopsis
Chronic Kidney Disease (CKD) is thought to be due to small artery disease at the cortico-medullary border, however these vessels are too small to be imaged at conventional field strengths. Here, we assess the feasibility of 2D gradient echo Time-of-flight (TOF) renal angiography at 7 T to detect the arterial vasculature of the kidney and delineate the intrarenal vasculature network. We compare TOF MRA data collected at 3 T and 7 T in the same subjects, and illustrate the superiority of 7 T for high spatial resolution MRA.
Purpose
A substantial proportion of Chronic Kidney Disease CKD is thought to be due to small artery disease at the cortico-medullary border, however these vessels are too small to be imaged at conventional MR field strengths. The superiority of ultra-high field (7T) MR Time of Flight (TOF) Angiography for visualization of the microvasculature compared with clinical MRA images at 1.5T or 3T has been demonstrated in the brain1,2. At UHF the longer T1 relaxation time leads to better suppression of the background signal at a lower flip angle, whilst the signal intensity in vessels remains constant, which combined with the increased SNR should result in higher CNR in vessels. Therefore it should be possible to obtain higher spatial resolution MRA images at 7T without loss of CNR compared to 3T. Here, we assess the feasibility of TOF angiography at 7T to study small vessels in the kidneys and compare this with data acquired at 3T.Methods
Data was collected on four subjects on both a 7 T Philips Achieva and a 3 T Philips Ingenia scanner using a 2D gradient echo (GE) Time-of-flight (TOF) MRA in the transverse orientation. At 7 T, an 8-channel fractionated dipole array transmit coil with 32-channel receive elements (MRcoils, Zaltbommel, Netherlands) was used. Power-constrained RF shimming (MLS3) was performed interactively over one or both kidneys using in-house software4. Slices were acquired with TR/TE 20/5.4 ms, a FOV of 230 x 230 mm2, resolution 1.5 x 1.5 x 2 mm3, requested flip angle 70°, BW 298 Hz/pixel, no parallel acquisition, resulting in 6 slices acquired per 20 s breathhold (due to SAR limits). Data had an interpolated in-plane resolution of 0.65 x 0.65 mm. 2D TOF scans were repeated in 12 mm steps in the foot-head direction to ensure full coverage of the kidney (typically requiring 6 – 8 breath-holds). At 3 T, data was collected with matched acquisition parameters, with a flip angle of 45° to match the tissue contrast achievable at 7 T within the SAR limits. Again MRA acquisitions were repeated to collect data across the entire kidney. Individual TOF scans were concatenated and for each an angiogram was generated using maximum intensity projection (MIP) in MATLAB.Results
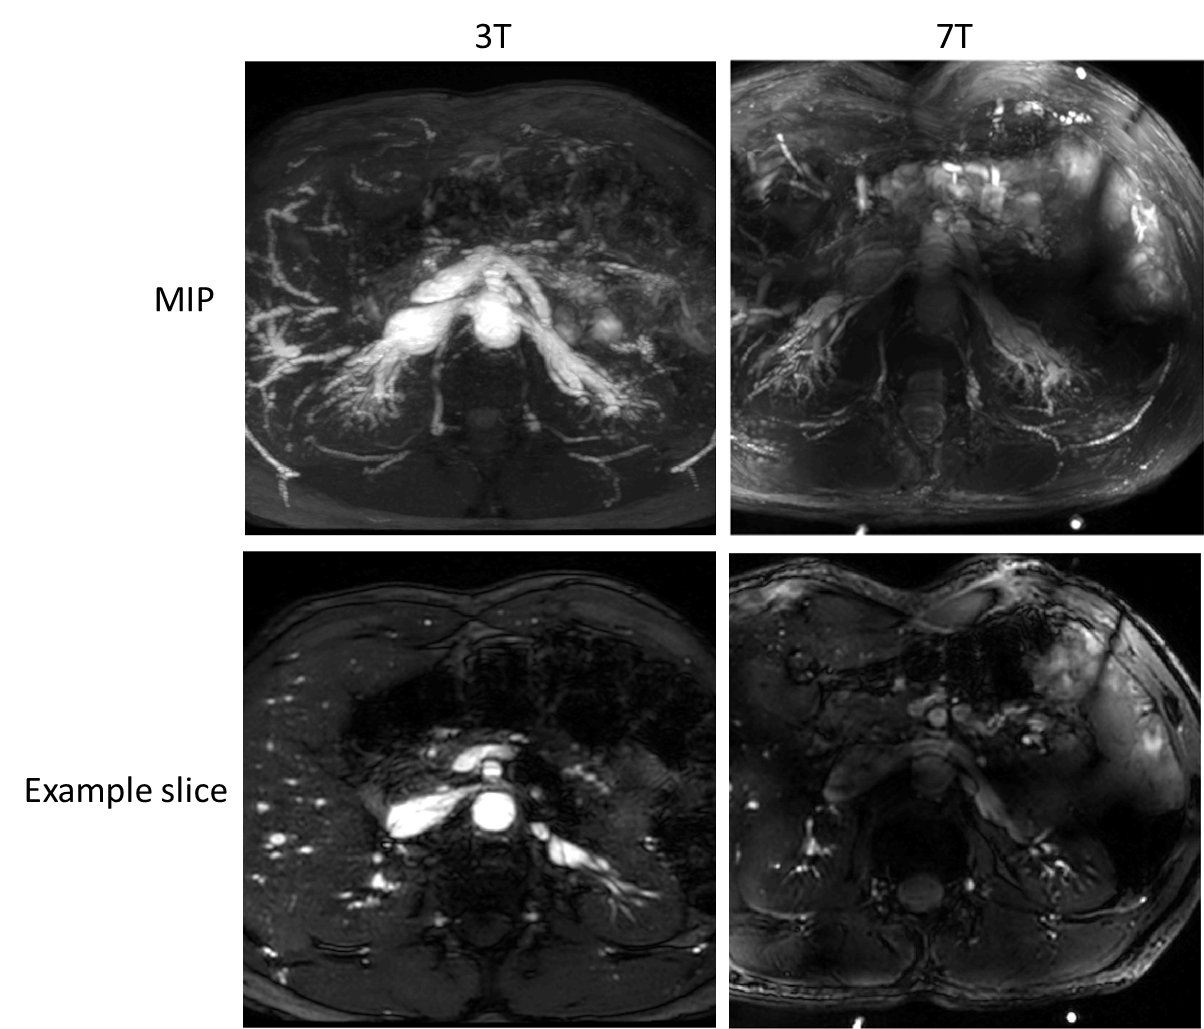
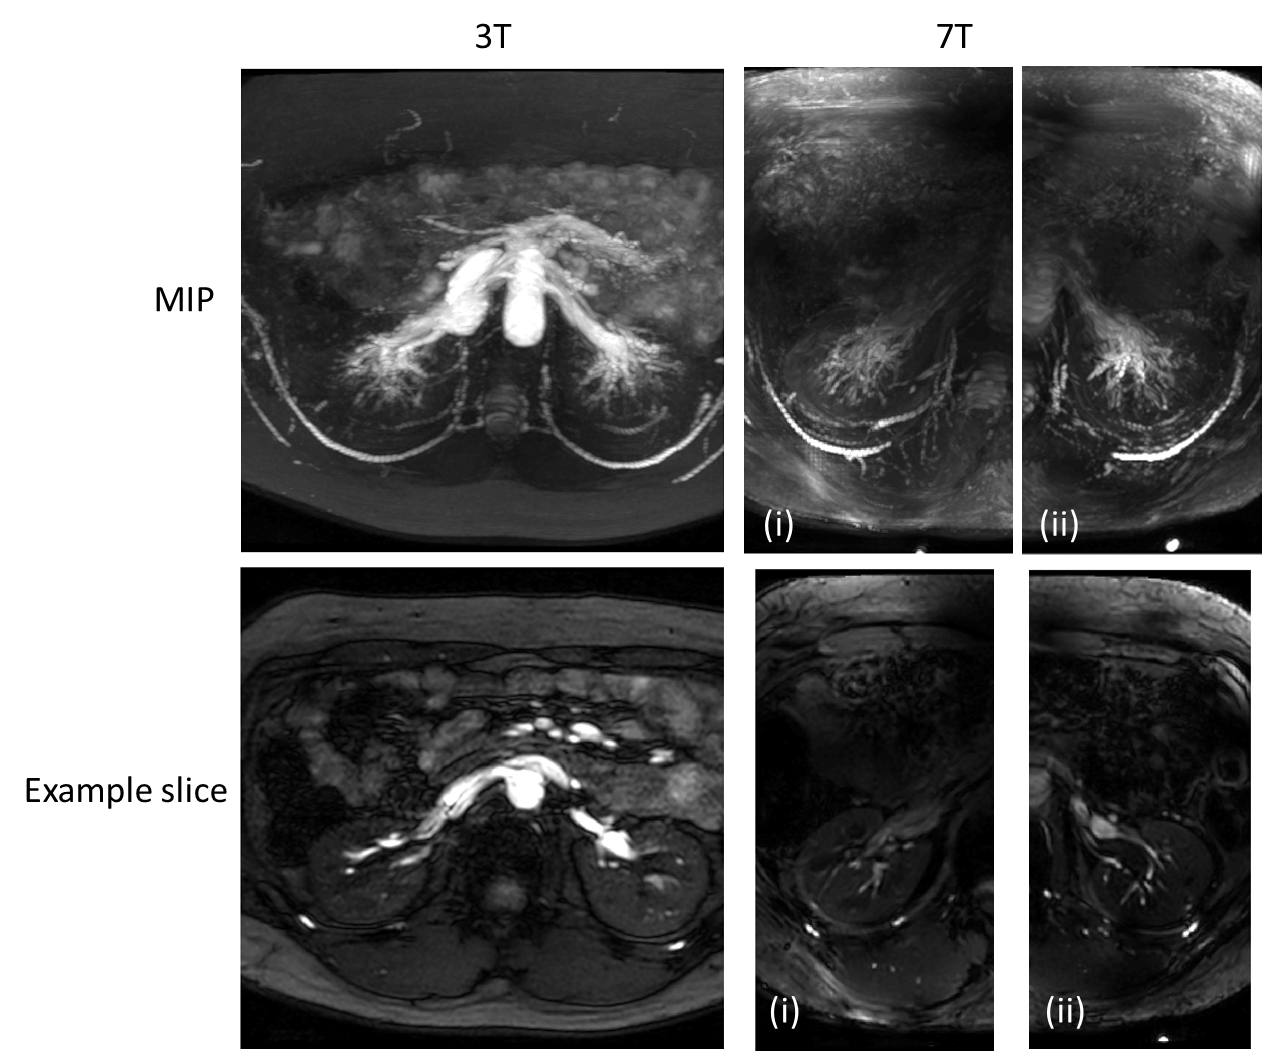
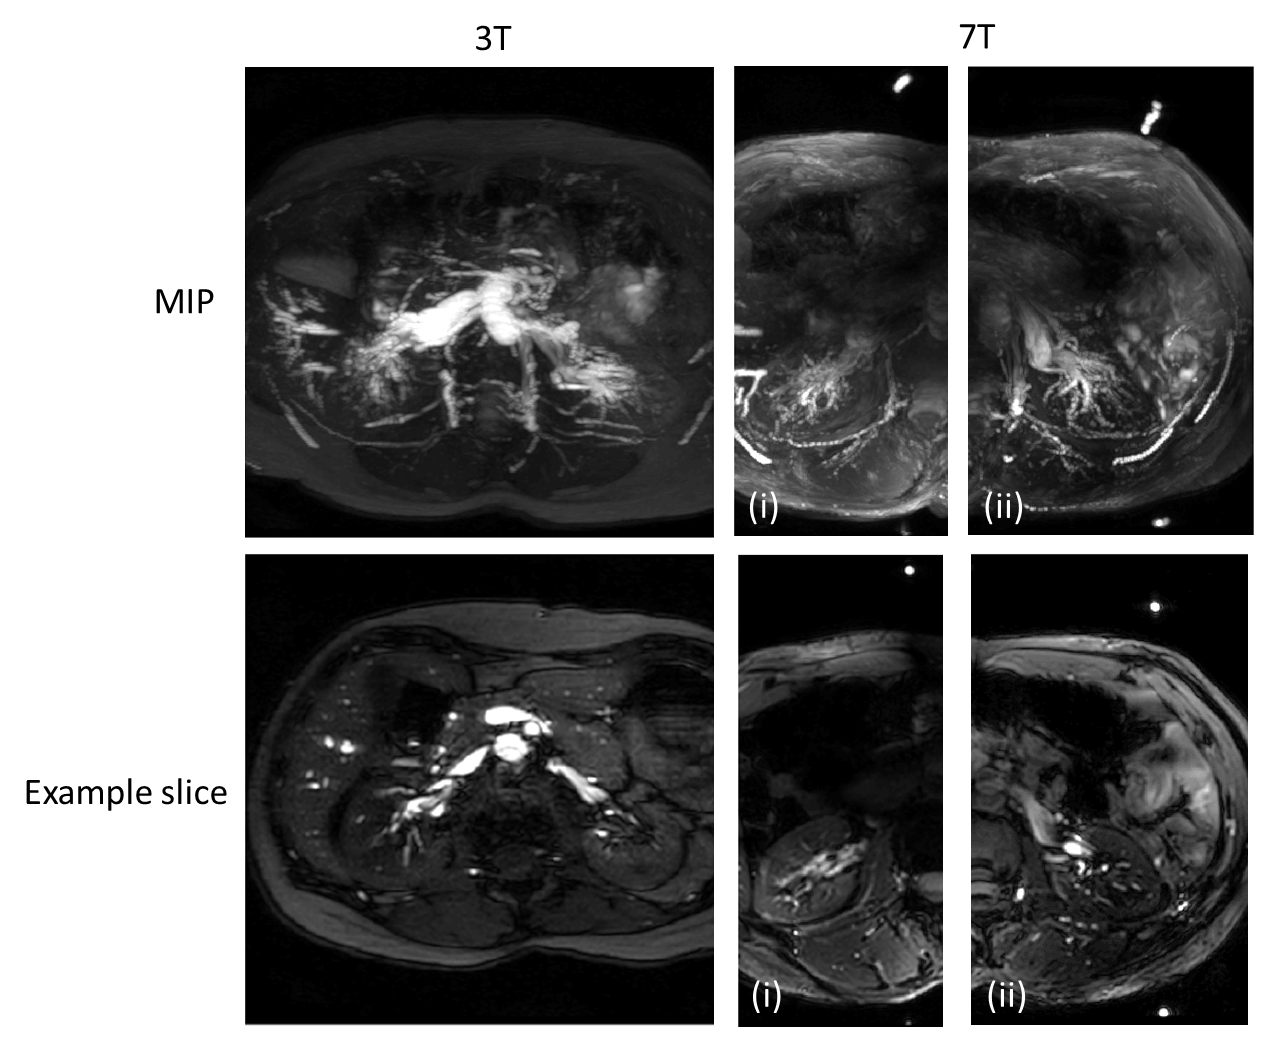
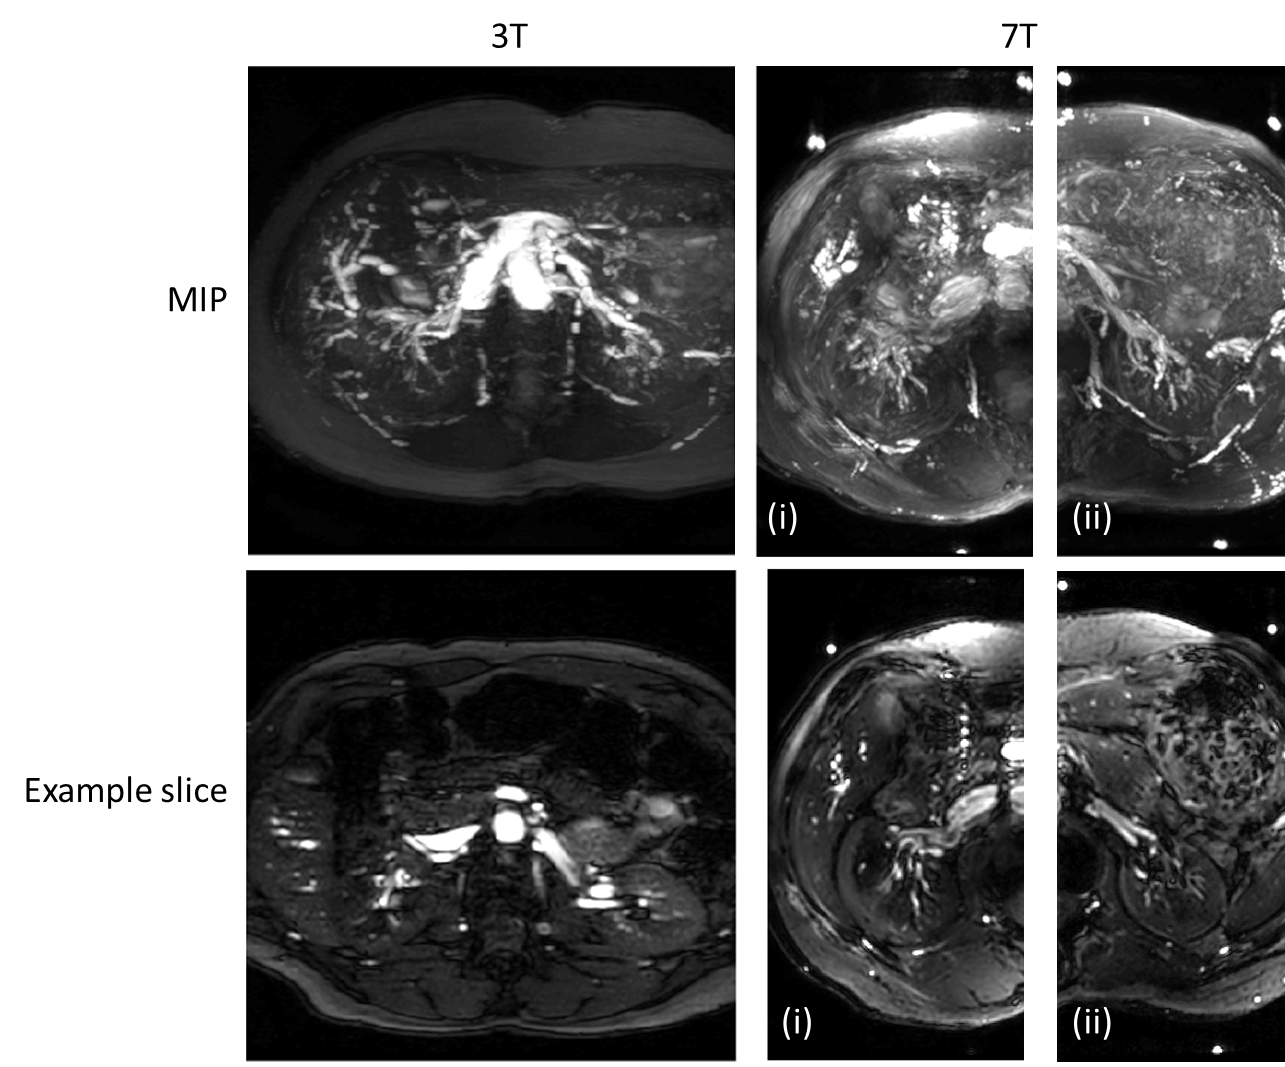
Figure 1 compares the MR angiography data between 3 T and 7 T, using RF shimming over both kidneys. Here both left and right renal arteries were seen at 7 T, and despite incomplete background suppression due to power limits at 7 T, the 7 T TOF MRA shows superior delineation of the intrarenal vessel tree. Figures 2-4 show the comparison between 3 T and 7 T, for 7 T data in which an MRA was collected separately using an RF shim optimised for the left or right kidney. Qualitative image analysis reveals the superiority of 7T TOF data to detect smaller vessels providing improved delineation of vessels from the root (renal artery) to the peripheral branches (cortical arteries), as seen in both the example slices and the MIP.Discussion
Previous studies at 7 T5,6 have shown the possibility of 2D GE TOF renal MRA, and shown that it provides superior delineation of the aorta and left and right renal arteries compared. Here the spatial resolution was increased (1.5 x 1.5 x 2 mm) to show the delineation of small intrarenal arteries.Conclusion
The increased SNR and longer relaxation times of 7 T provide improved delineation of the intrarenal vasculature.Acknowledgements
This work was supported by funding from the Engineering and Physical Sciences Research Council (EPSRC) and Medical Research Council (MRC) [grant number EP/L016052/1].References
1. Laader A, Beiderwellen K, Kraff O, Maderwald S, Ladd ME, Forsting M, Umutlu L. Non-enhanced versus low-dose contrast-enhanced renal magnetic resonance angiography at 7 T: a feasibility study. Acta Radiol. 2017 Jan 1:284185117718399
2. Grochowski C, Staśkiewicz G. Ultra high field TOF-MRA: A method to visualize small cerebral vessels. 7T TOF-MRA sequence parameters on different MRI scanners - Literature review. Neurol Neurochir Pol. 2017 Sep - Oct;51(5):411-418.
3. Setsompop K, Wald LL, Alagappan V, Gagoski BA, Adalsteinsson E. Magnitude least squares optimization for parallel radio frequency excitation design demonstrated at 7 Tesla with eight channels.Magn Reson Med. 2008 Apr;59(4):908-15
4. Mirfin, C. et al. In Proc. ISMRM 2017 (Hawaii), p 5204.
5. Umutlu L, Maderwald S, Kraff O, Kinner S, Schaefer LC, Wrede K, Antoch G, Forsting M, Ladd ME, Lauenstein TC, Quick HH (2012) New look at renal vasculature: 7 tesla nonenhanced T1-weighted FLASH imaging. J Magn Reson Imaging 36(3):714–721
6. Fischer, A., O. Kraff, S. Maderwald, K. Beiderwellen, M.E. Ladd, M. Forsting, T.C. Lauenstein, and L. Umutlu, Non-Enhanced T1-Weighted Liver Vessel Imaging at 7 Tesla. Plos One, 2014. 9(6).
Figures