4601
T2WI Texture Analysis in Renal Cell Carcinoma: Histologic Subtype Classification1Affiliated Hospital of Changzhi Institute of Traditional Chinese Medicine, Changzhi, China, 2Chinese PLA General Hospital, Beijing, China, 3Qinhuangdao Municipal No.1 Hospital, Qinhuangdao, China
Synopsis
This retrospective study investigates the possibility of distinguishing between clear cell renal cell carcinoma ( ccRCC ) and non-clear cell renal cell carcinoma ( nccRCC ) using MRI-derived parameters by exploring a predictive method. We enrolled the patients with three common subtypes of renal tumor - clear cell renal cell carcinoma ( ccRCC ), papillary renal cell carcinoma ( pRCC ) and chromophobic renal cell carcinoma ( cRCC ). We combined pRCC and cRCC into one subtype - nccRCC. Our results demonstrated that MRI texture analysis can differentiate ccRCC from nccRCC with high specificity, sensitivity and accuracy and can probably facilitate the precise treatment of renal tumors in the future clinical practice.
Purpose
To differentiate clear cell renal cell carcinoma ( ccRCC ) from non-clear cell renal cell carcinoma ( nccRCC ) by means of MRI texture analysis and probe a valid predictive method for future more in-depth research and clinical practice.Methods
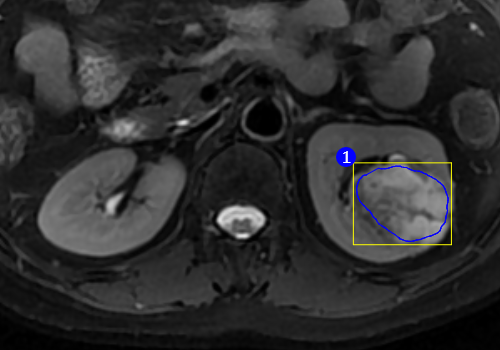
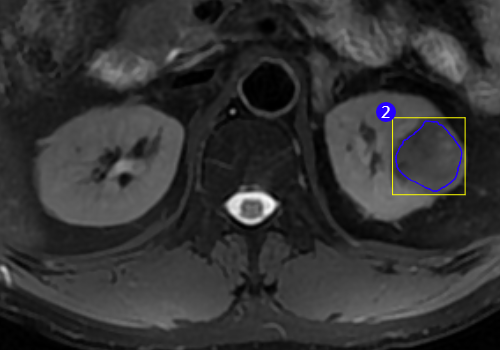
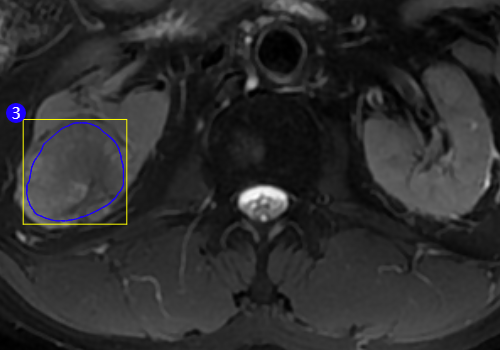
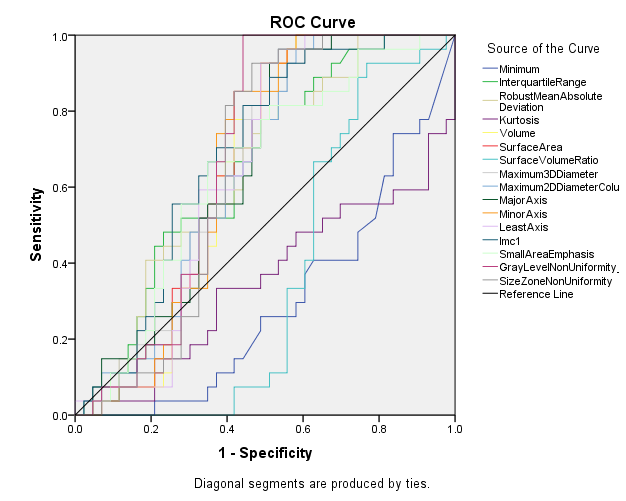
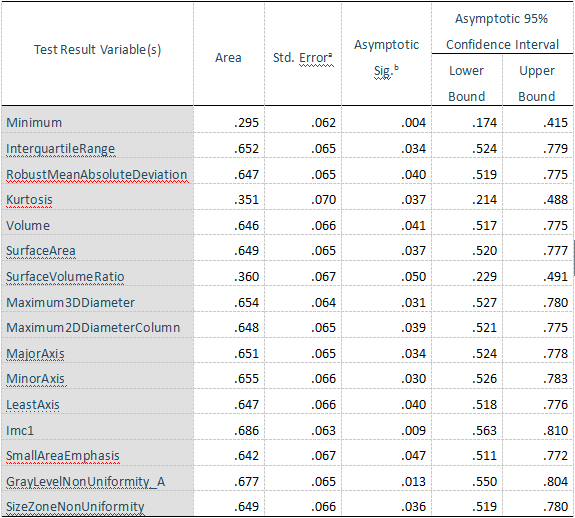
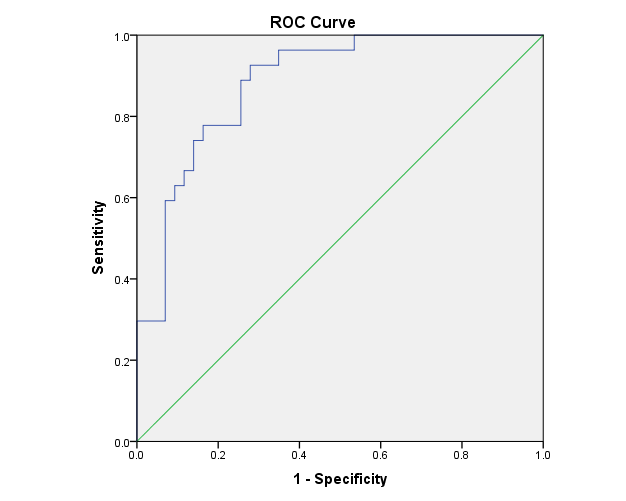
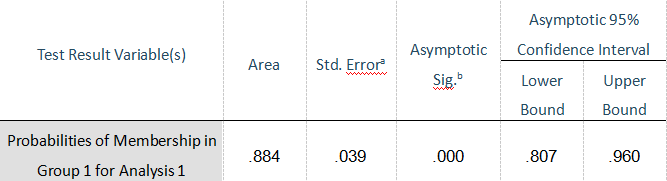
A total of 67 patients with 70 renal tumor lesions were included, all of which were removed by surgery and pathologically confirmed. These lesions included three common subtypes of renal tumor - ccRCC, papillary renal cell carcinoma ( pRCC ) and chromophobic renal cell carcinoma ( cRCC ). We combined pRCC and cRCC into one subtype - nccRCC. All the T2 weighed images ( T2WIs ) of kidney were obtained by the same MR scanner with the same scanning parameters. Using a texture analysis software, all the lesions on T2WIs were delineated to get the corresponding Regions of Interest ( ROI ) and texture parameters ( Figure 1 - Figure 3 ). Parameters based on Feature Classes ( n = 93 ) were included and analyzed statistically. nonparametric test was used to compare the average value of each texture parameter for assessing the difference between ccRCC and nccRCC. Receiver operating characteristic ( ROC ) analysis was performed and area under the ROC curve ( AUC ) was calculated for texture parameters that were significantly different ( P < 0.05 ) ( Figure 4, Figure 5 ). Diagnostic performance, including Sensitivity ( Se ), specificity ( Sp ), positive predictive value ( PPV ), negative predictive value ( NPV ) , and accuracy were calculated using the cut-off value of texture parameter with the highest AUC. Then we put all the parameters that were significantly different into discriminate analysis model and a new variable which reflect prediction probability was created. The ROC curve (Figure 6), the corresponding AUC value ( Figure 7 ) and diagnostic performance of the variable was got. We compared the AUCs and the diagnostic performances of the two methods.
Result
Among the 93 texture parameters generated by T2WIs, there were 16 parameters which had statistically significant difference between ccRCC and nccRCC. Among the 16 parameters, Minimum ( a parameter which describes minimum gray level intensity within the ROI ) produced the highest AUC of 0.705 ( Se = 59.3%, Sp = 74.4%, PPV = 59.3%, NPV = 74.4%, accuracy = 68.6% ). By using multivariate analyses of the 16 variables, discriminate analysis model created the AUC of 0.884 ( Se = 85.2%, Sp = 74.4%, PPV = 67.6%, NPV = 88.8%, accuracy = 78.6% ).Discussion
Classification of subtypes of renal tumors is clinically important as it may affect treatment options and outcome1, 2. subtyping renal cell carcinomas also affects treatment options and outcome3. Numerous attempts have been made to distinguish renal tumors, including pattern of enhancement on CT4 and CT texture analysis5. Studies via MRI techniques have also been explored6,7. But, there were less report about T2WI texture analysis to differentiate renal tumors. Our purpose was to differentiate ccRCC from nccRCC via T2WI texture analysis and to provide a feasible method for future more in-depth research. We compared the diagnostic performance between single factor analysis and multivariate analyses on parameters generated from T2WI of the 70 renal cell carcinomas. The AUC value of Minimum ( single factor ) is 0.705 ( Se = 59.3%, Sp = 74.4%, PPV = 59.3%, NPV = 74.4%, accuracy = 68.6% ). By using multivariate analyses of the 16 variables, discriminate analysis model created the AUC of 0.884 ( Se = 85.2%, Sp = 74.4%, PPV = 67.6%, NPV = 88.8%, accuracy = 78.6% ). This shows the discriminate analysis model have superior distinguishing ability than single factor ( Minimum ) analysis. Research suggests that texture features of medical image can reflect heterogeneity of tumors8. Our study shows multivariate analyses of T2WI parameters may better reflect heterogeneity of renal tumors than single factor analysis do. With just T2WIs, our method can differentiate ccRCC from nccRCC availably without ionizing radiation and contrast injection, so it can be used to more extensive research.Conclusions
Our study provide a feasible way to differentiate ccRCC from nccRCC via T2WI texture analysis and it may be practical for future more in-depth and extensive research.Acknowledgements
No acknowledgement found.References
1. Zhang J, Lefkowitz RA, Ishill NM, Wang L, Moskowitz CS, Russo P, Eisenberg H, Hricak H: Solid renal cortical tumors: differentiation with CT. Radiology 2007;244(2):494.
2. Nathan P, Vinayan A: Imaging techniques as predictive and prognostic biomarkers in renal cell carcinoma. Therapeutic Advances in Medical Oncology 2013;5(2):119-131.
3. Singer EA, Bratslavsky G, Linehan WM, Srinivasan R: Targeted therapies for non-clear renal cell carcinoma. Targeted Oncology 2010;5(2):119.
4. Young JR, Margolis D, Sauk S, Pantuck AJ, Sayre J, Raman SS: Clear cell renal cell carcinoma: discrimination from other renal cell carcinoma subtypes and oncocytoma at multiphasic multidetector CT. Radiology 2013;267(2):444.
5. Yu H, Scalera J, Khalid M, Touret AS, Bloch N, Li B, Qureshi MM, Soto JA, Anderson SW: Texture analysis as a radiomic marker for differentiating renal tumors. Abdominal Radiology 2017:1-9.
6. Wu Y, Kwon YS, Labib M, Foran DJ, Singer EA: Magnetic Resonance Imaging as a Biomarker for Renal Cell Carcinoma. Dis Markers 2015;2015:648495.
7. Sun MR, Ngo L, Genega EM, Atkins MB, Finn ME, Rofsky NM, Pedrosa I: Renal cell carcinoma: dynamic contrast-enhanced MR imaging for differentiation of tumor subtypes--correlation with pathologic findings. Radiology 2009;250(3):793.
8. Ng F, Ganeshan B, Kozarski R, Miles KA, Goh V: Assessment of Primary Colorectal Cancer Heterogeneity by Using Whole-Tumor Texture Analysis: Contrast-enhanced CT Texture as a Biomarker of 5-year Survival. Radiology 2013;266(1):177-184.
Figures