4600
Assessment of Optimal Technique for Measurement of Medullary Perfusion1Sir Peter Mansfield Imaging Centre, School of Physics and Astronomy, University of Nottingham, Nottingham, United Kingdom, 2NIHR Nottingham Biomedical Research Centre, University of Nottingham, Nottingham, United Kingdom
Synopsis
The ability to assess medullary perfusion is important in kidney disease, for example in acute kidney injury (AKI) in which reduced medullary blood flow is implicated. In this study, we compare the use of a spin echo (SE) EPI and balanced FFE (bFFE) readout at multiple post label delay (PLD) times to determine the optimal readout scheme and to assess the number of ASL pairs required to compute medullary perfusion. Using a bFFE FAIR ASL scheme, it is possible to quantify tissue perfusion within the renal medulla.
Purpose
Arterial spin labelling (ASL) has been shown to provide a method to non-invasively assess renal cortex perfusion1, typically using a flow-sensitive alternating inversion recovery (FAIR) labelling scheme. Here, we evaluate the viability of using a respiratory triggered FAIR-ASL scheme to assess renal medulla perfusion. We compare the use of a spin echo (SE) EPI and balanced FFE (bFFE) readout2, collect data at multiple post label delay (PLD) times and assess the number of ASL pairs required to compute medullary perfusion. The assessment of medullary important is important in kidney disease, for example to study the pathophysiology in acute kidney injury (AKI) in which reduced medullary blood flow has been implicated3.Methods
MR Acquisition: 4 healthy volunteers (2 Male, average age 25 years) were scanned on a Philips 3T Ingenia scanner (Best, Netherlands) using dual-transmit and a 16 channel anterior and 16 channel posterior body coil. Localiser bFFE scans were collected in 3 orthogonal planes to aid ASL planning. Data was collected using a respiratory-triggered pulsed FAIR ASL scheme (in-plane pre-saturation, Non-Selective (NS) slab thickness 400 mm, Selective (S) slab thickness 45 mm)1. Coronal-oblique slices through the long axis of the kidney were acquired in descend (lateral-medial) order with the minimum temporal slice separation allowed by specific absorption rate (SAR) limits. Imaging parameters for the ASL data was 3x3x5 mm3 voxels, in-plane FOV of 288x288 mm2, SENSE factor 2, volume shimming. Data was collected using either a SE-EPI readout (TE= 27ms, temporal slice spacing 53 ms) or a bFFE readout (TE/TR = 1.73/3.5 ms, temporal slice spacing 250 ms). FAIR ASL data was collected at a range of post label delays (PLD): 500, 800, 1100, 1300 and 1500ms. 50 selective/non-selective pairs were acquired at each PLD. A base magnetisation M0 image and an inversion recovery data set to compute a T1 map were acquired for each readout scheme.
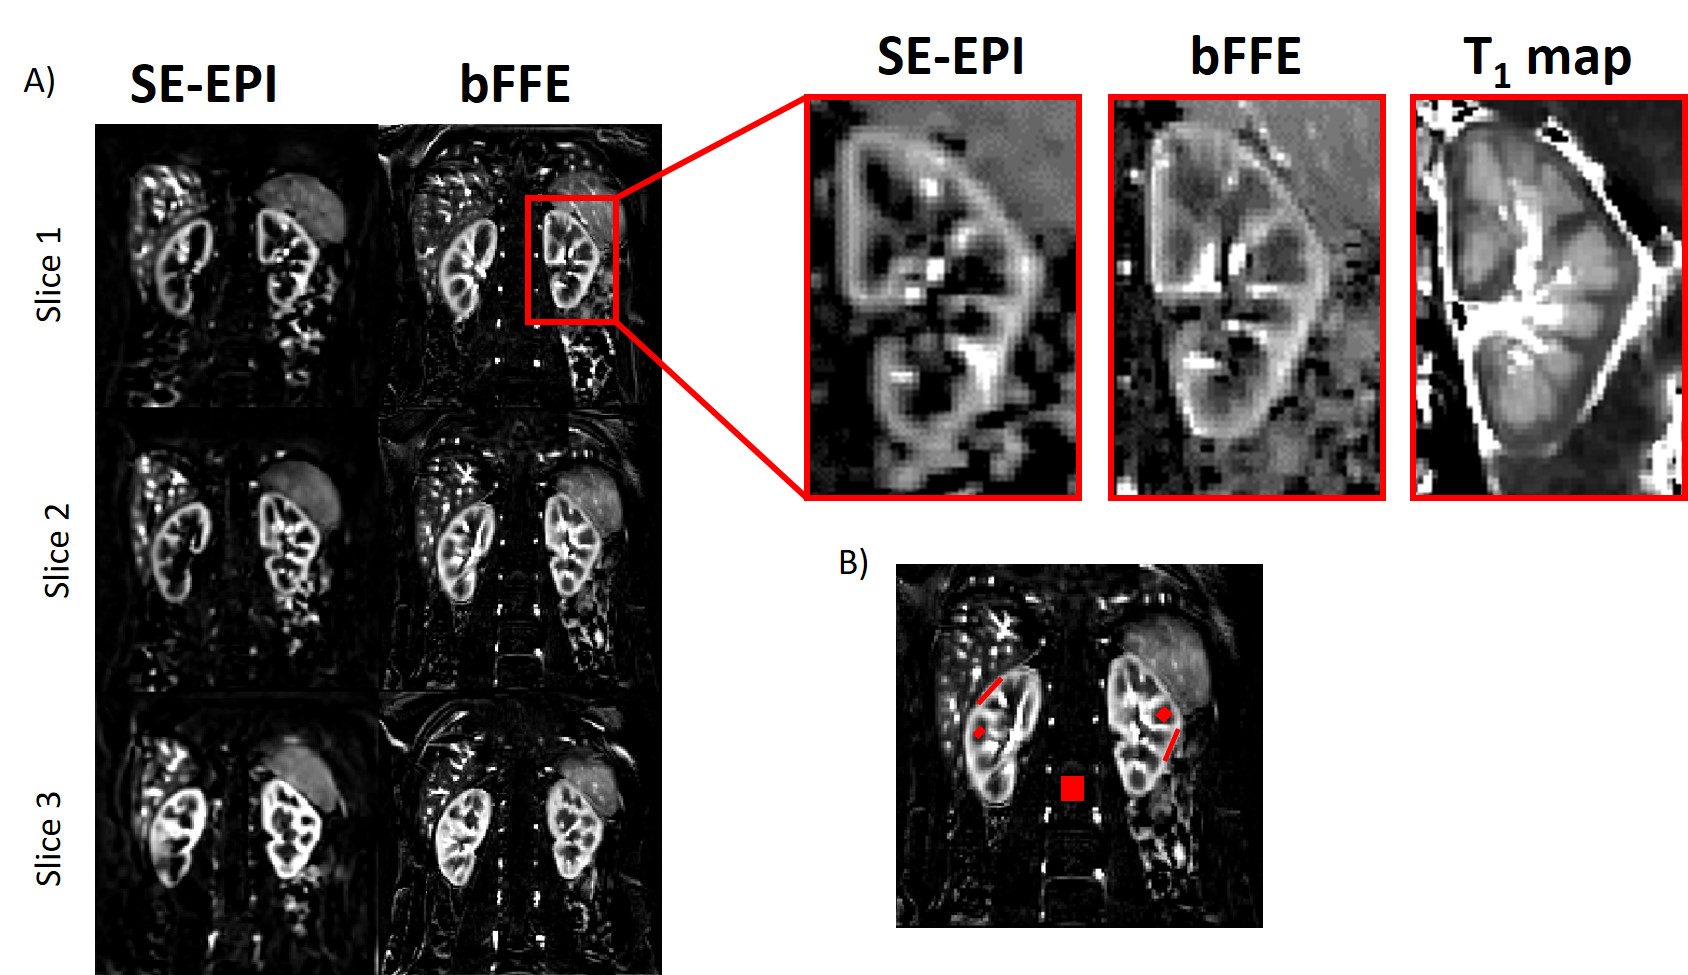
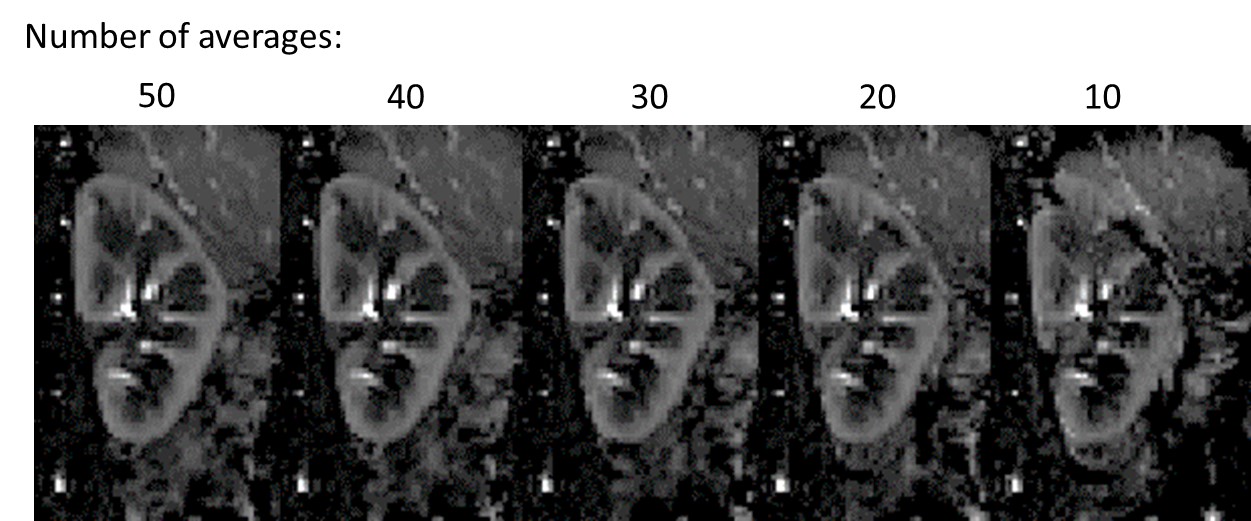
Data Analysis: Analysis was performed using in-house MATLAB scripts1. Each selective/non-selective pair within the PLD set were motion corrected to the first label image. Perfusion weighted (ΔM) maps were computed from (selective-non-selective) images and averaged. Regions of interest (ROI) were drawn in the medulla and cortex (ensuring no partial volume effects between tissue types) and in the background to assess noise (Figure 1). These ROIs were used to evaluate the signal-to-noise ratio (SNR) within the cortex and the medulla for each readout scheme. In addition, the number of averages needed to measure medullary perfusion was computed by varying number of averages (3,4,5,10,15,20,25,50 and 100).
Results
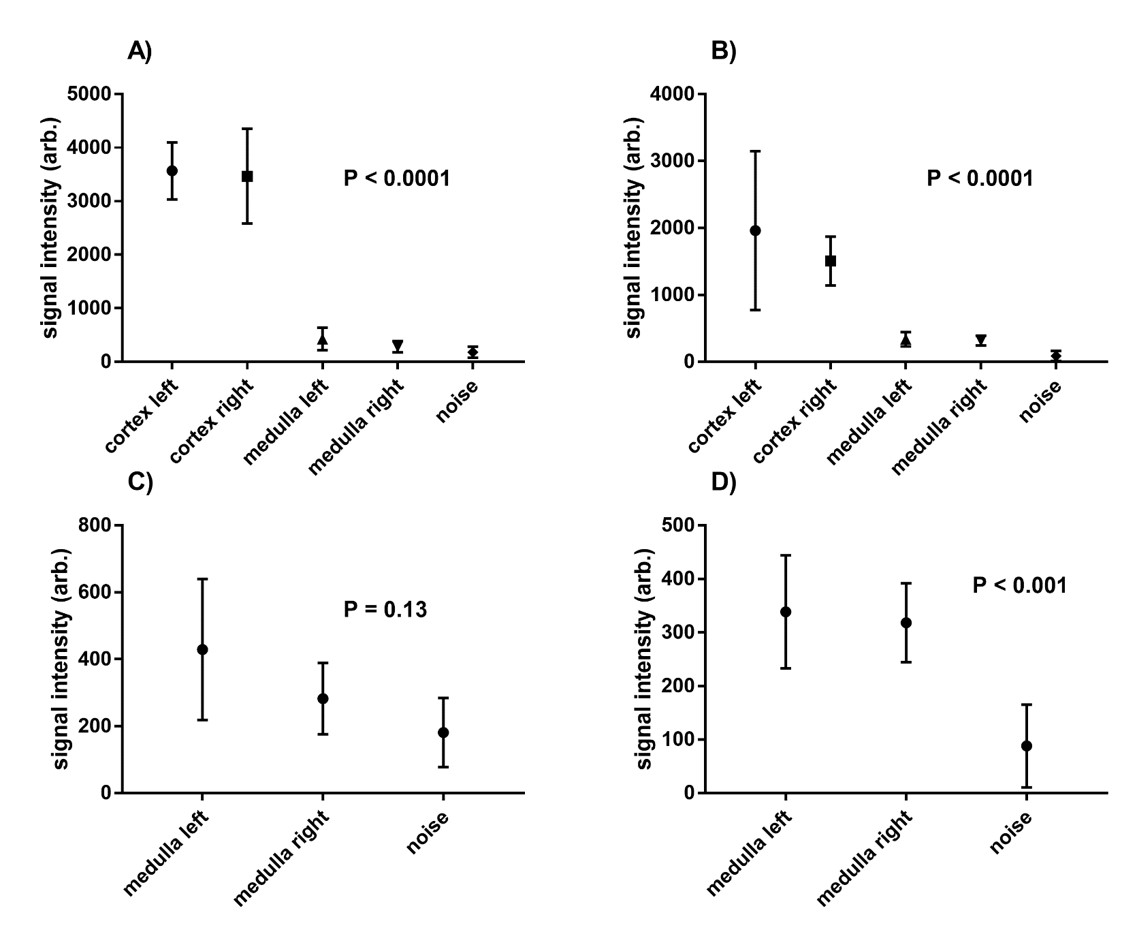
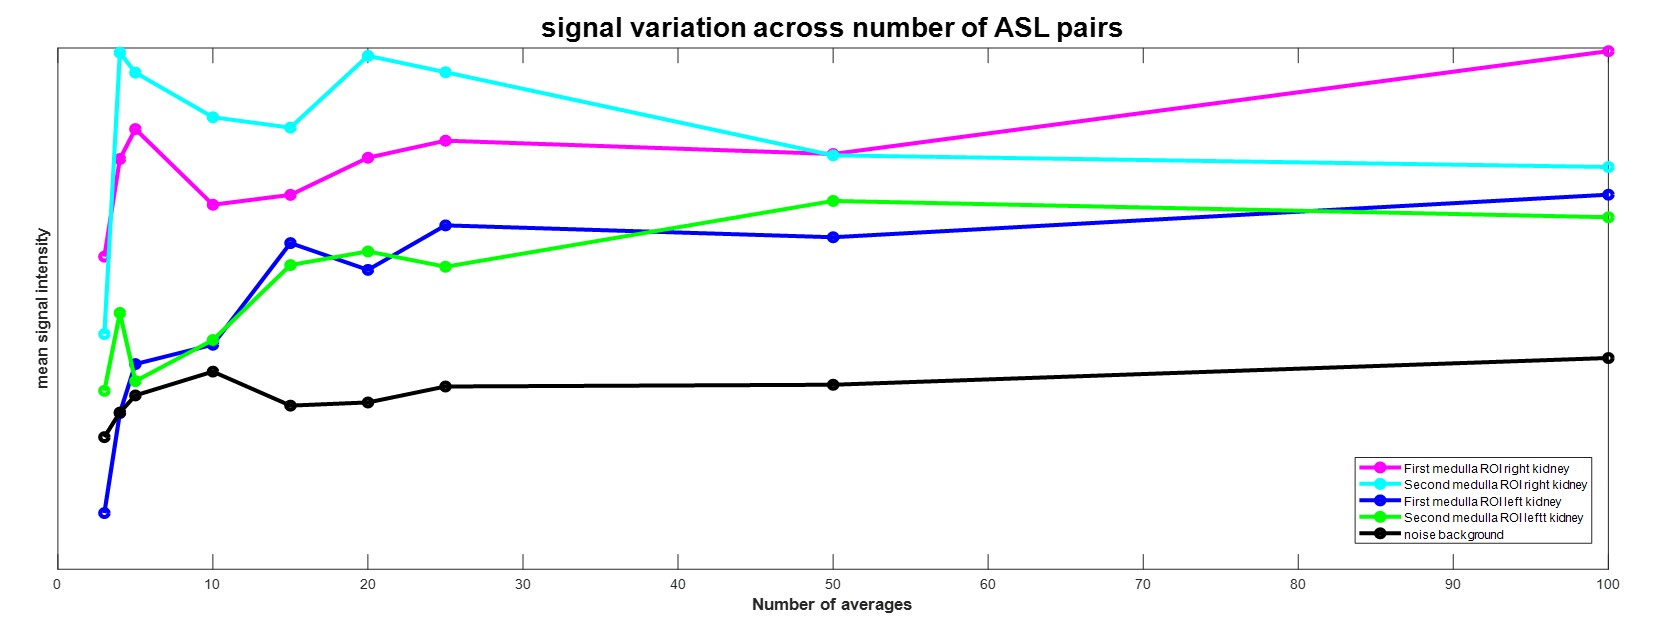
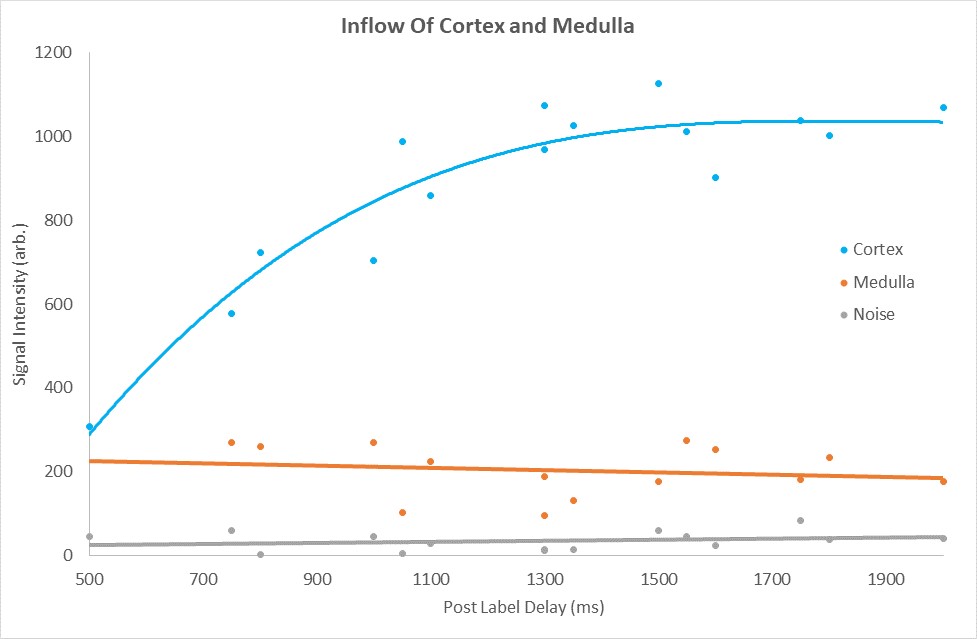
Figure 1 compares the FAIR-ASL perfusion weighted images for a SE-EPI readout and bFFE readout, significant improvement in detection of medulla signal is seen for the bFFE scheme. Figure 2 shows that the signal within the medulla tissue is a factor of 2.2 greater than the noise floor for the bFFE readout (P<0.0001), and has a contrast-to-noise ratio (CNR) between cortex and medulla of 23, whilst the SE-EPI is signal limited for medulla perfusion assessment. Figure 3 shows bFFE ΔM maps with varying number of averages. Figure 4 shows the perfusion weighted signal intensity compared to the noise floor, the medulla signal was significantly higher (>2.3) than the noise floor, even for a low (10) number of averages (P=0.004). Figure 5 shows the perfusion weighted signal change as a function of PLD time for the cortex, medulla and noise.Discussion
Here we show that the bFFE readout is the optimal readout scheme of choice for the assessment of renal medulla perfusion. The bFFE scheme has a higher perfusion CNR than that of SE-EPI, due to in part to the short TE. The signal observed in the medulla is significantly higher than the noise floor in the perfusion weighted maps at all PLDs. We show that it is possible to estimate medulla perfusion with as few as 10 ASL pairs using a bFFE FAIR-ASL scheme.Conclusion
Using a bFFE FAIR ASL scheme, it is possible to quantify tissue perfusion within the renal medulla. This scheme can be applied to assess medullary perfusion in renal disease, for example to study changes that occur in acute kidney injury, which has been suggested to arise from hypoxia of the medulla and altered medullary perfusion.Acknowledgements
No acknowledgement found.References
1.) Multiparametric Renal Magnetic Resonance Imaging: Validation, Interventions, and Alterations in Chronic Kidney Disease. Cox EF, Buchanan CE, Bradley CR, Prestwich B, Mahmoud H, Taal M, Selby NM, Francis ST. Front Physiol. 2017 Sep 14;8:696.
2.) Buchanan CE, Cox EF, Francis ST, editors. Evaluation of readout schemes for Arterial Spin Labelling in the Human Kidney. Int Soc Mag Reson Med; 2015.
3.) Hueper K, Gutberlet M, Rong S, et al. Acute Kidney Injury: Arterial Spin Labeling to Monitor Renal Perfusion Impairment in Mice—Comparison with Histopathologic Results and Renal Function. Radiology, 2013;270:117-124
Figures