4599
Analysis of kidney function and therapy monitoring with DCE-MRI in a murine model of septic shockClaudia Weidensteiner1, Wilfried Reichardt1, Joachim Struck2, Anne Kirchherr3, Katja Wagner4, Florian Wagner4, and Dominik von Elverfeldt1
1Dept. of Radiology, Medical Physics, Medical Center University of Freiburg, Faculty of Medicine, University of Freiburg, Freiburg, Germany, 2AdrenoMed AG, Hennigsdorf, Germany, 3nanoPET Pharma GmbH, Berlin, Germany, 4Institute of Anesthesiological Pathophysiology and Process Engineering, University Hospital Ulm, Ulm, Germany
Synopsis
DCE-MRI with a 3D spoiled gradient echo sequence and injection of Gd-DTPA was used to analyze the kidney function in mice during septic shock (cecal ligation and puncture CLP model). Gd concentration time courses were analyzed without pharmacokinetic modelling. In renal cortex and medulla of septic mice a slower exponential decay compared to baseline or even non-exponential curve shapes were observed. In most septic mice there was no Gd accumulation in the urine in the bladder. Treatment with an antibody targeting adrenomedullin (a vasodilatory peptide) resulted in a faster half-life of tracer elimination in the kidneys compared to vehicle-treatment.
Introduction
Septic shock, the most severe level of sepsis, is the leading cause of death in intensive care units. Its hallmark is severe hypotension that results in collapse of microcirculation and multiple organ (including kidney) failure. Adrenomedullin (ADM), a vasodilatory peptide, has been found to play a key role in the progression of the disease. In order to monitor kidney function in septic mice under treatment with an anti-ADM antibody1, we aim to implement a dynamic contrast enhanced (DCE) MRI protocol covering both kidneys and bladder and to apply a simple analysis of contrast agent clearance.Methods
The experiments were performed on 18 male C57BL/6J mice using the cecal ligation and puncture (CLP) model of sepsis2. In anesthetized mice the cecum is punctured so that fecal contents leak into the peritoneum leading to sepsis. Immediately after CLP surgery mice were treated either with vehicle (saline, n=8) or an anti-ADM antibody (AB-treated, Adrecizumab, n=10). DCE-MR images were acquired prior to surgery (pre-CLP) and at 9 h post-CLP on a 9.4 T animal scanner (Bruker BioSpec 94/20) using a birdcage resonator. A 3D spoiled gradient-echo (SPGR) sequence was used to monitor contrast agent (CA) uptake in kidneys and bladder. 100 scans were acquired with a temporal resolution of 8.8 s (coronal orientation, field of view 30 mm x 30 mm x 20 mm, matrix size 128x96x12, TE/TR 2.0/5.0 ms, flip angle 16 deg.) before and after i.v. injection (via catheter) of the CA GadoSpin M (GdDTPA, nanoPET Pharma GmbH) at a dose of 0.1 mmol Gd/kg bodyweight. CA injection failed in 2 septic mice. A prescan series of SPGR images with incrementing flip angles was acquired to measure native T1. CA concentration curves C(t) were calculated from the change in 1/T1 after CA injection in one kidney (cortex, medulla, pelvis) and in the bladder. The C(t) curves were analyzed without pharmacokinetic modelling. The C(t) curves were subdivided into ones with exponential decay and ones with non-exponential curve shapes. A monoexponential fit was successfully performed for the first 20 data points of the wash-out phase in the exponential curves yielding a half-life, t1/2, that describes the rate of contrast agent clearance3Results
In healthy mice (pre-CLP), the obtained CA concentration curves C(t) were similar for all animals. Immediately after CA injection, a steep increase followed by an exponential decay was observed in the renal cortex and medulla. In the bladder, the CA concentration showed a steady increase with time. The pelvis showed a signal void (Fig. 1). Post-CLP, the shapes of the renal cortex and medulla curves varied from one animal to another irrespective of the animal group (vehicle- and AB-treated mice). Some curves showed an exponential decay, while others displayed “abnormal” kinetics without an exponential decay (3 out of 9 AB-treated, 3 out of 7 vehicle-treated, Fig. 2). In most post-CLP kidneys there was no signal void in the pelvis. CA was detected in urine in the bladder in 2 out of 9 AB-treated mice and in 1 out of 7 control mice. Pre-CLP, t1/2 was similar in medulla and cortex. Post- compared to pre-CLP, t1/2 was found to be higher (apart from AB-treated cortex). AB-treatment resulted in a shorter t1/2 compared to vehicle-treatment (Fig. 3).Results and Discussion
In this study, we used a simple approach to monitor kidny function in septic animals through analysis of the shape of the C(t) curves in the kidney (cortex and medulla) and in the bladder. Since the spatial resolution and coronal orientation of the dynamic MR images did not allow precise measurement of individual arterial input functions, we were unable to perform CA kinetic modelling. However, this simple method enabled detection of changes in the CA clearance after induction of sepsis. Changes in the CA kinetics in septic animals may be caused by changes in the blood pressure, blood flow and volume of kidney vasculature or by changes in glomerular filtration. Post-CLP, CA renal clearance was clearly hampered resulting in a slower wash-out in the renal cortex and medulla (as measured by t1/2), a delayed appearance or absence of CA in the bladder, and less CA accumulation in the kidney pelvis (no signal void due to lower T2*-effect). These observations indicate impairment in glomerular filtration and corroborate results obtained in a non-dynamic contrast-enhanced MRI study in CLP mice4. In septic animals “abnormal” CA kinetics were observed in both vehicle-treated and AB-treated mice and may be related to variations in the severity of the disease (histological analysis is ongoing). Septic animals displaying an exponential decay in the C(t) curves showed a shorter t1/2 for the AB-treated group compared to the vehicle-treated group indicating improved kidney function after treatment.Acknowledgements
No acknowledgement found.References
- Struck J, Hein F, Karasch S, Bergmann A. Epitope specificity of anti-Adrenomedullin antibodies determines efficacy of mortality reduction in a cecal ligation and puncture mouse model. Intensive Care Med Exp 2013; 1.
- Rittirsch D, Huber-Lang MS, Flierl MA, Ward PA. Immunodesign of experimental sepsis by cecal ligation and puncture. Nat Protoc. 2009;4(1):31-6.
- Laurent D, Poirier K, Wasvary J, Rudin M. Effect of essential hypertension on kidney function as measured in rat by dynamic MRI. Magn Reson Med 2002; 47:127–134.
- Dear JW, Kobayashi H, Jo S-K, Holly MK, Hu X, Yuen PST, Brechbiel MW, Star RA. Dendrimer-enhanced MRI as a diagnostic and prognostic biomarker of sepsis-induced acute renal failure in aged mice. Kidney Int 2005; 67:2159–2167.
Figures
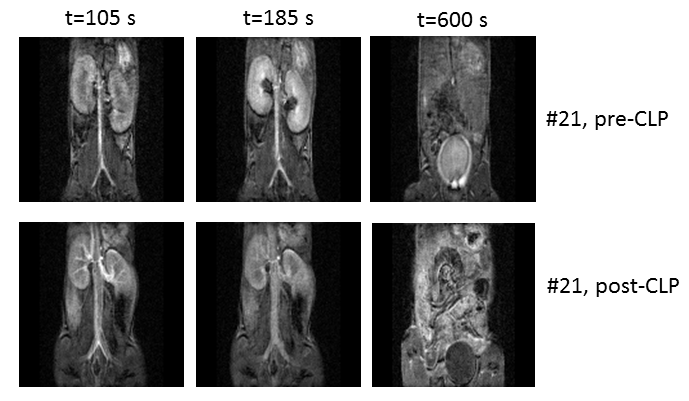
Fig 1: DCE-MR images in the same mouse pre-CLP and
post-CLP during sepsis (anti-ADM antibody
treatment). Pre-CLP, the enhancement of the cortex is visible shortly after
contrast agent injection (t=105 s). At t=185 s the medulla is enhanced and
there is a signal void in the pelvis. The urine in the bladder is enhanced (t=600
s). Post-CLP, the medulla is less bright, there is no signal void in the
pelvis, the urine in the bladder is dark.
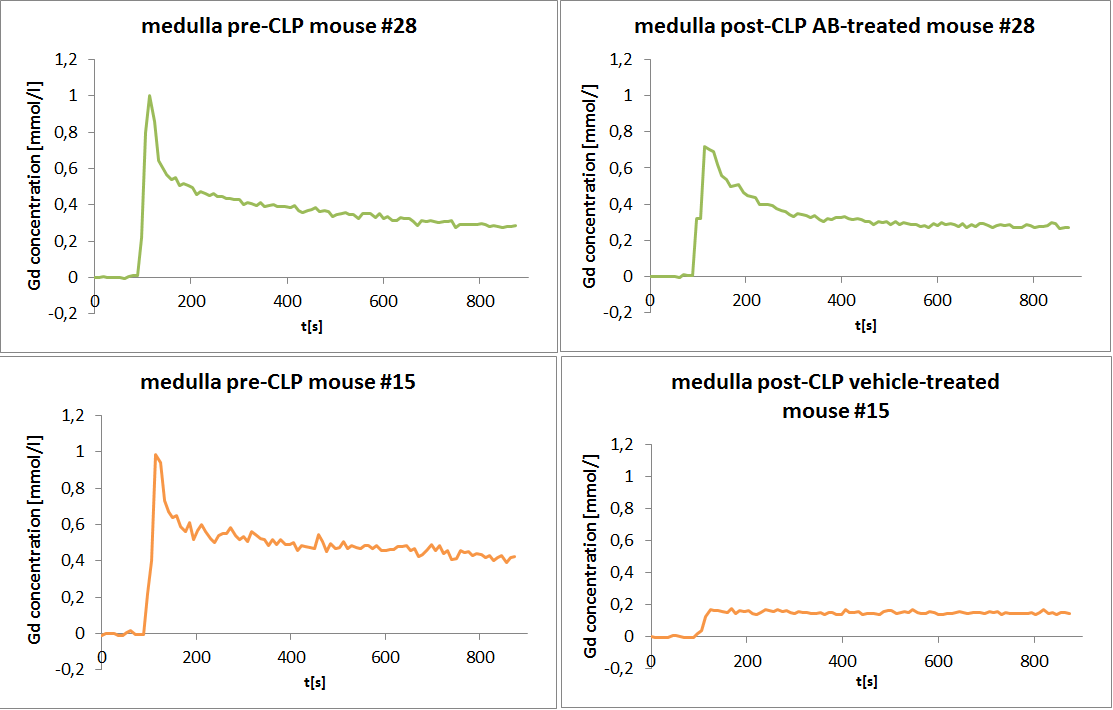
Fig. 2: Gd concentration time
courses in kidney medulla. Mouse #28 (green, anti-ADM antibody treatment) shows exponential tracer kinetics both pre- and post-CLP, with a slower decay during
sepsis. The time course in mouse #15 (orange, vehicle treatment) changed to a non-exponential curve
shape (plateau) post-CLP.
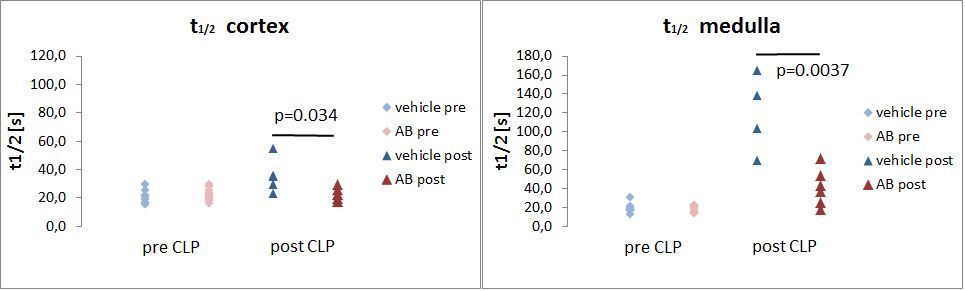
Fig. 3: Half-life t1/2
of contrast agent elimination in renal cortex and medulla in healthy mice (pre-CLP) and during sepsis (post-CLP). Mice were treated post-CLP with vehicle (blue)
or with anti-ADM antibody (red). Vehicle-treated mice showed a slower
elimination (unpaired t-test) than antibody-treated mice. t1/2 was not calculated for non-exponential time
courses.