4596
Multiparametric MRI Data in Diabetic Nephropathy: Correlation with eGFR and eGFR_slope1NorthShore University HealthSystem, Evanston, IL, United States, 2University of Chicago, Chicago, IL, United States
Synopsis
BOLD, Diffusion and ASL MRI are useful in the evaluation of renal oxygenation, fibrosis and blood flow. In this study, these three functional MRI data were acquired in patients with diabetic nephropathy (DN) patients and stage-3 chronic kidney disease (CKD). For the first time, we report that the cortical blood flow and response to furosemide in renal medulla are significantly correlated with yearly rate of change in eGFR. These relationships were independent of any correlations observed with eGFR. The correlations with eGFR seem to depend on whether a control group was included.
INTRODUCTION
Diabetic nephropathy is a progressive kidney disease which accounts for about 40% of new cases of end stage of renal disease (ESRD) [1]. It is also known that only about half of subjects with stage 3 chronic kidney disease (CKD) will progress to ESRD over 10 years [2]. Over the last decade, the role of chronic hypoxia in the progression of CKD has gained attention mostly based on pre-clinical data [3]. Blood oxygenation level dependent (BOLD) MRI is the only known non-invasive method currently available to evaluate relative oxygenation status of the kidney. Chronic hypoxia theory also suggests the cause for the increased hypoxia is due to reduced blood supply. Arterial spin labeling (ASL) based renal perfusion MRI has shown reduced blood flow in CKD [4, 5]. Hypoxia triggers fibrogenesis which is known to be the hall mark of progressive CKD [6]. Apparent diffusion coefficient (ADC) has been shown to strongly correlate with histological measures of renal fibrosis [7].
A study with the largest number of subjects to-date showed no correlation between BOLD MRI measures and eGFR [8]. This study did not include a control group. Other studies that did report significant correlation [9-11], all included a control group. Here, we present renal functional MRI data from a study of patients with diabetic nephropathy and compare their correlations with eGFR, when a control group was included or not. Further, since chronic hypoxia hypothesis really suggests enhanced hypoxia in people with progressive disease, we additionally correlated the MRI data against the yearly rate of change in eGFR (eGFR_slope).
METHODS
Subjects: All procedures were approved by the institutional review board and written subject consent was obtained. MRI data were acquired in a group of diabetics with stage 3 CKD. Subjects instructed not to take NSAID for 3 days and ACEi/ARB 1 day prior to MRI and to fast after midnight on the day of the MRI. BOLD MRI scan was repeated following administration of furosemide (20 mg, iv.).
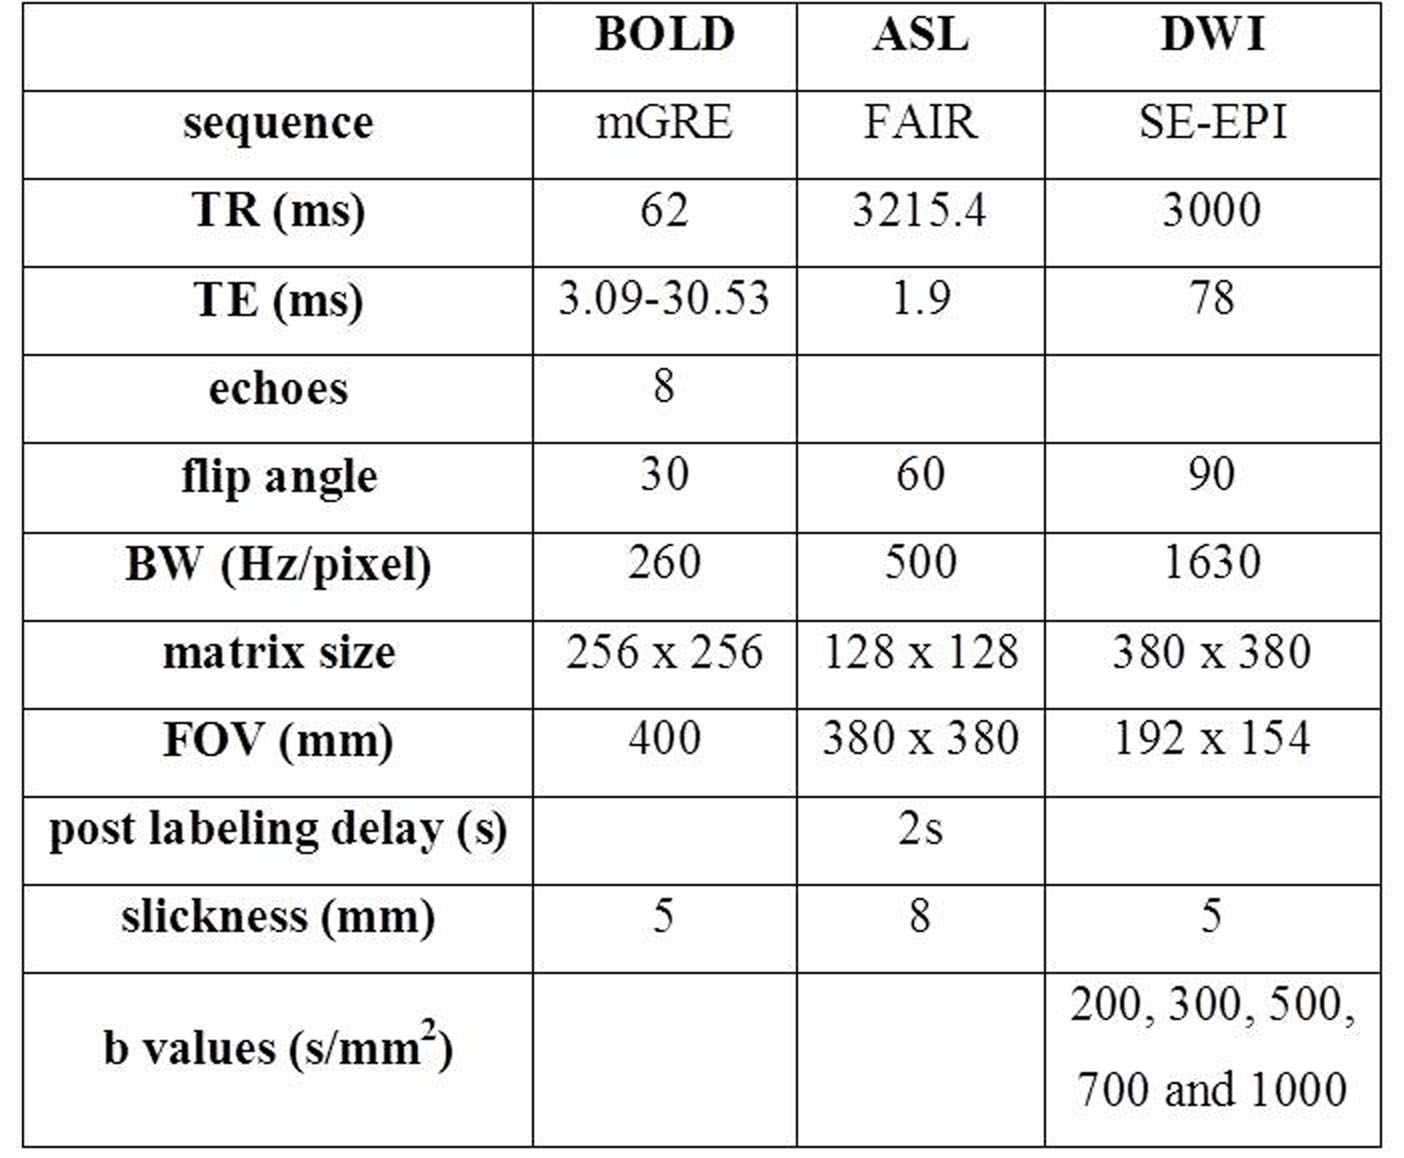
MRI acquisition methods: Table 1 shows the MRI (3.0 T) acquisition parameters used in this study.
MRI analysis methods: Regions of interest were manually defined in entire cortex, medulla or whole kidney on ASL, BOLD R2* and ADC maps. ASL and R2* maps were generated using a custom image processing toolbox using either Matlab (Mathworks, Natic, MA) or Python (Python Software Foundation) respectively.
eGFR slope calculation: Serum creatinine (sCr) levels were used to calculate estimated glomerular filtration rate (eGFR) using CKD-EPI formula. Electronic medical records was used to search for all clinical sCr values for a period of up to 2 years prior to enrollment date and continued past-enrollment. The time range of eGFR readings was 2-7 years (4.4 ± 1.3 years including before and following the MRI). The number of eGFR measurements used in the calculation of eGFR_slope was between 8 to101 (23.3 ± 16.6). A least squares regression methods was used to calculate the eGFR_slope over time, with a negative slope representing a reduction in eGFR over time.
Statistical methods: All analyses were performed using SPSS 19.0 (IBM Corp., Armonk, NY).
RESULTS
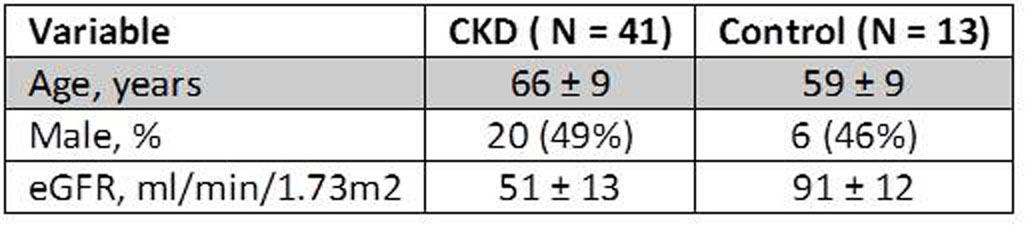
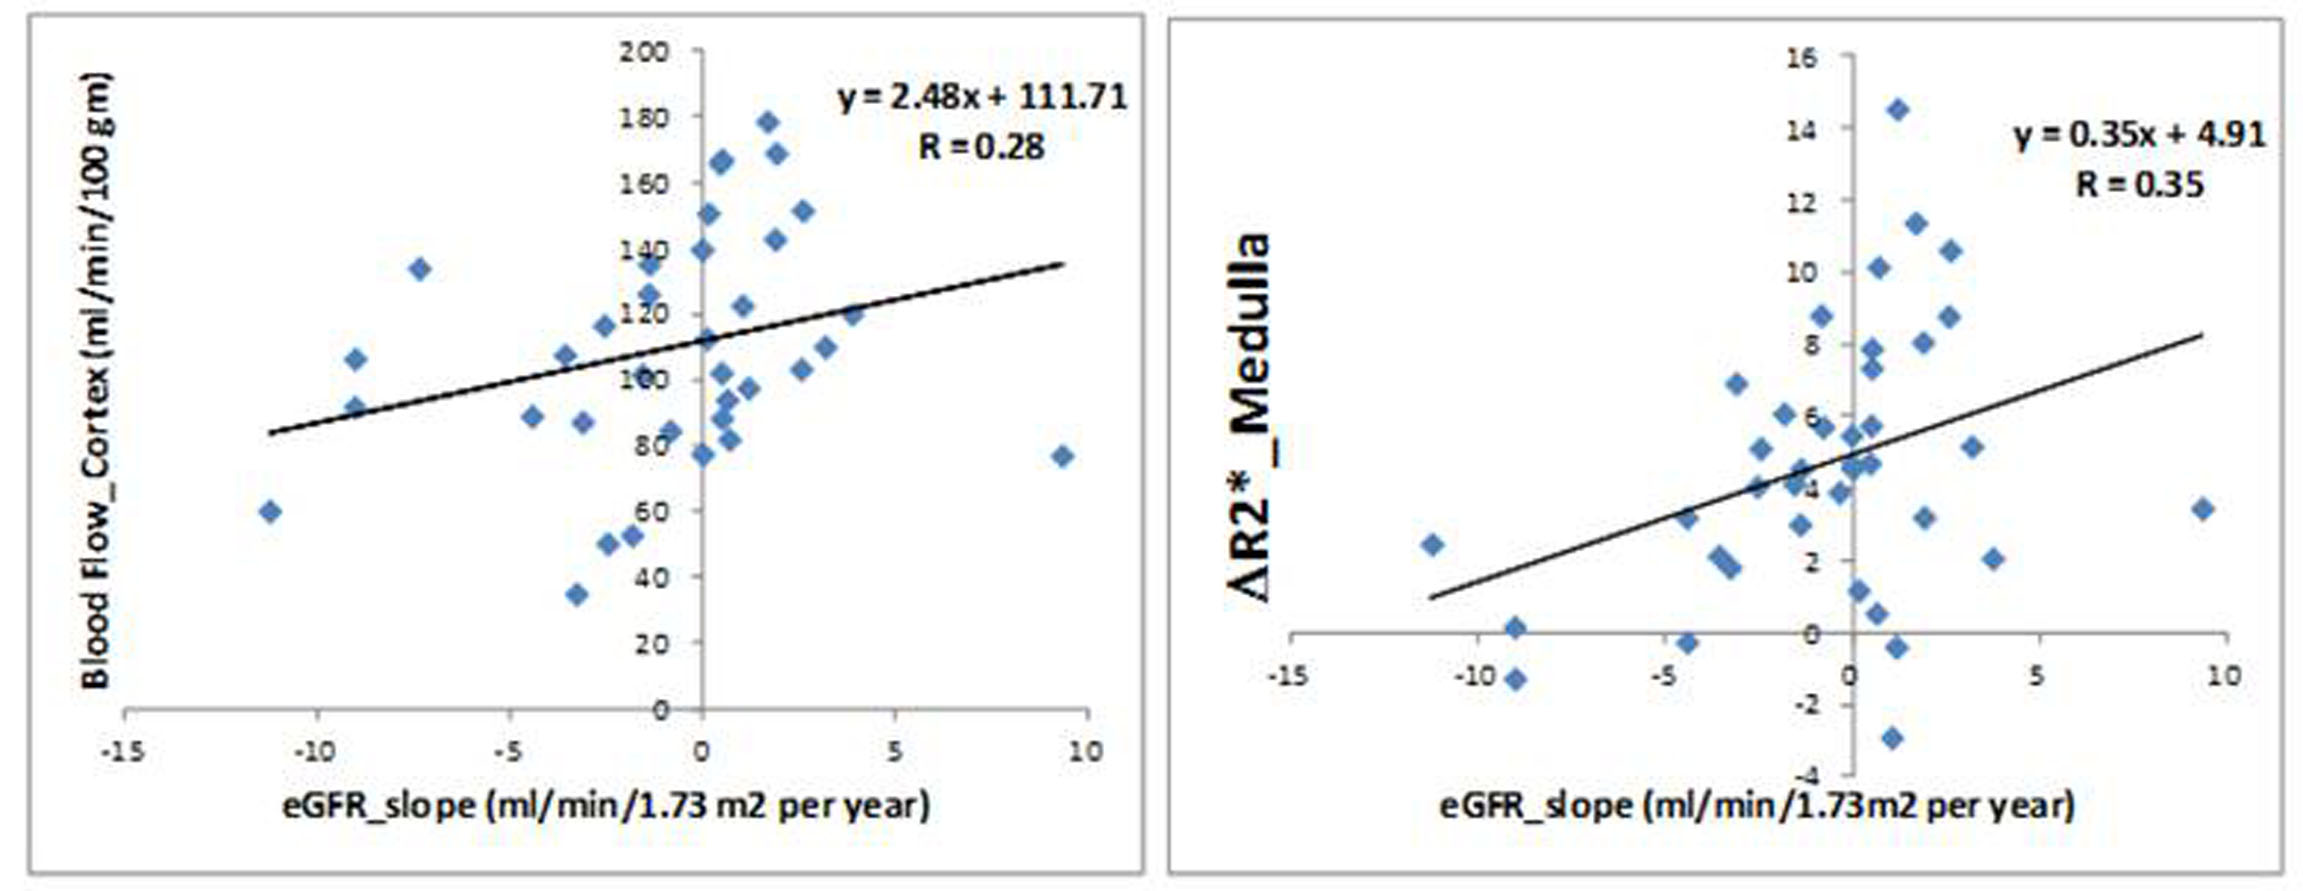
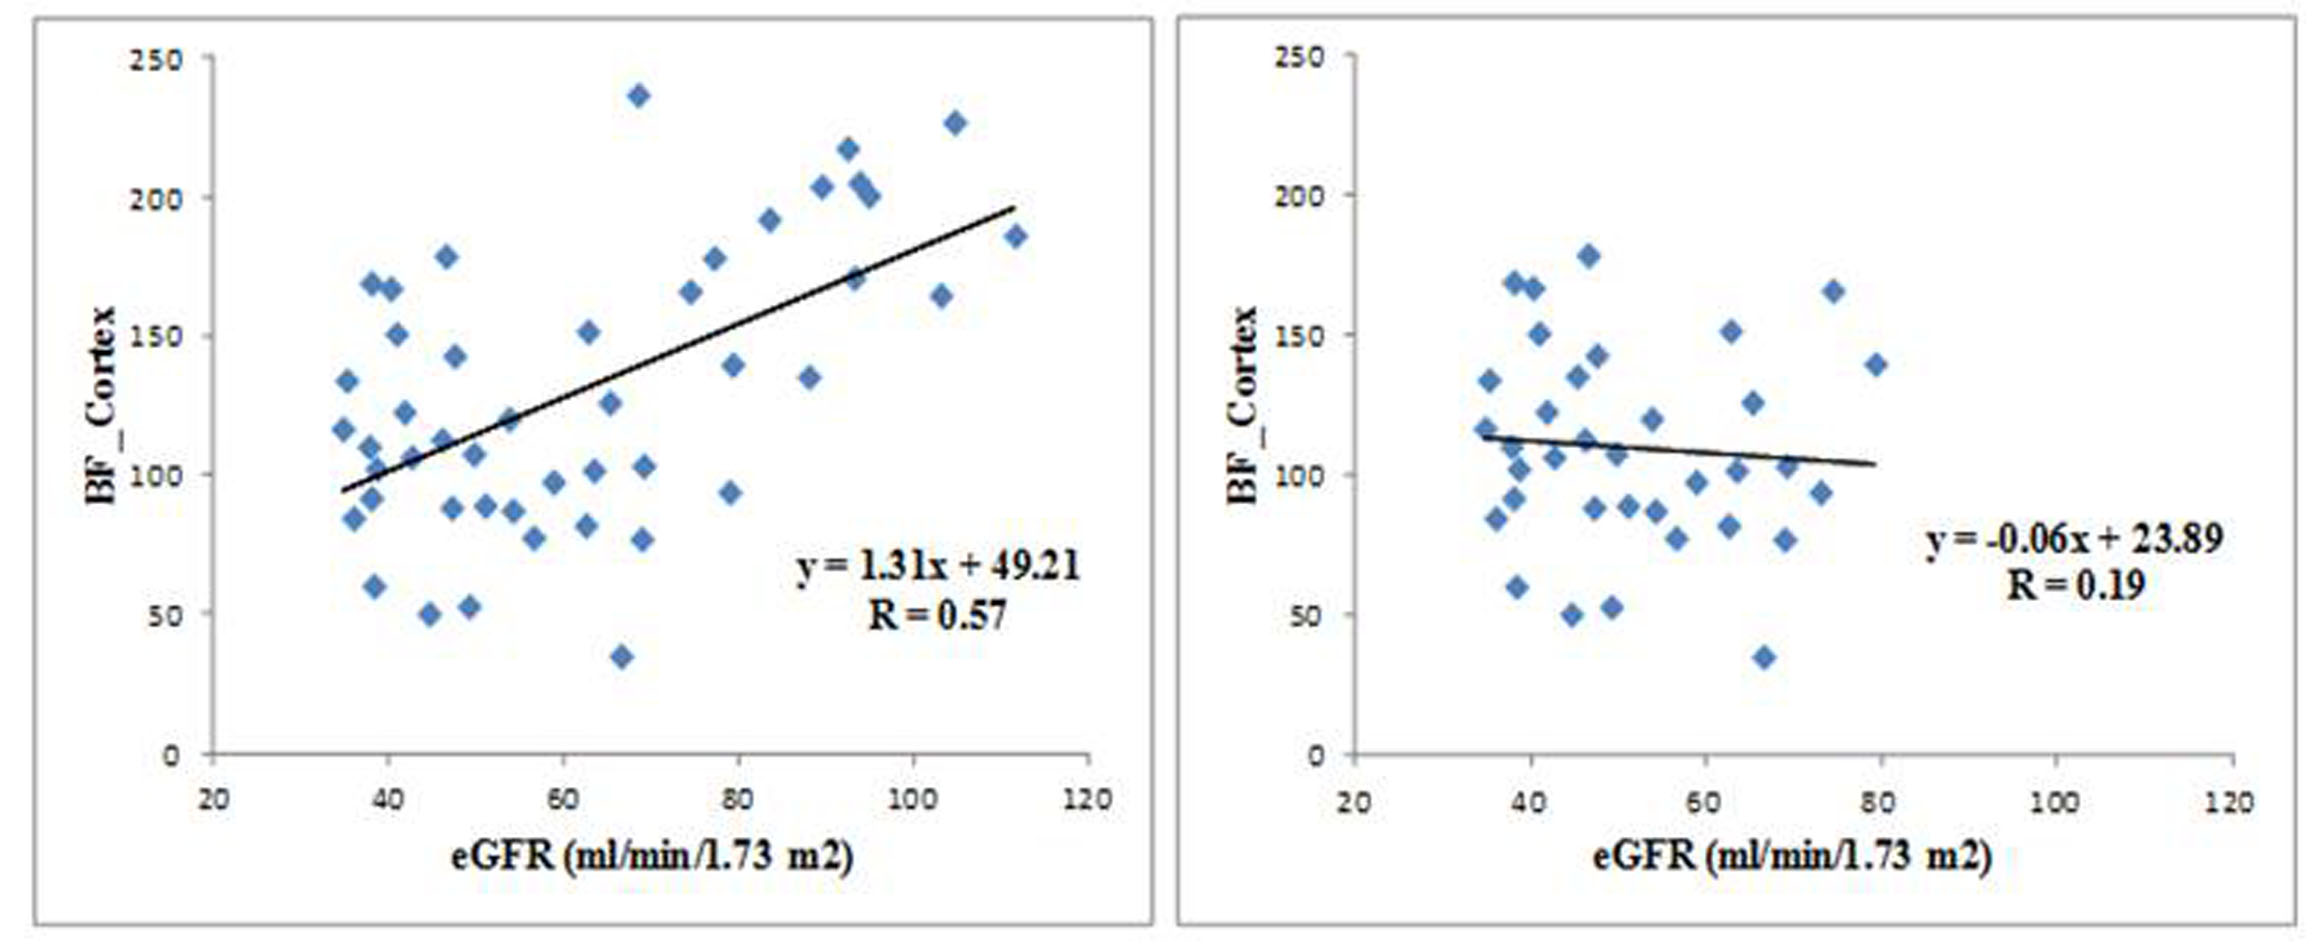
Table 2 shows subjects’ demographic characteristics. Table 3 shows the Spearman correlation between MRI parameters with eGFR and eGFR _slope. Figure 1 shows the correlation between BF_Cortex and ΔR2*_Medulla with eGFR_slope. Figure 2 illustrates the difference in the level of correlation when including a group of healthy controls.DISCUSSION and CONCLUSION
From Table 3 and Figure 2, it is apparent that the level and significance of observed correlation between MRI measurements and eGFR can be quite different when including the control group or not. This may be a reflection of the relative insensitivity of the MRI parameters to eGFR. Reports to-date have shown a significant correlation of cortical R2* with eGFR only when a control group is included [9-11].
A more interesting finding (probably reported for the first time) is that significant correlations were observed with cortical blood flow and yearly rate of change in eGFR (Table 3). A similar relationship was also observed with response to furosemide in the renal medulla and whole kidney ROIs. Low cortical blood flow and smaller change in R2* following furosemide are associated with faster rate of loss of eGFR.
Our results lend preliminary support for the feasibility of using renal functional MRI methods to predict progression. Future studies in larger number of subjects are necessary to further verify this. The BOLD MRI R2* measurements may suffer from poor sensitivity owing to confounding effects of fractional blood volume and hematocrit [12]. Future studies should take these into account to improve sensitivity.
Acknowledgements
Work supported in part by grant from the National Institutes of Health, R01-DK093793. We thank Ms. Shonny Fettman, Claire Feczko, and Sharon Trevino for their help with study coordination.References
1. Molitch ME, D.R., Franz MJ, Keane WF, Mogensen CE, Parving HH, Steffes MW; American Diabetes AssociationMolitch ME, DeFronzo RA, Franz MJ, Keane WF, Mogensen CE, Parving HH, Steffes MW; American Diabetes Association, Nephropathy in diabetes. Diabetes Care, 2004(Suppl 1:): p. S79-83.
2. Baek, S.D., et al., Does stage III chronic kidney disease always progress to end-stage renal disease? A ten-year follow-up study. Scand J Urol Nephrol, 2012. 46(3): p. 232-8.
3. Fine, L.G., C. Orphanides, and J.T. Norman, Progressive renal disease: the chronic hypoxia hypothesis. Kidney Int Suppl, 1998. 65: p. S74-8.
4. Li, L.P., et al., Evaluation of Renal Blood Flow in Chronic Kidney Disease Using Arterial Spin Labeling Perfusion Magnetic Resonance Imaging. Kidney Int Rep, 2017. 2(1): p. 36-43.
5. Mora-Gutierrez, J.M., et al., Arterial spin labeling MRI is able to detect early hemodynamic changes in diabetic nephropathy. J Magn Reson Imaging, 2017.
6. Boor, P. and J. Floege, Chronic kidney disease growth factors in renal fibrosis. Clin Exp Pharmacol Physiol, 2011. 38(7): p. 441-50.
7. Zhao, J., et al., Assessment of renal fibrosis in chronic kidney disease using diffusion-weighted MRI. Clin Radiol, 2014. 69(11): p. 1117-22.
8. Michaely, H.J., et al., Renal BOLD-MRI does not reflect renal function in chronic kidney disease. Kidney Int, 2012. 81(7): p. 684-9.
9. Inoue, T., et al., Noninvasive evaluation of kidney hypoxia and fibrosis using magnetic resonance imaging. J Am Soc Nephrol, 2011. 22(8): p. 1429-34.
10. Prasad, P.V., et al., Multi-Parametric Evaluation of Chronic Kidney Disease by MRI: A Preliminary Cross-Sectional Study. PLoS One, 2015. 10(10): p. e0139661.
11. Yin, W.J., et al., Noninvasive evaluation of renal oxygenation in diabetic nephropathy by BOLD-MRI. Eur J Radiol, 2012. 81(7): p. 1426-31.
12. Zhang, J.L., et al., Measurement of renal tissue oxygenation with blood oxygen level-dependent MRI and oxygen transit modeling. Am J Physiol Renal Physiol, 2014. 306(6): p. F579-87.
Figures