4594
Multiparametric MRI of Folic Acid Induced Renal Pathology in Mice: A Longitudinal Study1Division of Nephrology and Hypertension, Mayo Clinic, Rochester, MN, United States, 2Department of Biochemistry and Molecular Biology, Mayo Clinic, Rochester, MN, United States
Synopsis
Multiparametric MRI was used to assess folic acid-induced renal pathology in mice. Kidney volume, R2*, magnetization transfer ratio (MTR), perfusion, T1, and glomerular filtration rate (GFR) were measured at 2 and 4 weeks post-treatment. While kidney structure (volume and MTR) and hypoxia (R2*) showed progressive deterioration, renal perfusion and normalized GFR dropped dramatically at 2 weeks but recovered slightly at 4 weeks. T1 elevated at 2 weeks and slightly dropped at 4 weeks, suggesting development of transient edema. In conclusion, multiparametric MRI provides a valuable tool for investigation and monitoring of folic acid induced renal pathology.
Introduction
A high dose administration of folic acid in rodents provides a model to study pathophysiology associated with acute renal failure and renal fibrosis1. Renal dysfunction is typically assessed by measurement of serum creatinine and blood urea nitrogen levels2,3. Magnetic resonance imaging (MRI) offers the opportunity for noninvasive and more comprehensive renal assessment. In this study, we aimed to use multiparametric MRI to longitudinally evaluate renal pathology in mice treated with folic acid.Methods
Animals. Fifteen 8-week-old male C57/BL6 mice were used. Ten mice were injected with folic acid dissolved in sodium bicarbonate (37.5mg/mL/0.3 mol/L) at a dose of 200 mg/kg4 and then underwent MRI at 2 (n=10) and 4 (n=5) weeks after treatment. Control mice (n=5) were injected with vehicle solution, after which MRI was performed at 2 weeks.
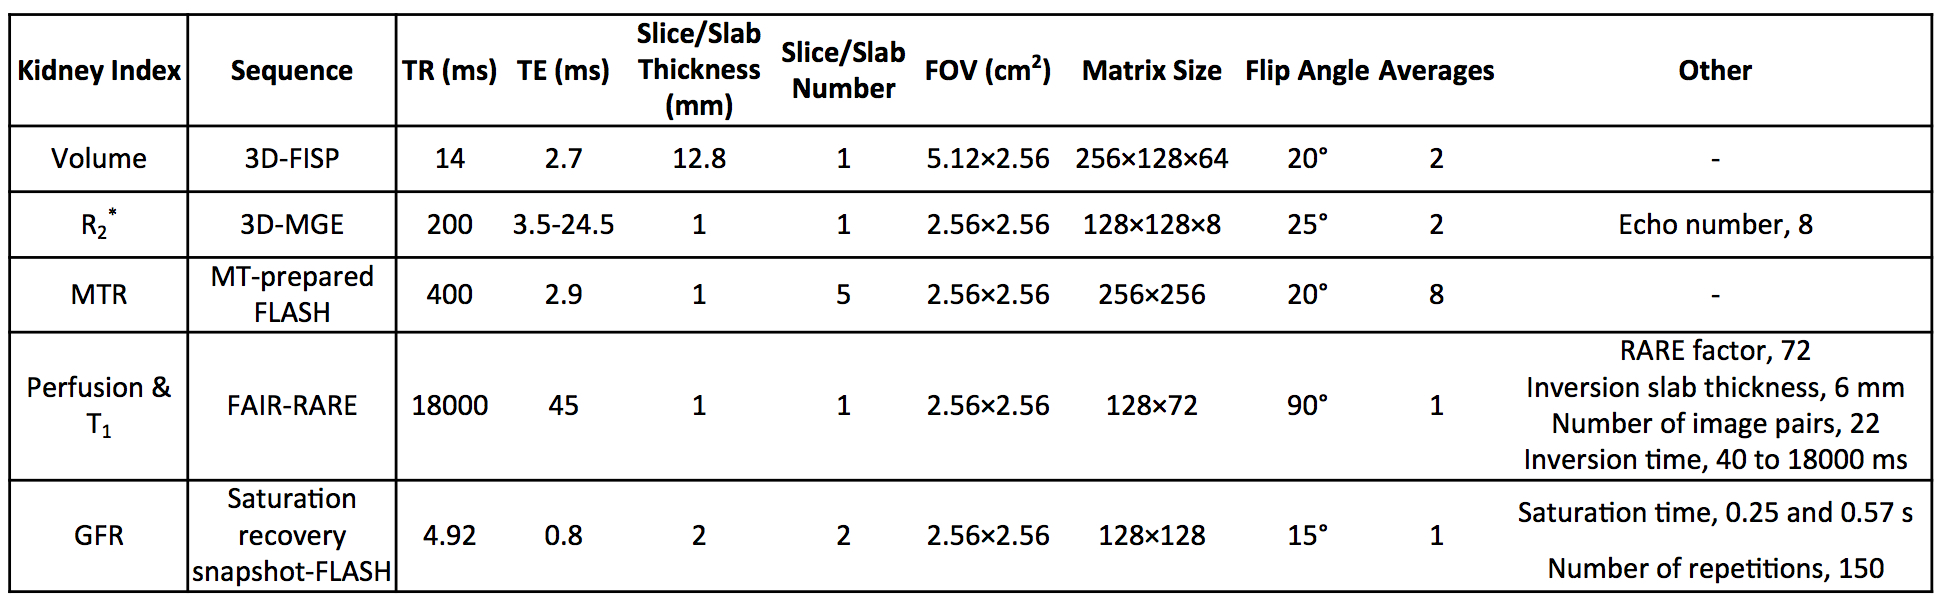
MRI and Image Analysis. MRI studies were performed on a vertical 16.4 T scanner (Bruker, Billerica, MA) equipped with a 38-mm inner diameter birdcage coil. Kidney volume, R2*, magnetization transfer ratio (MTR), perfusion, T1, and glomerular filtration rate (GFR) were measured.
Kidney volume was measured using a three-dimensional (3D) fast imaging with steady precession sequence. Manual segmentation was used for quantification.
R2* was measured using a respiration-gated 3D multi-echo gradient echo sequence. The magnitude of all 3D images was added to generate a single 1-mm 2D image. T2* was quantified by pixel-wise mono-exponential curve fitting on signal intensity over echo times, after which R2* was calculated as 1/T2*.
MTR was measured using an MT-prepared fast-low-angle-shot (FLASH) sequence. Magnetization saturation was achieved using Gaussian pulses with the following parameters: offset frequency 1500Hz; pulse power 10μT; pulse length 9.13ms; pulse bandwidth 300Hz; flip angle 585°; pulse number 2. Images without (M0) and with (Mt) MT pulses were acquired and MTR map was calculated as (M0-Mt)/M0.
Renal perfusion and T1 were measured using a flow-sensitive alternating inversion recovery sequence with rapid acquisition with relaxation enhancement. The magnitude images were used to generate the global and slice-selective T1 maps by pixel-wise mono-exponential fitting, from which renal perfusion map was generated, as described previously5.
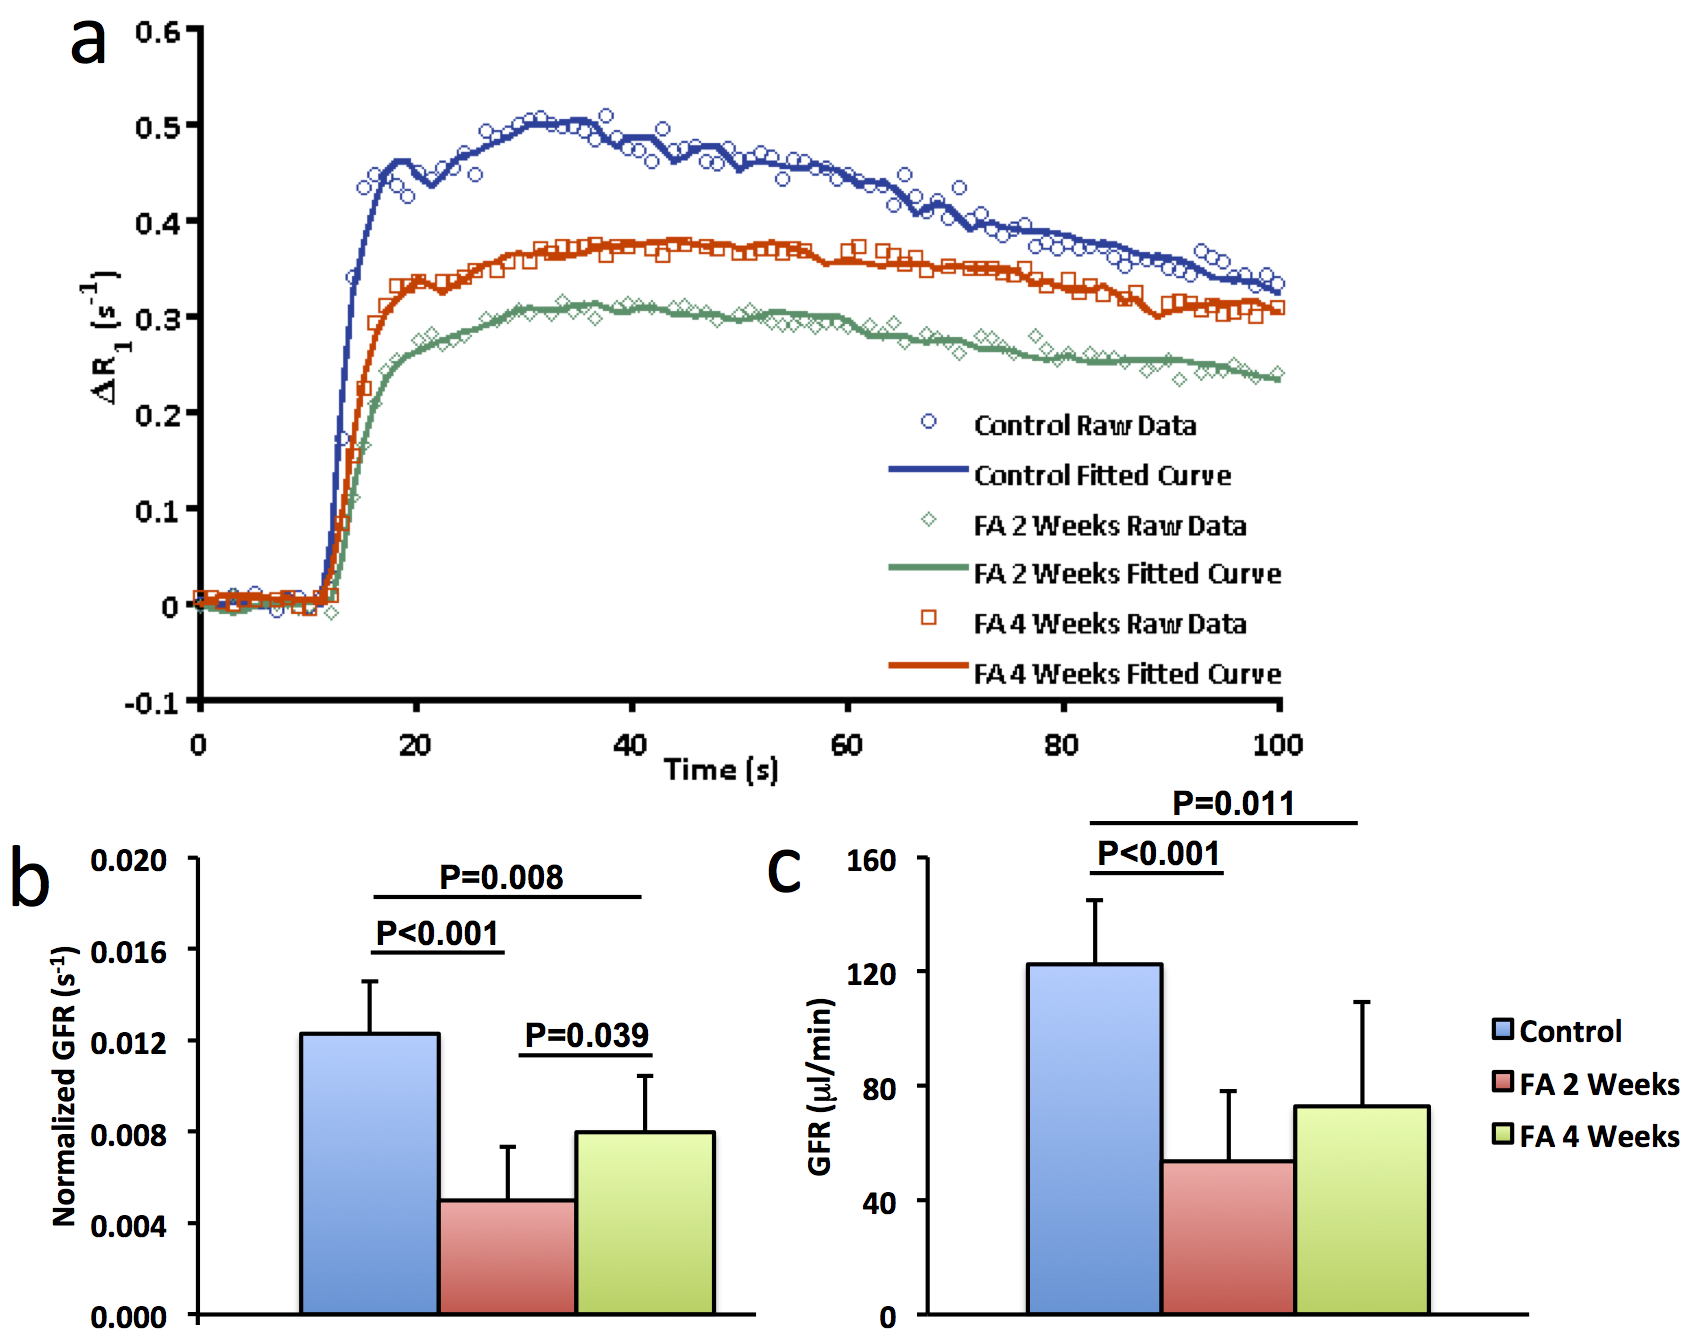
GFR was measured using our previously developed dynamic contrast-enhanced MRI method6. A fast saturation recovery T1 measurement method with snapshot-FLASH readout was used to trace gadolinium (Gd) dynamics at 1sec/scan. Following acquisition of the proton density and ten baseline T1-weighted images, 37.5mM gadodiamide (0.03mmol/kg) was injected through the tail-vein within 2s, after which the T1-weighted images were acquired repetitively. T1 measurement was performed by a two-point mono-exponential fitting and the change in R1 (ΔR1) from baseline was used as an index of Gd concentration. Dynamic curves were model-fitted to quantify normalized GFR, after which GFR was calculated as the product of normalized GFR and kidney volume.
Specific imaging parameters of these measurements are shown in Fig. 1.
Histology. Mice were euthanized at 2 (n=5) or 4 (n=5) weeks with kidneys harvested and fixed. Trichrome staining was performed on 5-μm axial slices of tissue. Fibrosis was quantified as the fraction of fibrotic area over the total cross sectional area of the tissue.
Results
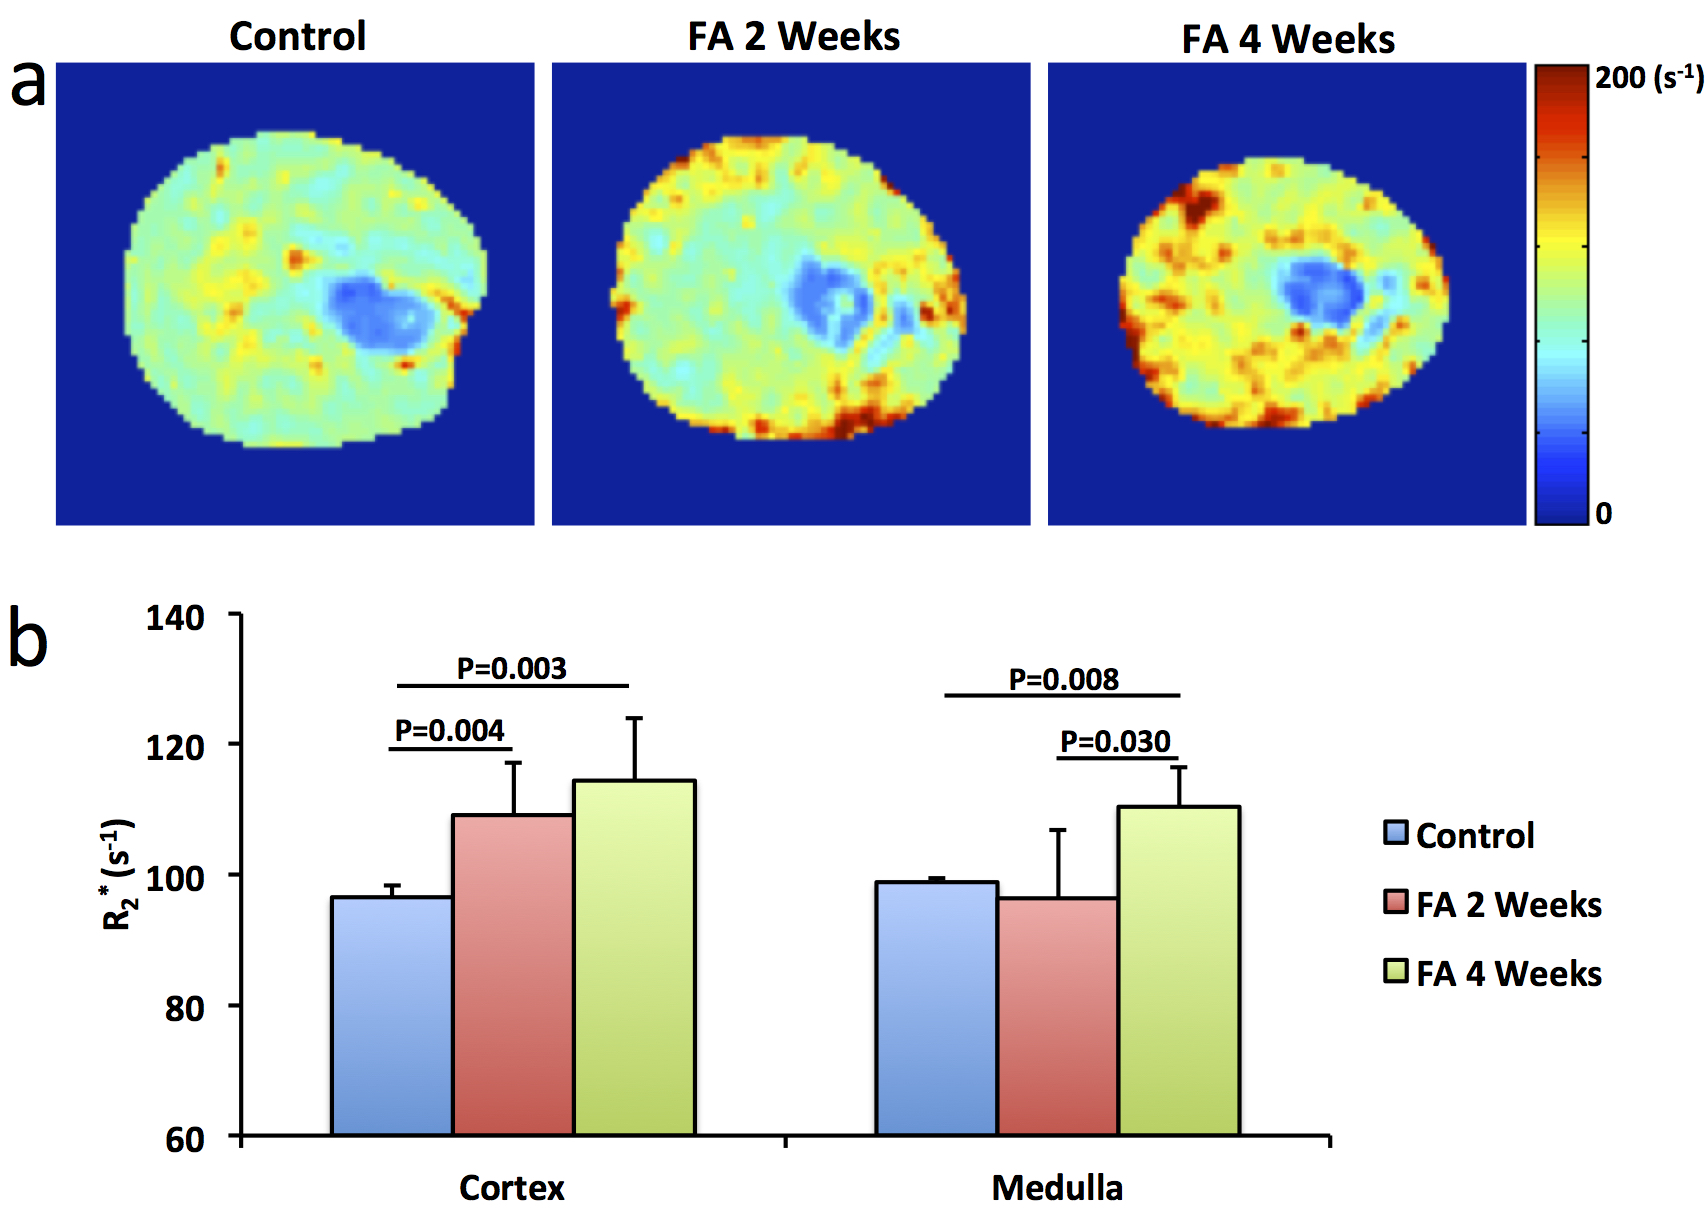
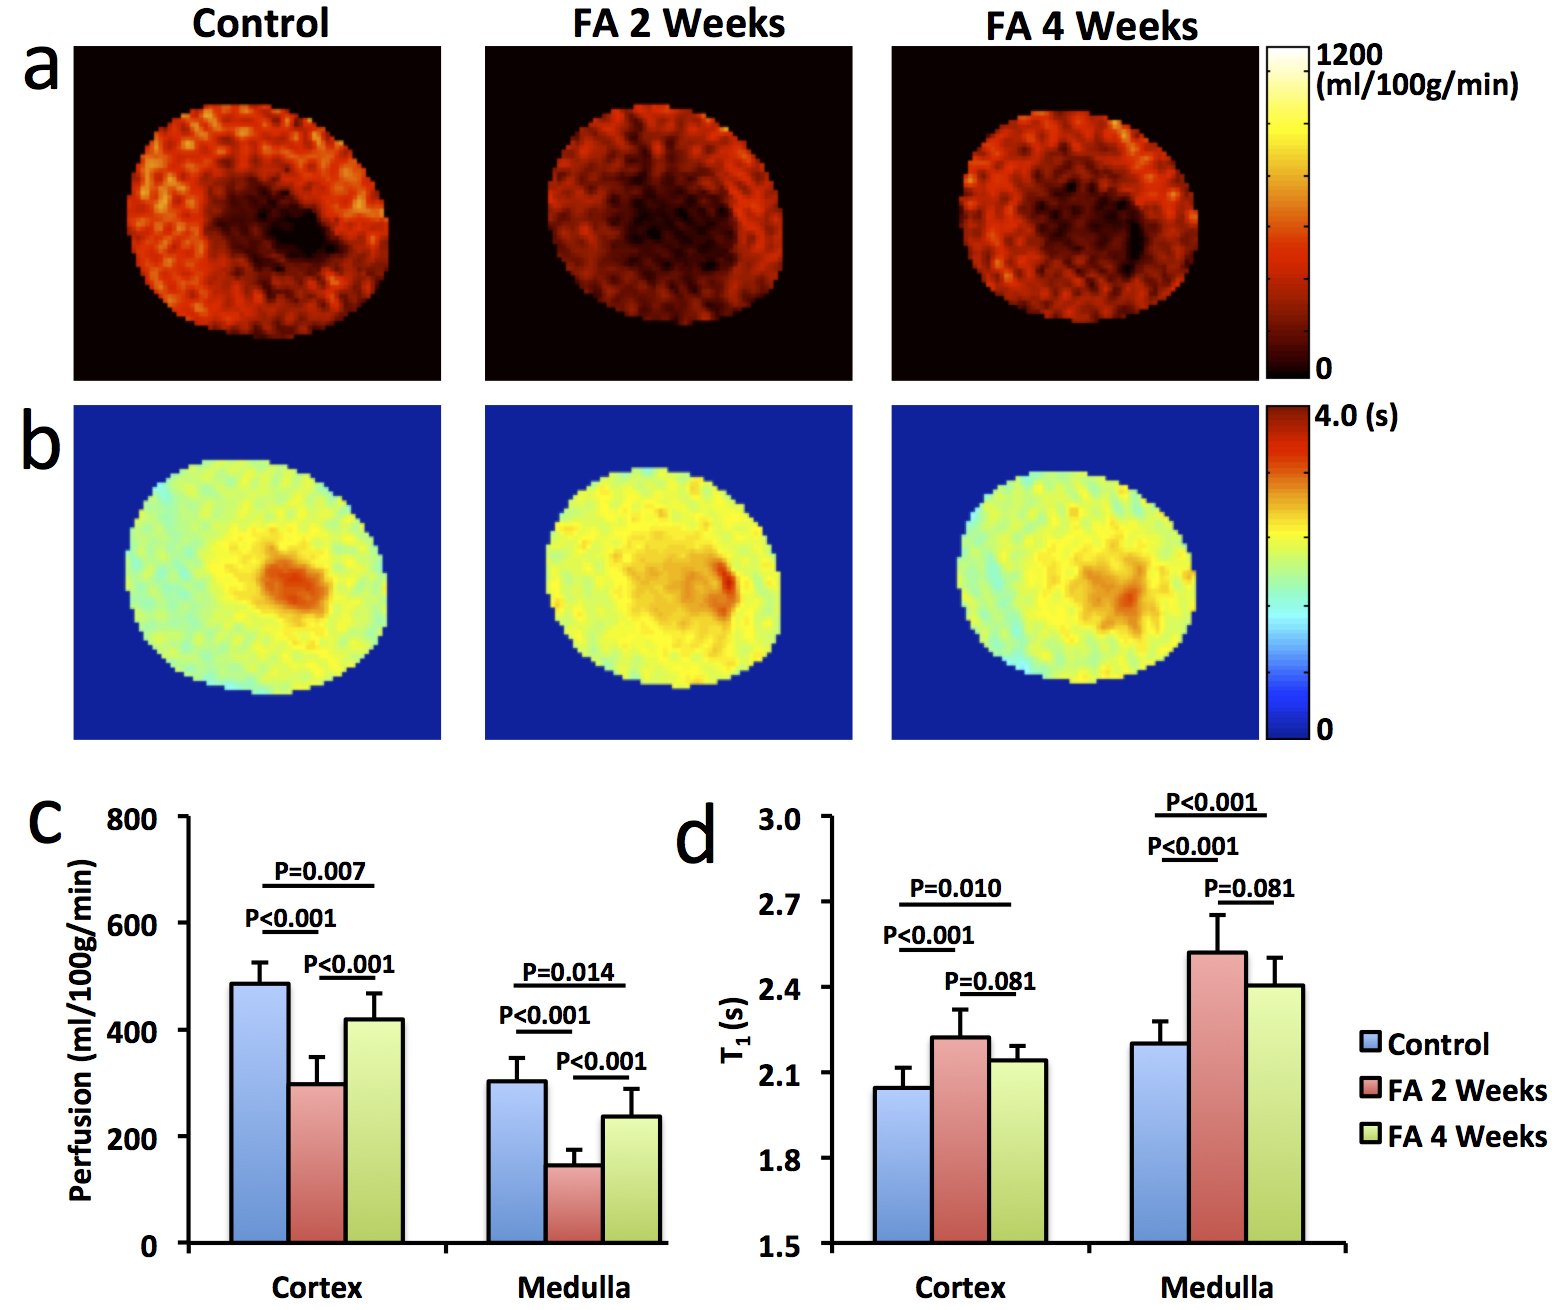
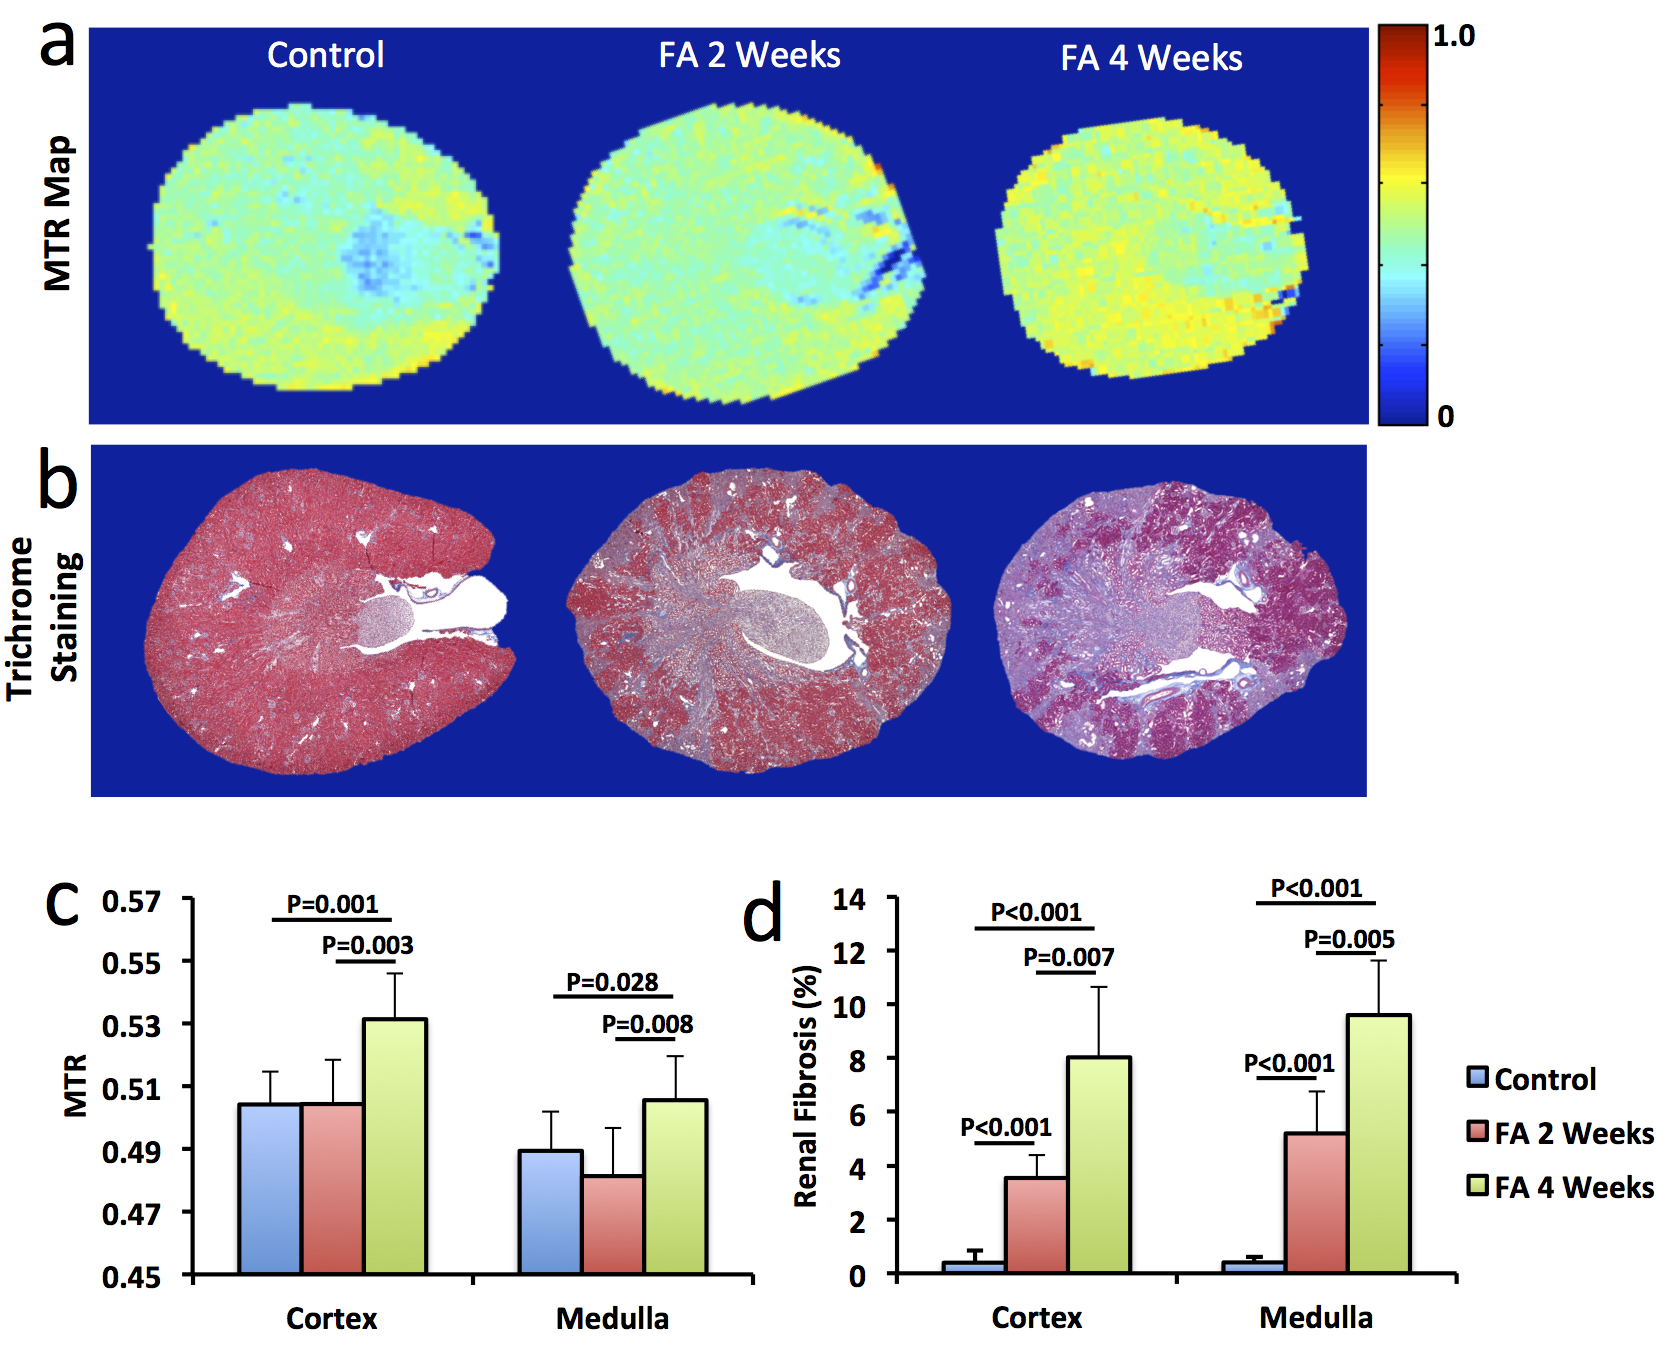
Significantly smaller kidneys in folic acid-treated mice were observed at 4 weeks compared to controls (151±31 vs. 185±7 μL, P=0.01). R2* showed patchy enhancement in renal cortex at 2 weeks and global increase at 4 weeks (Fig. 2), indicating progression of tissue hypoxia. Renal perfusion dropped markedly at 2 weeks but showed mild recovery at 4 weeks (Fig. 3 a&c). T1 elevated at 2 weeks and showed a trend of decrease at 4 weeks (Fig. 3 b&d), suggesting development of transient edema. Representative DCE-MRI raw data and model-fitted Gd dynamics are shown in Fig. 4a. In the folic acid kidneys, dynamic curves showed highest attenuation at 2 weeks and mild recovery at 4 weeks, resulting in an initial decrease and then slight increase in normalized GFR (Fig. 4b). Such biphasic changes in renal perfusion and normalized GFR indicated an initial acute kidney injury, followed by renal regeneration and recovery process. Representative MTR maps and trichrome staining kidney sections are shown in Fig. 5a and b, respectively. Folic acid induced patchy necrosis and mild interstitial fibrosis at 2 weeks, which exacerbated at 4 weeks (Fig. 5b&d). However, MTR detected no change at 2 weeks possibly due to concurrent edema, but increased significantly at 4 weeks (Fig. 5a&c).Conclusion
In conclusion, multiparametric MRI provides a valuable tool for investigation and monitoring of folic acid induced renal pathology and may provide a useful tool for assessment of therapeutic strategies.Acknowledgements
This study was partly supported by National Institutes of Health Grants DK104273, DK102325, DK73608, and HL123160.References
1. Gupta A, Puri V, Sharma R, Puri S. Folic acid induces acute renal failure (ARF) by enhancing renal prooxidant state. Exp Toxicol Pathol 2012;64:225-232.
2. Cheng CW, Rifai A, Ka SM, Shui HA, Lin YF, Lee WH, Chen A. Calcium-binding proteins annexin A2 and S100A6 are sensors of tubular injury and recovery in acute renal failure. Kidney Int 2005;68:2694-2703.
3. Ortega A, Ramila D, Izquierdo A, Gonzalez L, Barat A, Gazapo R, Bosch RJ, Esbrit P. Role of the renin-angiotensin system on the parathyroid hormone-related protein overexpression induced by nephrotoxic acute renal failure in the rat. J Am Soc Nephrol 2005;16:939-949.
4. Street JM, Souza AC, Alvarez-Prats A, Horino T, Hu X, Yuen PS, Star RA. Automated quantification of renal fibrosis with Sirius Red and polarization contrast microscopy. Physiol Rep 2014;2.
5. Jiang K, Ferguson CM, Ebrahimi B, Tang H, Kline TL, Burningham TA, Mishra PK, Grande JP, Macura SI, Lerman LO. Noninvasive Assessment of Renal Fibrosis with Magnetization Transfer MR Imaging: Validation and Evaluation in Murine Renal Artery Stenosis. Radiology 2017;283:77-86.
6. Jiang K, Tang H, Mishra PK, Macura SI, Lerman LO. Measurement of Murine Single-Kidney Glomerular Filtration Rate Using Dynamic Contrast-Enhanced MRI. Magn Reson Med 2017.
Figures