4593
Feasibility of Renal ASL in a Paediatric Cohort with Impaired Renal Function1Developmental Imaging and Biophysics Section, UCL Great Ormond Street Institute of Child Health, London, United Kingdom, 2National Hospital for Neurology and Neurosurgery, Lysholm Department of Neuroradiology, London, United Kingdom, 3UCL Institute of Neurology, Department of Brain Repair and Rehabilitation, London, United Kingdom
Synopsis
Arterial Spin Labelling (ASL) allows for non-invasive measurements of tissue perfusion. As such, it presents an attractive alternative to contrast-enhanced based methods for quantification of renal perfusion, particularly in populations with impaired renal function. In this work, we assess the feasibility of ASL in a paediatric cohort with severe kidney disease by combining a robust acquisition scheme with an optimised retrospective motion correction approach.
Introduction
Arterial Spin Labelling harnesses blood water as a freely diffusible tracer to allow for a non-invasive assessment of tissue perfusion. As such, it is particularly suited for subjects with impaired renal function where contrast agents are typically contra-indicated. However, technical challenges such as sensitivity to movement and low SNR still limit widespread use of ASL in the clinic. In this work, we assess the feasibility of ASL in a paediatric cohort with severe kidney disease by combining a robust acquisition scheme with an optimised retrospective motion correction approach.Methods
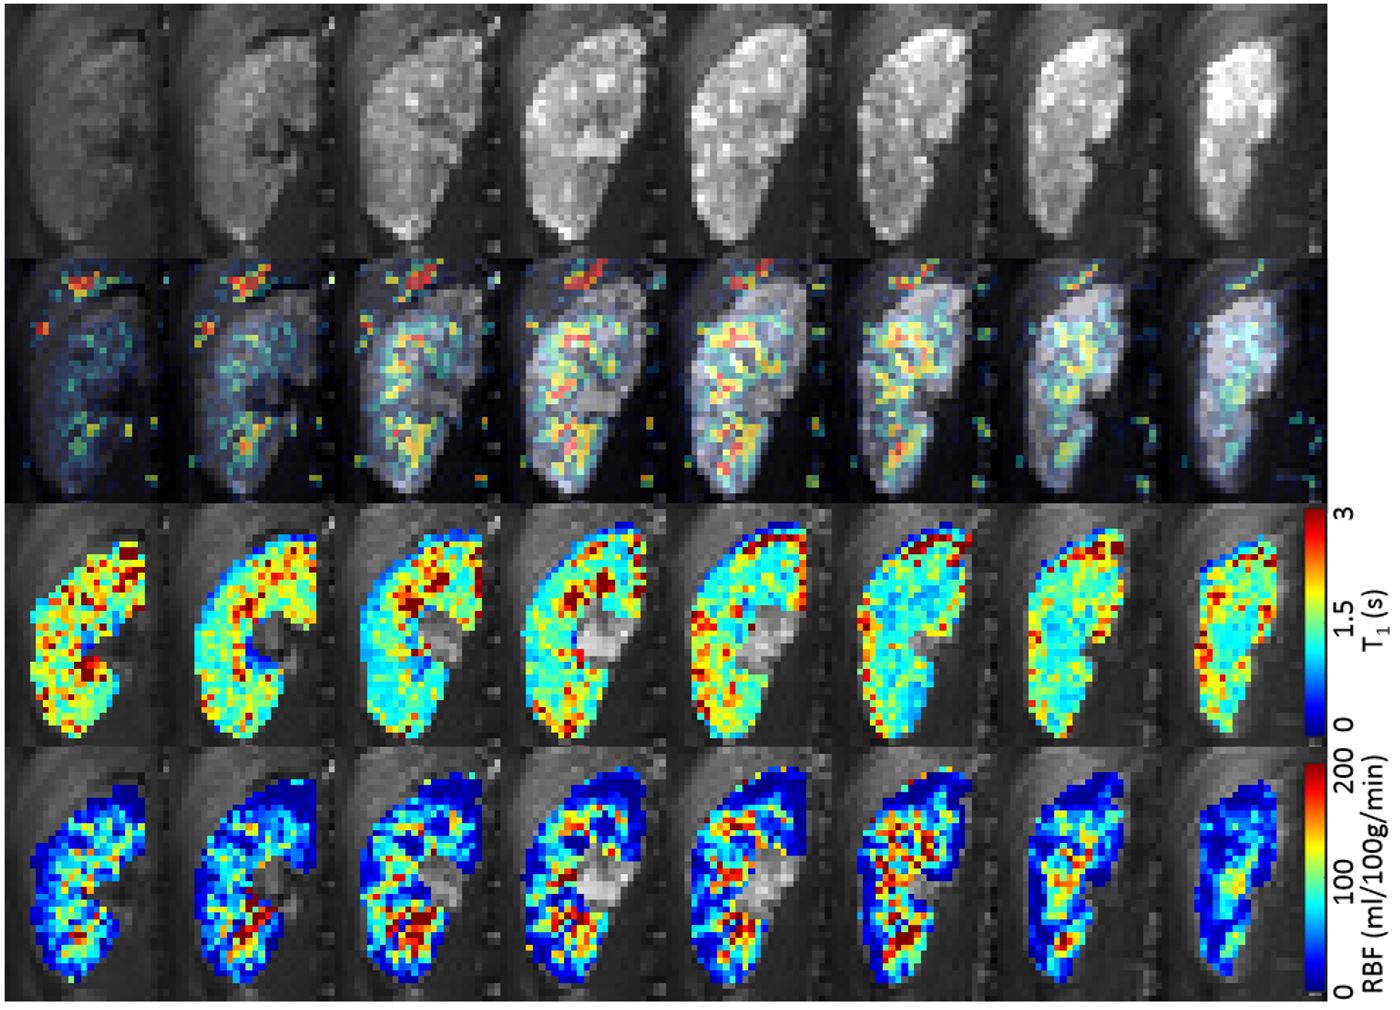
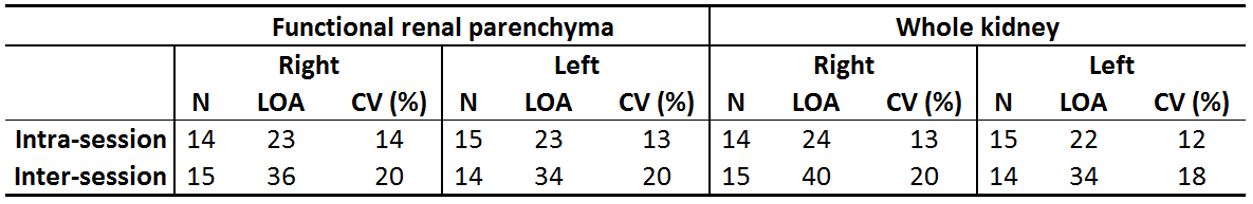
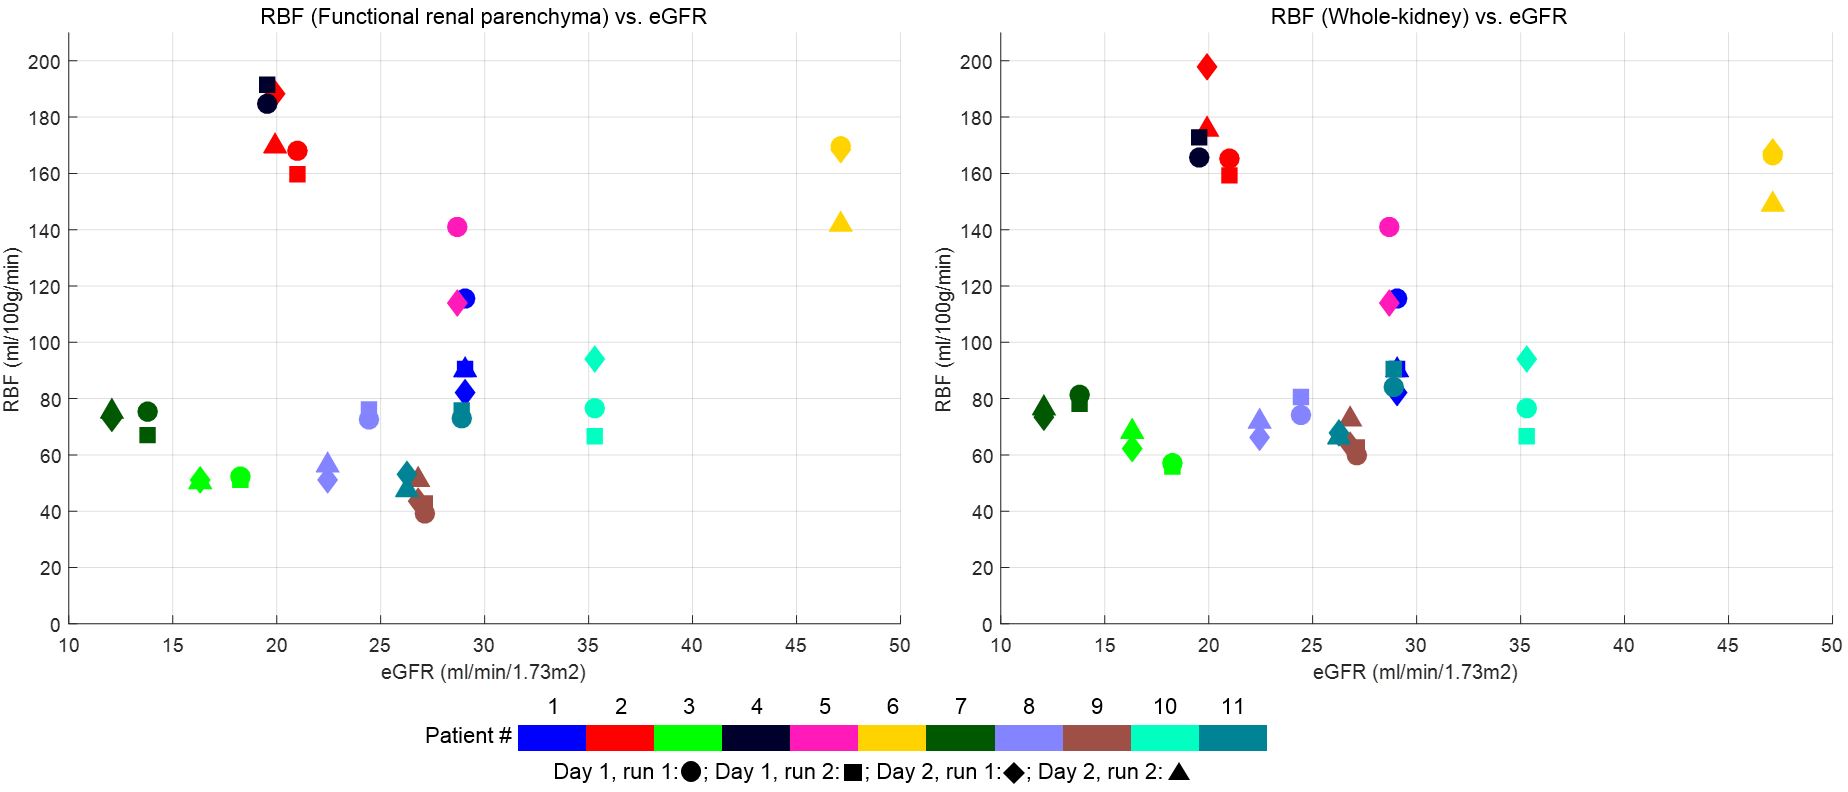
Eleven children (8 male; age (years): 12±3 (mean±SD), 7-17 (range)) with CKD of different pathophysiological origin (eGFR (ml/min per 1.73m2) = 26±9 (mean±SD), 12-47 (range)) were scanned twice in each of two occasions (time between scans (days): 23±10 (mean±SD), 7-35 days (range)), for a total of 44 ASL runs. Estimated GFR was calculated using the bedside Schwartz equation [1] from serum creatinine measurements obtained from routine blood sampling. A single-shot, background-suppressed, respiratory-triggered FAIR 3D-GRASE approach was used for data acquisition. Main parameters include: TR/TE=3000ms/31.5ms; 64x64x10 matrix at 4.5x4.5x6.0mm3 resolution; Partial Fourier (factor 3/4); 25 ASL pairs; Inflow time (TI)=1200ms. Motion correction consisted of image registration combined with weighted averaging [2]. Renal blood flow (RBF) was estimated using a standard single-compartment model using voxelwise M0 and kidney T1 obtained respectively from a separate proton-density scan and a separate saturation recovery acquisition, both with readout matching the ASL acquisition. Functional renal parenchyma (FRP) and whole-kidney regions of interest were manually segmented in the reference M0 volumes (renal dilatations (where existing) were excluded). Good alignment between T1, M0 and ASL data was confirmed by visual inspection with scans not meeting this requirement being excluded. A Bland Altman analysis was used to assess the agreement between RBF measurements across the different scans/days and independently for left and right kidneys. The correlation between RBF (in ml/100g/min) measured using a TI of 1.2s and eGFR (ml/min per 1.73m2) was evaluated by computing the Pearson’s correlation coefficient, where p values smaller than 0.05 were deemed to be significant.Results
All children remained clinically stable between the MR sessions. The technical success rate was 86% (38/44), where 2 runs failed during acquisition (fat shift and respiratory triggering failure) and 4 runs were deemed to have excessive movement which was unable to be corrected using image registration. One example dataset (M0, T1, perfusion-weighted data and RBF map) is shown in Figure 1. The mean FRP and whole-kidney RBF was, respectively 101±52 (mean ± SD), range=51-188 ml/100g/min and 105±44, range=61-175 ml/100g/min. In all 8 Bland-Altman plots (not shown – summarised in Figure 2), the mean of the RBF differences is small, with the largest bias (6.4 ml/100g/min) being found in the inter-session (i.e. different days) comparison of the left kidneys considering the FRP ROIs. For each comparison, t-tests have shown that the null hypothesis (RBF differences coming from a distribution with zero mean) is not rejected at the 5% significance level. Plots of RBF averaged across kidneys vs. eGFR for each patient are shown in Figure 3. No statistically significant correlations were found between RBF at the inflow time of 1.2s and eGFR in both FRP and WK ROIs.Conclusions
For the first time, a paediatric cohort with severe kidney disease of variable origin underwent ASL. Reproducible RBF measurements were obtained. The lack of correlation of RBF to eGFR suggests that the degree to which perfusion is impaired may be linked to each patients’ underlying pathophysiology.Acknowledgements
This study was funded by Kidney Research UK and supported by the National Institute for Health Research Biomedical Research Centre at Great Ormond Street Hospital for Children NHS Foundation Trust and University College London. DLT is supported by the UCL Leonard Wolfson Experimental Neurology Centre (PR/ylr/18575).References
[1] G. J. Schwartz et al., “New Equations to Estimate GFR in Children with CKD,” J. Am. Soc. Nephrol., vol. 20, no. 3, pp. 629–637, Feb. 2009.
[2] F. Nery, E. De Vita, C. Clark, I. Gordon, and D. L. Thomas, “Improved reproducibility of longitudinal renal ASL perfusion measurements in children with chronic kidney disease using retrospective motion correction,” in Proceedings of the ISMRM 25th Annual Meeting & Exhibition, Honolulu, HI, USA, 1887, 2017.
Figures