4591
T1ρ mapping for assessment of fibrosis in renal allografts.1Translational and Molecular Imaging Institute, Icahn School of Medicine at Mount Sinai, New York, NY, United States, 2Pathology, Icahn School of Medicine at Mount Sinai, New York, NY, United States, 3Recanati-Miller Transplantation Institute, Icahn School of Medicine at Mount Sinai, New York, NY, United States, 4Department of Radiology, Icahn School of Medicine at Mount Sinai, New York, NY, United States
Synopsis
The goal of our study was to assess the utility of T1ρ measurements for the differentiation between functional and fibrotic renal allografts. We observed a significant increase in T1ρ in the cortex of fibrotic renal allografts compared to functional allografts. Our results show that T1ρ may be a suitable biomarker for the assessment of fibrosis in renal allografts, which needs to be verified in a larger cohort of patients.
Purpose
Renal fibrosis, associated with the deposition of collagen in the cortical interstitial space, is considered an important predictor for allograft prognosis and can be used to adapt treatment 1. Renal fibrosis is currently evaluated using histopathological analysis of biopsied specimens of the kidney. However, biopsies may have severe complications, including bleeding, and are subject to sampling bias. There is recent interest in advanced multiparametric MRI methods that may be used to noninvasively assess renal fibrosis 1. T1ρ mapping, which is sensitive to the interactions between water molecules and macromolecules including collagen, may be of specific interest for assessment of renal fibrosis. T1ρ has shown to be sensitive to the degree of fibrosis in the liver 2,3. However, there are no reports in which T1ρ is assessed as potential biomarker for prediction of fibrosis in the kidney. The goal of this preliminary study was to investigate the utility of T1ρ MRI for the assessment of fibrosis in renal allografts.Methods
15 patients with stable functional allograft (M/F 9/6, mean age 56y, mean eGFR 65.9±12.6 ml/min/1.73 m2) and 6 patients with chronic dysfunctional allograft and biopsy-confirmed renal fibrosis (M/F 2/4, mean age 56y, mean eGFR 23.4±4.1 ml/min/1.73 m2) were prospectively enrolled in this IRB-approved study. All patients underwent multiparametric MRI at 1.5T. The protocol included T1ρ imaging obtained during 4 x 10s breath holds in a single coronal slice throughout the renal allograft (spin-lock-prepared FLASH sequence, spin-lock strength 500 Hz, spin-lock times 4.8, 9.6, 19.2 and 38.4 ms, TE 3.5 ms, TR 20 ms, flip angle 15°, matrix 128x128, FOV 360x360 mm2). Repeatability of the T1ρ measurement, as determined by coefficient of variation (CV) measurements, was tested in 4 patients (time between scans 17-45 days). Regions of interest (ROIs) were drawn in the cortex and medulla [three ROIs (upper pole, mid pole, lower pole) for both cortex and medulla)]. Average T1ρ values in the cortex and medulla ROIs were quantified. Differences in T1ρ values between the groups were assessed using Student t-tests. ROC analysis was employed to determine the diagnostic performance of T1ρ for differentiation between functional and fibrotic allografts.Results
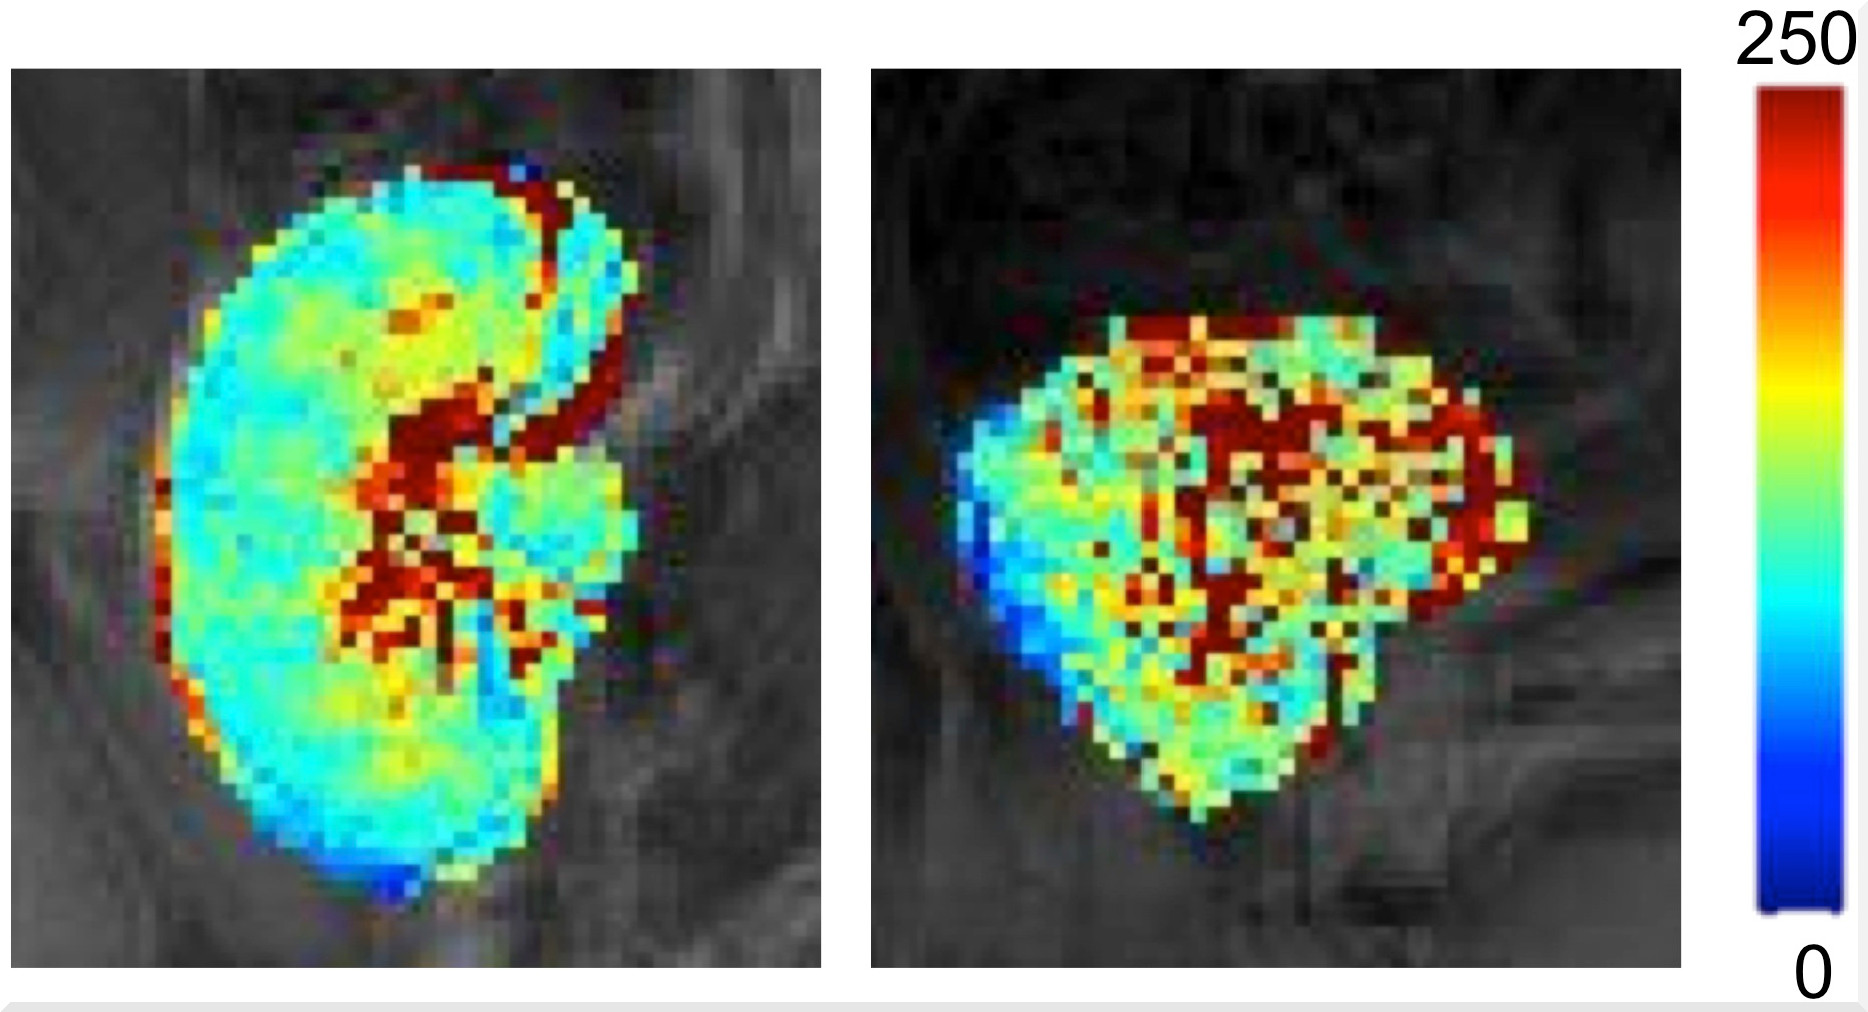
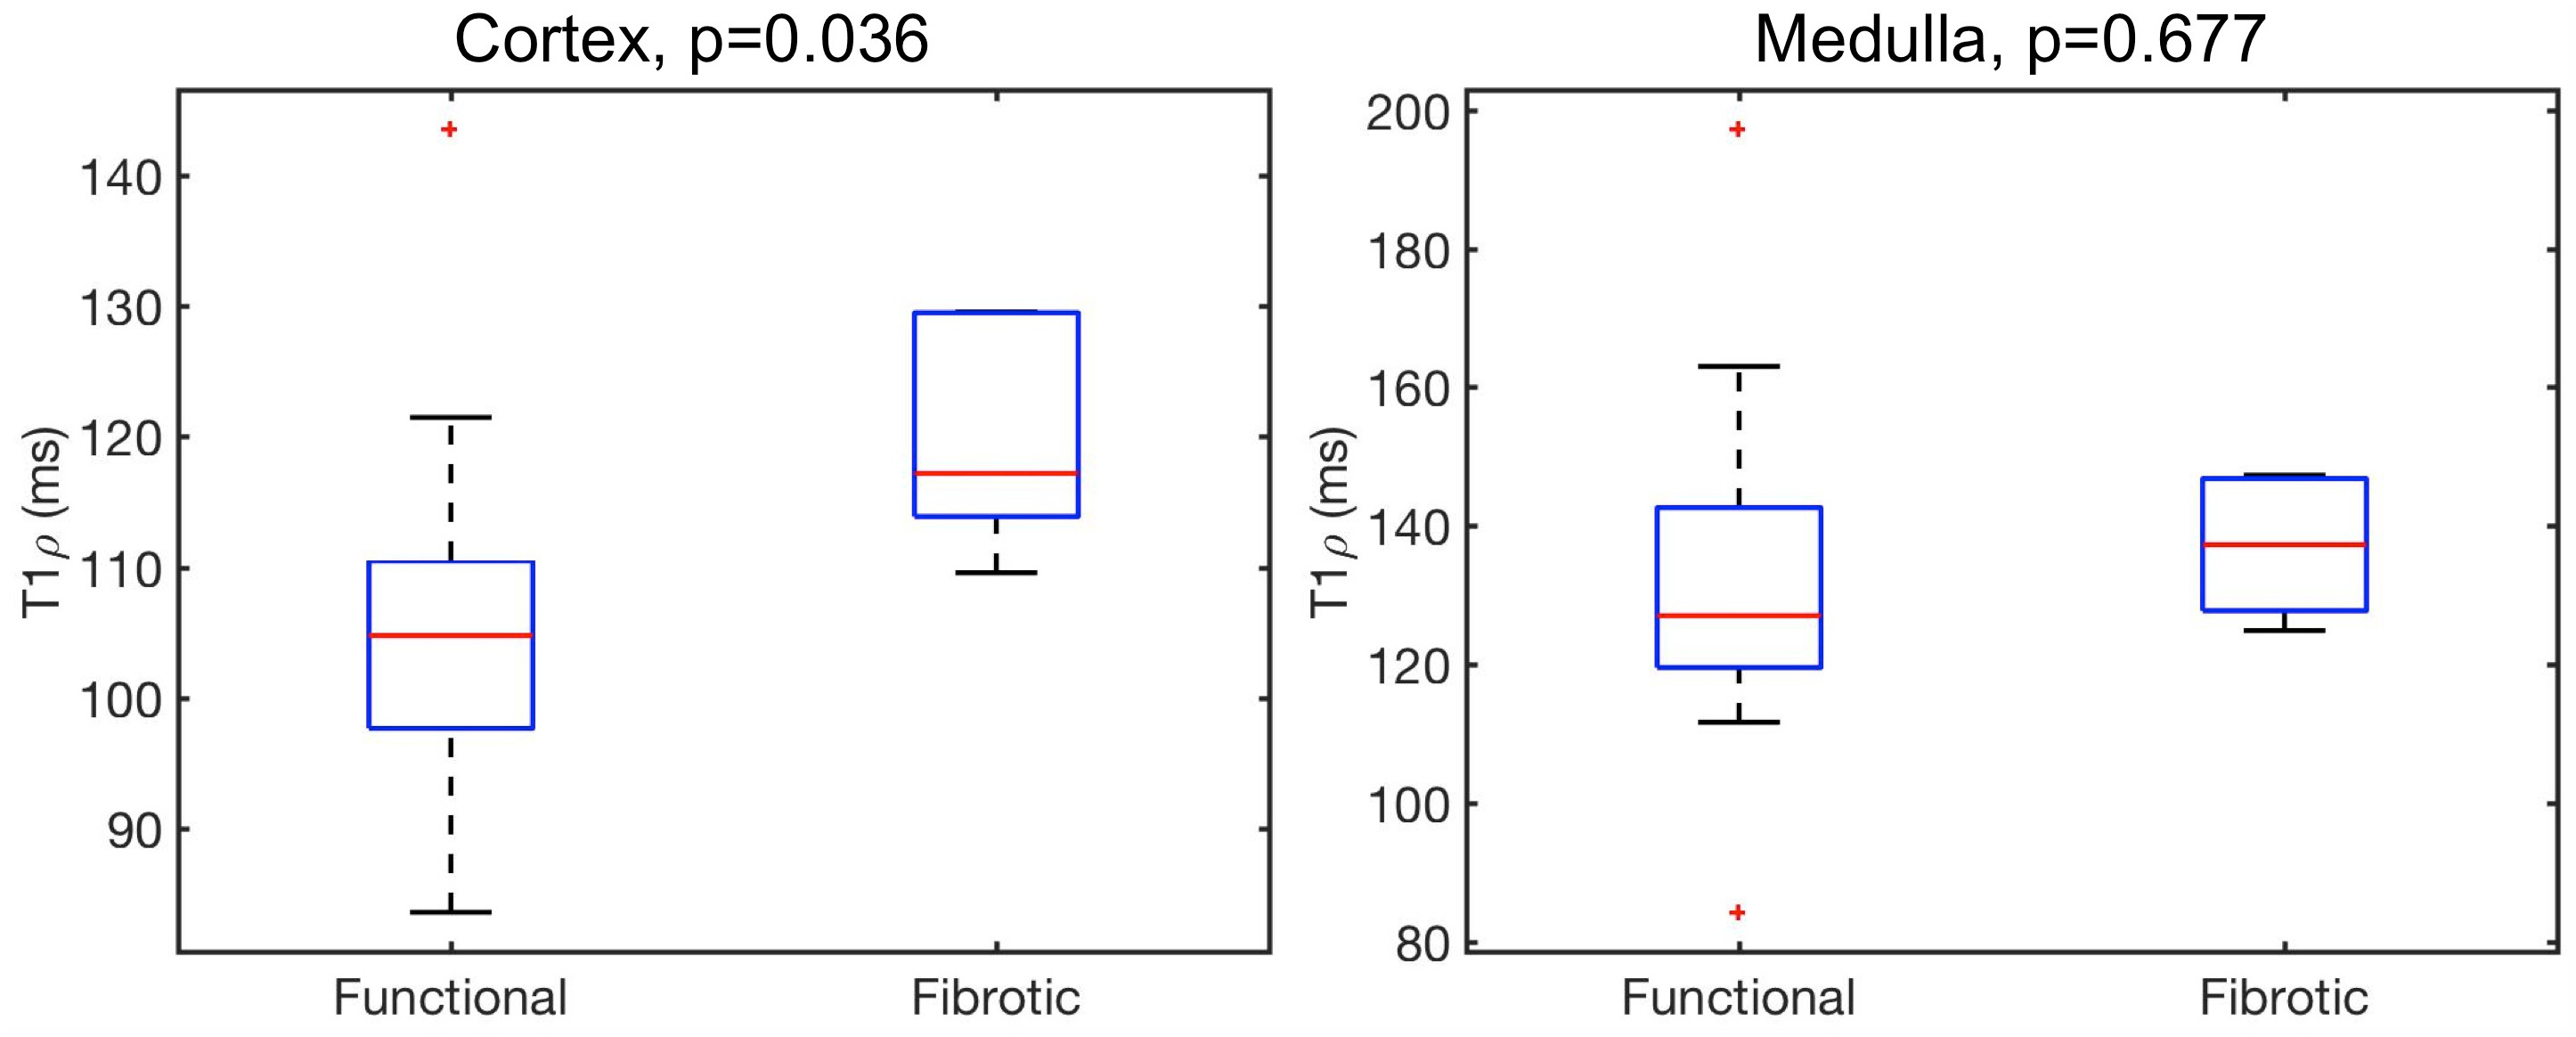
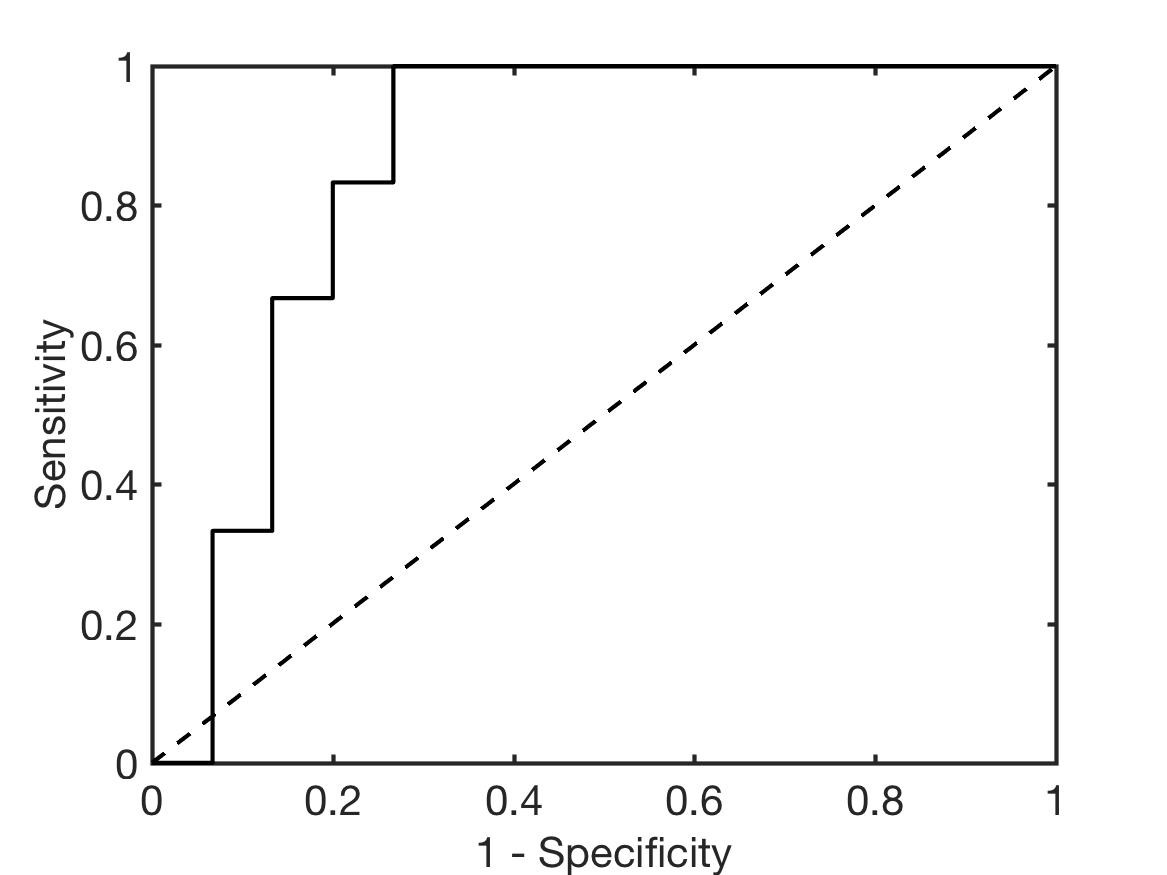
T1ρ measurements were more repeatable in the cortex than in the medulla (mean CV T1ρ cortex 6.4%, medulla 14.6%). Representative T1ρ maps in functional and fibrotic allografts are shown in Figure 1. While T1ρ values were not significantly different between functional and fibrotic allografts in the medulla (T1ρ medulla functional 132.2±25.5 ms, fibrotic 136.9±10.3 ms, P=0.677), significant differences were observed in the cortex (T1ρ cortex functional 104.9±14.8 ms, fibrotic 119.5±8.3 ms, P=0.036; Figure 2). Preliminary ROC analysis showed an AUC of 0.856 (sensitivity 100%, specificity 73.3%, T1ρ threshold 107.8 ms) for differentiation between functional and fibrotic allografts (Figure 3).Discussion and Conclusions
The significant increase in T1ρ in fibrotic renal transplants mirrors earlier findings in liver fibrosis 2,3. It has been suggested that T1ρ increase in fibrosis is associated with elevated collagen levels 3. In the near future, we are planning to recruit more patients with renal fibrosis and we will correlate the T1ρ measurements with tissue collagen content measurements from histopathological analysis. In conclusion, our preliminary results suggest that T1ρ may be a suitable biomarker for assessment of renal fibrosis, which will be verified in a larger study.Acknowledgements
This research was supported by the Society of Abdominal Radiology (SAR) Morton Bosniak Research Award and Guerbet LLC Grant.References
1. Friedli I, Crowe LA, Berchtold L, et al. New Magnetic Resonance Imaging Index for Renal Fibrosis Assessment: A Comparison between Diffusion-Weighted Imaging and T1 Mapping with Histological Validation. Scientific reports 2016;6:30088.
2. Allkemper T, Sagmeister F, Cicinnati V, et al. Evaluation of fibrotic liver disease with whole-liver T1rho MR imaging: a feasibility study at 1.5 T. Radiology 2014;271(2):408-415.
3. Wang YX, Yuan J, Chu ES, et al. T1rho MR imaging is sensitive to evaluate liver fibrosis: an experimental study in a rat biliary duct ligation model. Radiology 2011;259(3):712-719.
Figures