4588
Usefulness of Testicular Volume, Apparent Diffusion Coefficient, and Normalized Apparent Diffusion Coefficient in the Magnetic Resonance Imaging in Evaluation of Infertile Men with Azoospermia1Radiology, Chung-Ang University Hospital, Seoul, Republic of Korea, 2Cheil General Hospital and Women’s Healthcare Center, Seoul, Republic of Korea
Synopsis
It is important to distinguish the obstructive type from the non-obstructive type of azoospermia. To distinguish obstructive from non-obstructive azoospermia, it is useful and important to measure testicular volume using these techniques. To our knowledge, no reports have used DWI to evaluate the testes in case of azoospermia. Therefore, the present study aimed to evaluate the ability of testicular volume, ADC, and normalized ADC (nADC), as measured using MRI, can be used to predict the histopathological grade of azoospermia and to differentiate obstructive from non-obstructive azoospermia.
INTRODUCTION: Azoospermia is the complete absence of sperm in the ejaculate, and it accounts for 5%-10% of male infertility cases1, 2. The condition can be classified as either obstructive or non-obstructive, depending on its causes3-5. Obstructive azoospermia is caused by the blockage of sperm transport, or by abnormalities in the epididymis, vas deferens, or ejaculatory duct. Non-obstructive azoospermia results from defective sperm production by the testicles4. Of the two types, obstructive azoospermia may be surgically corrected. For this reason, it is important to distinguish the obstructive type from the non-obstructive type3, 4, 6. To distinguish obstructive from non-obstructive azoospermia, it is useful and important to measure testicular volume using these techniques3, 6, 7.
Only a few studies have used DWI to evaluate normality or benign pathology in the testes8-10. Furthermore, to our knowledge, no reports have used DWI to evaluate the testes in case of azoospermia. Therefore, the present study aimed to evaluate the ability of testicular volume, ADC, and normalized ADC (nADC), as measured using MRI, can be used to predict the histopathological grade of azoospermia and to differentiate obstructive from non-obstructive azoospermia.
METHODS: A computerized search generated a list of 30 infertile men with azoospermia who had undergone both scrotal MRI and testis biopsy. MRI-determined testicular volumes, ADCs and nADCs were compared between infertile men with obstructive and those with non-obstructive azoospermia. The nADC was calculated as ADC (testis)/ADC (bladder lumen).
RESULTS: 16 were obstructive azoospermia and 14 were non-obstructive azoospermia. The testicular volume in obstructive azoospermia (8.7–27.6 mL) was significantly greater than that in non-obstructive azoospermia (1.8–15.4 mL; p < 0.001). The area under the ROC curve for distinguishing non-obstructive from obstructive azoospermia using testicular volume was 0.92 (≤ 13.06 mL, sensitivity of 85.71% and specificity of 87.5%). Testicular ADC and nADC in obstructive azoospermia (0.329×10⁻³ to 1.578×10⁻³ mm2/s for ADC, 0.113–0.449 for nADC) were significantly lower than in non-obstructive azoospermia (0.801×10⁻³ to 2.211×10⁻³ mm2/s; p = 0.0094 for ADC, 0.235–0.61; p = 0.0001 for nADC). The area under the ROC curves for distinguishing non-obstructive from obstructive azoospermia using testicular ADC and nADC were 0.741 (> 1.031×10⁻³ mm2/s, sensitivity of 92.86% and specificity of 56.25%) and 0.875 (> 0.425, sensitivity of 78.57% and a specificity of 93.75%).
DISCUSSION: In the present study, we found that ADC of the testes cannot provide better information than testicular volume in distinguishing obstructive from non-obstructive azoospermia. In particular, ADC had low specificity. However, nADC showed a high diagnostic performance that was comparable to that of testicular volume in terms of area under the ROC curve (nADC vs. volume: 0.875 vs. 0.92).
CONCLUSION: Testicular volume, ADC, and nADC, as measured using MRI, are useful in predicting the histopathological grade of azoospermia and in differentiating obstructive from non-obstructive azoospermia.
Acknowledgements
No acknowledgement found.References
1. Papadimas J, Papadopoulou F, Ioannidis S, et al. Azoospermia: clinical, hormonal, and biochemical investigation. Archives of andrology 1996; 37:97-102
2. Mazzilli F, Rossi T, Delfino M, Sarandrea N, Dondero F. Azoospermia: incidence, and biochemical evaluation of seminal plasma by the differential pH method. Panminerva medica 2000; 42:27-31
3. Moon MH, Kim SH, Cho JY, Seo JT, Chun YK. Scrotal US for evaluation of infertile men with azoospermia. Radiology 2006; 239:168-173
4. Ammar T, Sidhu PS, Wilkins CJ. Male infertility: the role of imaging in diagnosis and management. The British journal of radiology 2012; 85 Spec No 1:S59-68
5. Simpson WL, Jr., Rausch DR. Imaging of male infertility: pictorial review. AJR American journal of roentgenology 2009; 192:S98-107 (Quiz S108-111)
6. Du J, Li FH, Guo YF, et al. Differential diagnosis of azoospermia and etiologic classification of obstructive azoospermia: role of scrotal and transrectal US. Radiology 2010; 256:493-503
7. Moon MH, Seo JT, Chun YK, Sung CK, Cho JY, Kim SH. Role of ultrasound volume measurements of testes in evaluation of infertile men with azoospermia. J Korean Soc Ultrasound Med 2012; 31:87-91
8. Tsili AC, Giannakis D, Sylakos A, et al. Apparent diffusion coefficient values of normal testis and variations with age. Asian journal of andrology 2014; 16:493-497
9. Karakas E, Karakas O, Cullu N, et al. Diffusion-weighted MRI of the testes in patients with varicocele: a preliminary study. AJR American journal of roentgenology 2014; 202:324-328
10. Kangasniemi M, Kaipia A, Joensuu R. Diffusion weighted magnetic resonance imaging of rat testes: a method for early detection of ischemia. The Journal of urology 2001; 166:2542-2544
Figures
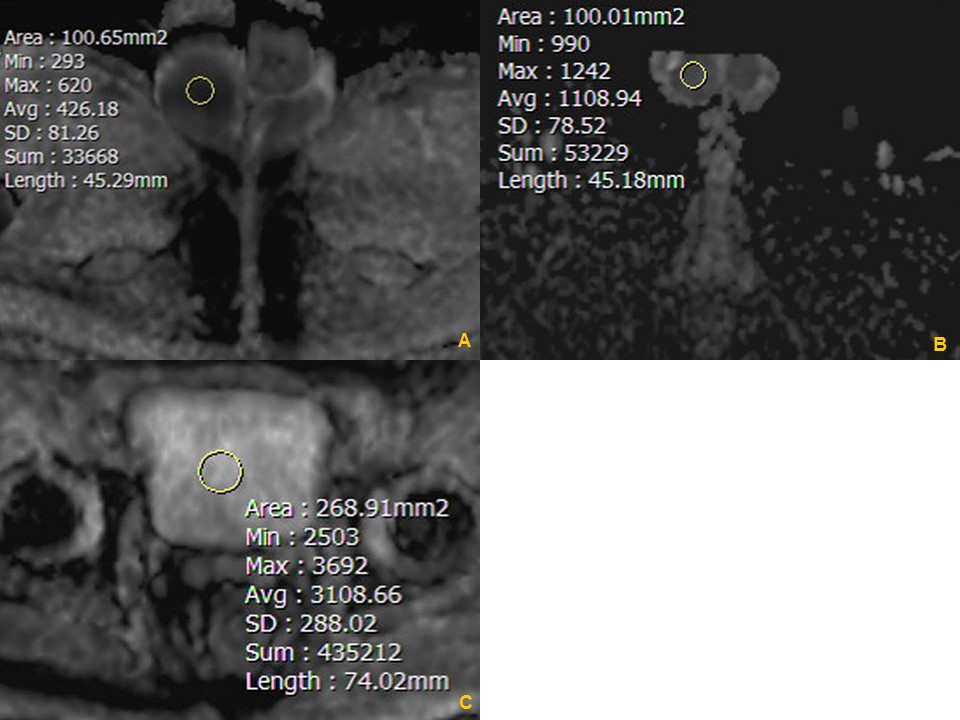
Fig. 1. The apparent diffusion coefficients (ADCs) were measured on the ADC map of the testes and bladder lumen.
ADC maps showing (A) a Grade 1 (normal spermatogenesis) testis and (B) a Grade 4 (germ cell aplasia) testis. The measured ADC values are 0.426 × 10⁻³ mm2/s (A) and 1.108 × 10⁻³ mm2/s (B). (C) ADC map showing measurement of the reference ADC value from urine in the middle of bladder lumen. The measured ADC value is 3.108 × 10⁻³ mm2/s.
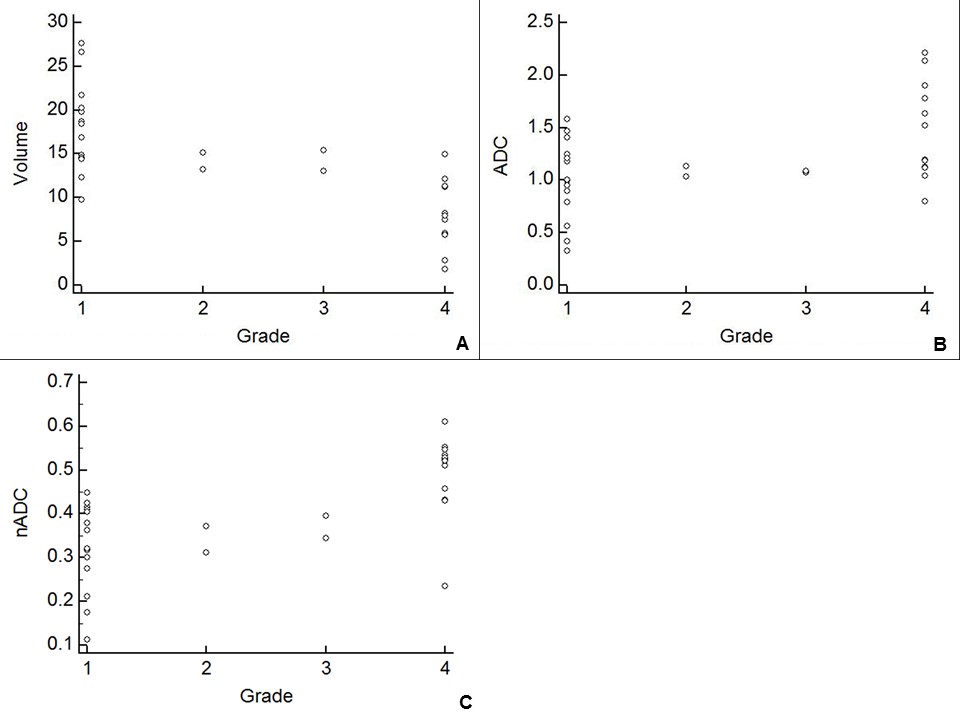
Scatter diagrams of volume (A), apparent diffusion coefficient (ADC) (B), and normalized ADC (nADC) (C) according to histopathological grading of spermatogenesis.
Numbers on X axis: 1 = normal spermatogenesis, 2 = hypospermatogenesis, 3 = maturation arrest, 4 = germ cell aplasia.
Note: Volume (mL), ADC (×10−3 mm2/s)

Receiver operating characteristic (ROC) curves showing the performance of testicular volume, apparent diffusion coefficient (ADC), and normalized ADC (nADC) in distinguishing between obstructive and non-obstructive azoospermia. The area under the curve (AUC) is 0.92 for testicular volume, 0.741 for ADC, and 0.875 for nADC.