4587
MR elastography and US elastography for assessment of renal transplant dysfunction: preliminary results.1Translational and Molecular Imaging Institute, Icahn School of Medicine at Mount Sinai Hospital, New York, NY, United States, 2Radiology, Icahn School of Medicine at Mount Sinai Hospital, New York, NY, United States, 3University Hospital Zurich, Zurich, Switzerland, 4Recanati-Miller Transplantation Institute, Icahn School of Medicine at Mount Sinai Hospital, New York, NY, United States, 5Pathology, Icahn School of Medicine at Mount Sinai Hospital, New York, NY, United States
Synopsis
The aim of this study is to determine whether MR and US elastography methods can differentiate functional and chronically dysfunctional renal allografts by measuring renal corticomedullary stiffness with MR elastography (MRE) and cortex stiffness with ultrasound point shear wave elastography (pSWE). Our preliminary results indicate that renal stiffness measured with MRE is significantly increased in dysfunctional kidneys, while no significant difference was found with pSWE. Renal stiffness measured with MRE also significantly correlated with Banff scores for interstitial fibrosis and tubular atrophy. These preliminary results suggest that MRE is sensitive to fibrotic changes in chronically dysfunctional allografts.
Introduction
Early detection of renal fibrosis in renal transplant recipients is important in order to tailor treatment and ensure survival of the transplanted kidney. A mixture of biopsy, urinalysis and blood markers is currently used to monitor renal transplant health; however all have shortcomings such as invasiveness (for renal biopsy). MR elastography (MRE) has been well established as a tool for staging liver fibrosis and has recently been used to study renal transplants1-4. The widespread availability of ultrasound (US) point shear wave elastography (pSWE) has facilitated an increase in studies evaluating renal fibrosis5-7. In this study, we compare the ability of MRE and pSWE methods to differentiate stable functioning and chronically dysfunctional renal allografts.Methods
23 initial patients were recruited into this IRB approved single center prospective study; 15 with functional renal allografts (M/F 9/6 mean age 55.2±10.7 years, mean eGFR 65.9±12.6 ml/min/1.73m2) and 8 with chronic dysfunction and fibrosis (M/F 2/6, mean age 53.6±12.5 years, mean eGFR 26.7±14.5 ml/min/1.73m2). All dysfunctional and 4 stable function patients underwent biopsy within 1 year of imaging. MRE was performed on a 1.5T MR system (Aera, Siemens) in the coronal plane at 60Hz using a modified 2D spin-echo EPI sequence with motion encoded in the through plane direction, and a commercially available inversion algorithm8. pSWE was performed immediately after MRE (S2000/S3000, Virtual Touch Quantification, Siemens) with 10 valid measurements obtained by one of 3 radiologists. Renal stiffness was determined via magnitude of the complex shear modulus (MRE, |G*|) and Young’s modulus (pSWE, E). MRE ROIs were prescribed based on the automatically generated confidence map. pSWE exams were considered valid if interquartile-range (IQR) was <30% of the median value and success rate (percentage of successful measurements obtained) was >60%. Elastography parameters were compared using the Mann-Whitney test. Spearman correlations were calculated between elastography parameters and Banff scores for interstitial fibrosis (ci), tubular atrophy (ct), vascular atrophy (cv), tubulitis (t) and inflammation (i) in patients with biopsy.Results
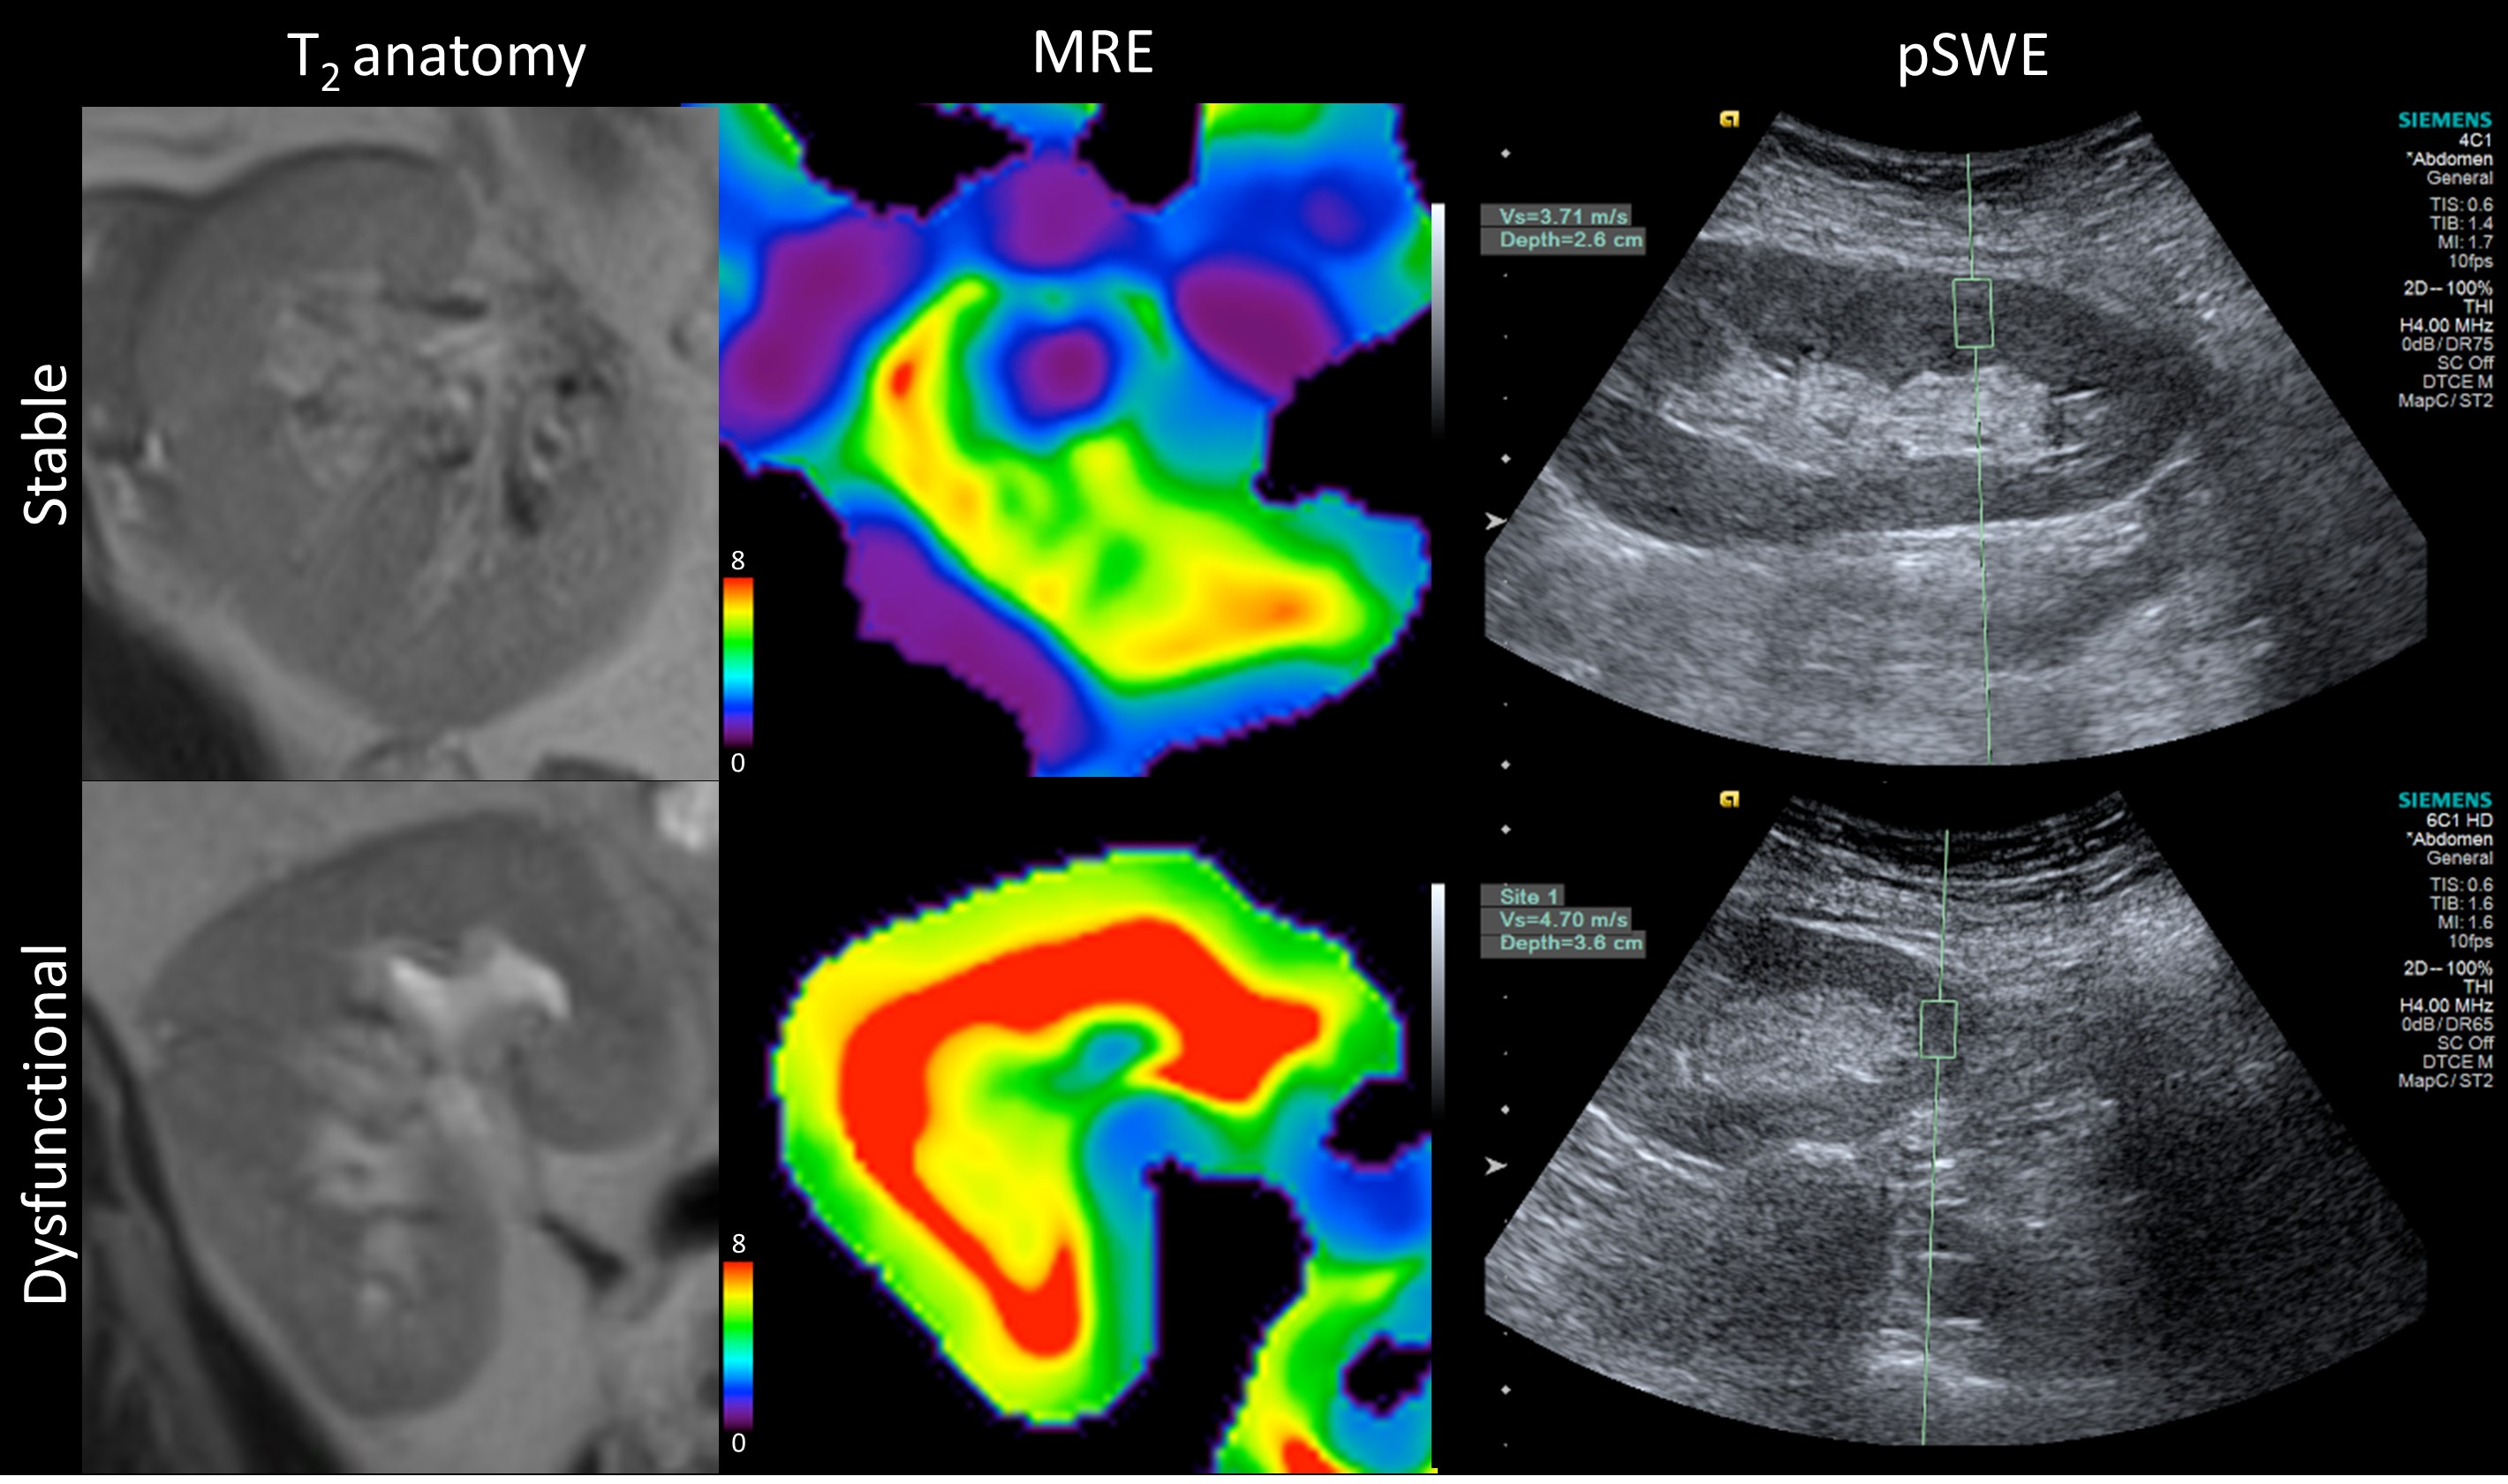
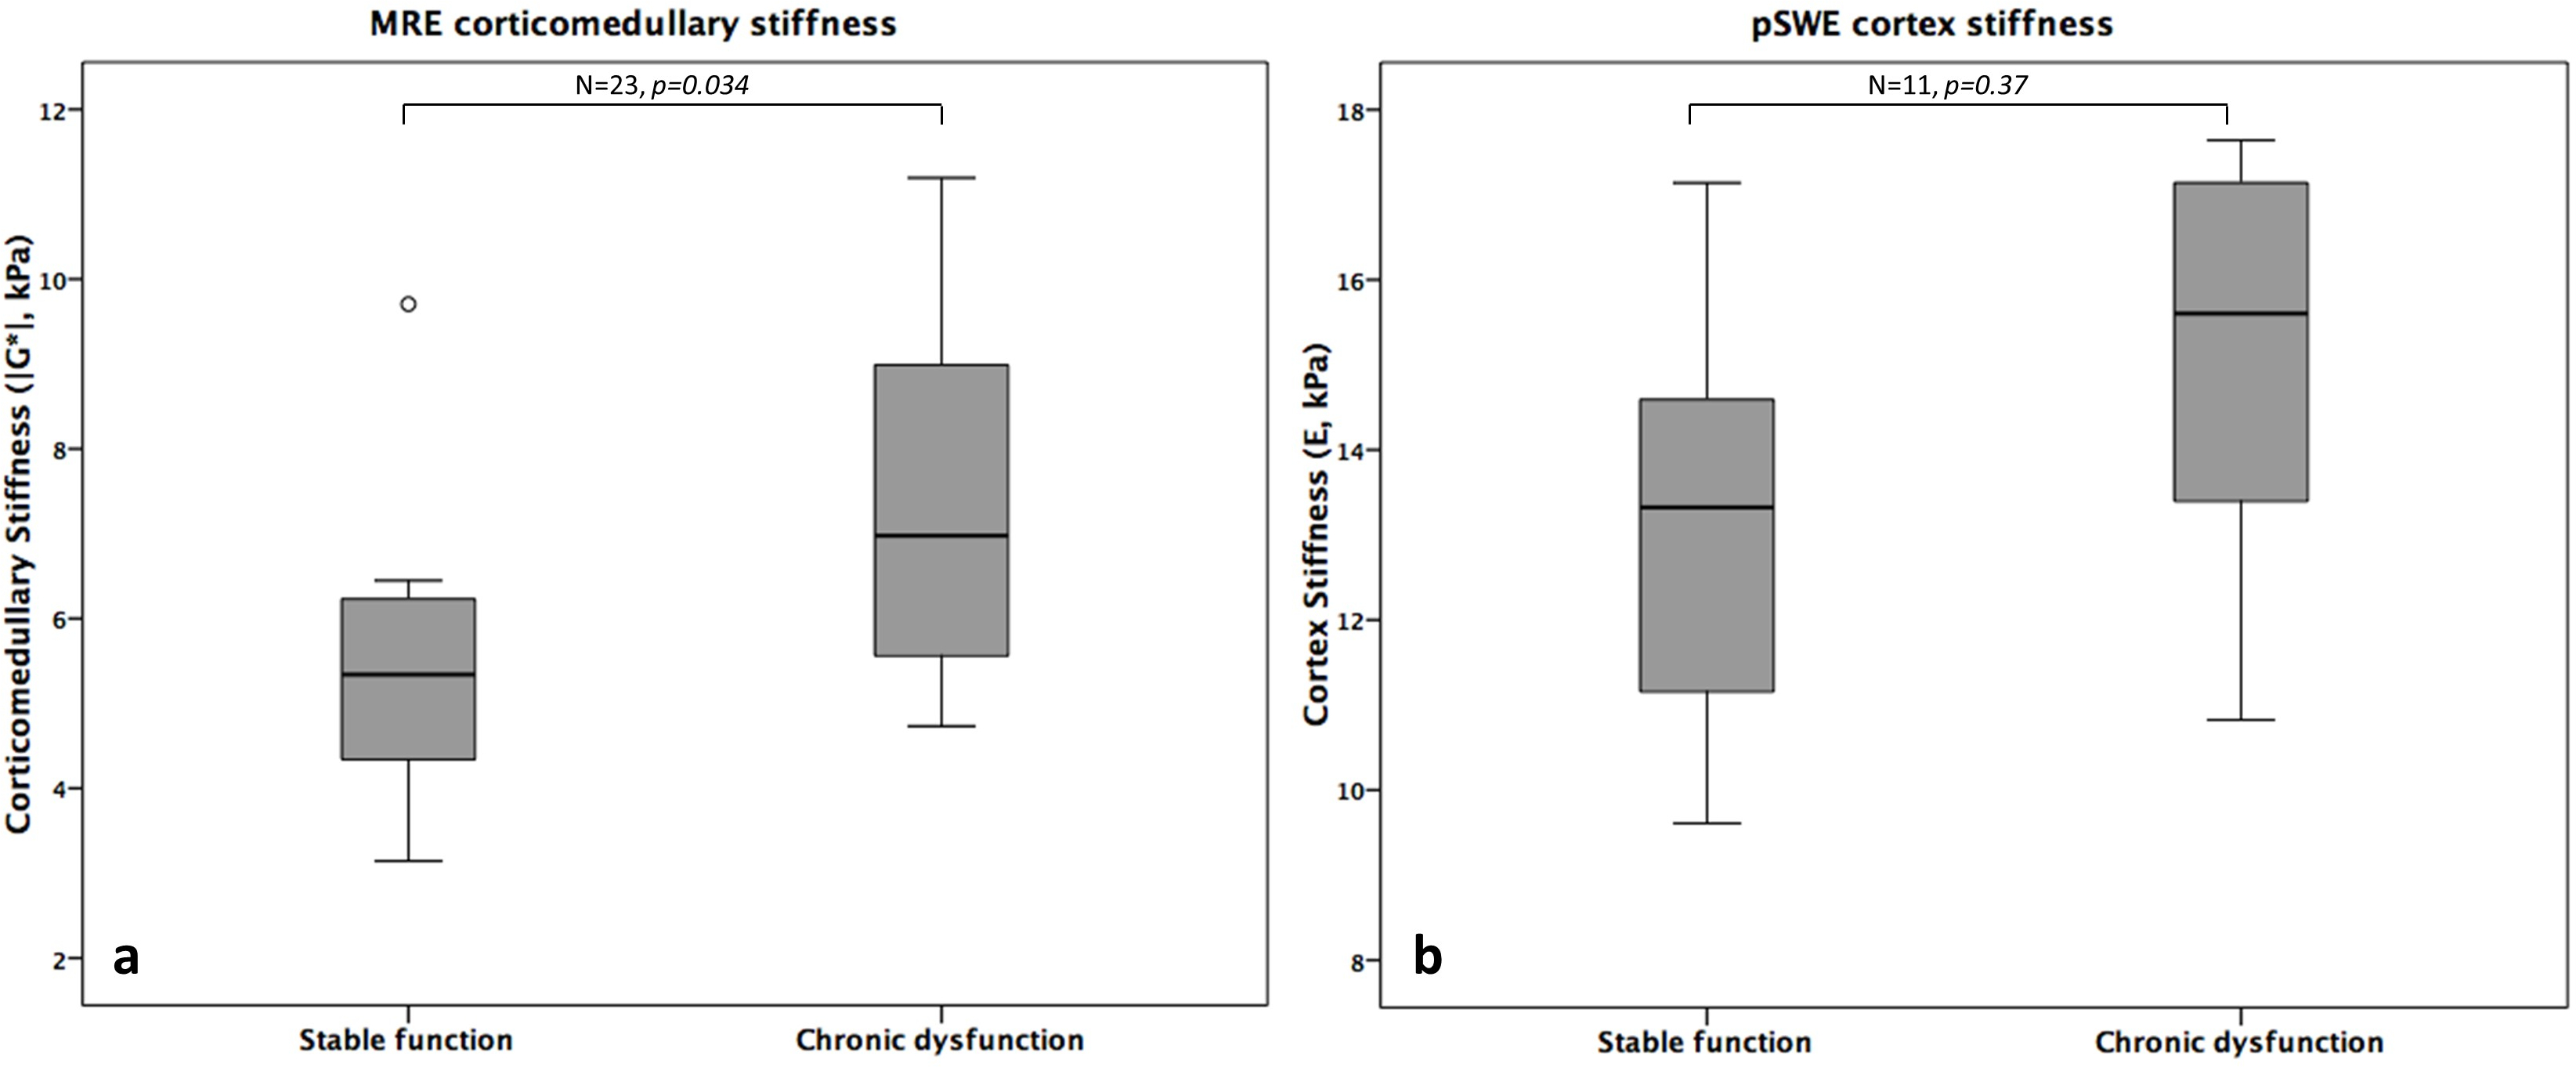
MRE was successful in all patients, while only 11/23 valid pSWE exams were obtained (Figure 1). |G*| was significantly increased in chronically dysfunctional allografts compared to stable function allografts (7.37±2.31 vs 5.50±1.52 kPa, p=0.034; Figure 2a). No significant difference in renal stiffness was found between the groups when analyzing all pSWE exams (n=23,13.96±2.86 vs 13.03±5.07 kPa, p=0.44) or when including only valid pSWE measurements (n=11, 14.92±2.82 vs 13.47±2.52 kPa, p=0.37; Figure 2b). In 12 patients with biopsy, |G*| was significantly correlated with Banff parameters ct (r=0.628, p=0.029) and ci (r=0.596, p=0.041). In the 8 patients with biopsy and valid pSWE measurements, E significantly correlated with cv (r=0.797, p=0.018). Neither |G*| or E were significantly correlated with serum creatinine or eGFR. Preliminary ROC analysis showed |G*| to be the only significant predictor of allograft dysfunction with an AUC of 0.812 (sensitivity 87.5%, specificity 57.1%, p=0.017).Discussion
These preliminary results confirm recent findings showing an increase in renal stiffness of fibrotic allografts using MRE2,3, with conflicting results also reported1. None of our patients with chronically dysfunctional allografts underwent dialysis, unlike the cohort studied by Marticorena et al1. This may have affected allograft perfusion and contributed to reduced stiffness. Our early results indicate that pSWE is unreliable for allograft stiffness measurement. A potential cause for poor reliability is the sensitivity of the measurement to transducer pressure9. The MRE data presented here refer to corticomedullary stiffness due to the limited measurable regions on 2D MRE confidence maps in renal allografts. This is a limitation of 2D MRE which may be addressed with 3D MRE, as all three directions of wave motion are included in the stiffness reconstruction.Conclusion
These initial results indicate MRE is a more reliable and accurate method for non-invasive detection of renal allograft dysfunction than pSWE. A future arm of this ongoing study will incorporate shear wave elastography and 3D MRE to complement the pSWE and 2D MRE methods used in the current study.Acknowledgements
This research was supported by the National Institutes of Health NIDDK Grant 1F32DK109591, Society of Abdominal Radiology (SAR) Morton Bosniak Research Award, and Guerbet LLC Grant.References
1. Marticorena Garcia SR, Fischer T, Dürr M, et al. Multifrequency Magnetic Resonance Elastography for the Assessment of Renal Allograft Function. Investigative Radiology 2016;51(9):591-595.
2. Kirpalani A, Hashim E, Leung G, et al. Magnetic Resonance Elastography to Assess Fibrosis in Kidney Allografts. CJASN 2017;12(10):1671-1679.
3. Kim JK, Yuen DA, Leung G, et al. Role of Magnetic Resonance Elastography as a Noninvasive Measurement Tool of Fibrosis in a Renal Allograft: A Case Report. Transplant Proc 2017;49(7):1555-1559.
4. Lee CU, Glockner JF, Glaser KJ, et al. MR elastography in renal transplant patients and correlation with renal allograft biopsy: a feasibility study. Academic Radiology 2012;19(7):834-841.
5. Lee J, Oh YT, Joo DJ, et al. Acoustic Radiation Force Impulse Measurement in Renal Transplantation: A Prospective, Longitudinal Study With Protocol Biopsies. Medicine 2015;94(39):e1590.
6. He W-Y, Jin Y-J, Wang W-P, Li C-L, Ji Z-B, Yang C. Tissue elasticity quantification by acoustic radiation force impulse for the assessment of renal allograft function. Ultrasound in Medicine & Biology 2014;40(2):322-329.
7. Bom Jun K, Chan Kyo K, Jung Jae P. Non-invasive evaluation of stable renal allograft function using point shear-wave elastography. Br J Radiol 2017:20170372.
8. Dzyubak B, Glaser K, Yin M, et al. Automated Liver Stiffness Measurements with Magnetic Resonance Elastography. Journal of magnetic resonance imaging : JMRI 2013;38(2):371-379.
9. Syversveen T, Midtvedt K, Berstad AE, Brabrand K, Strøm EH, Abildgaard A. Tissue elasticity estimated by acoustic radiation force impulse quantification depends on the applied transducer force: an experimental study in kidney transplant patients. European Radiology 2012;22(10):2130-2137.
Figures