4586
IVIM DWI evaluation in assessment of of Diabetic Nephropathy: a initial clinical applicationlong Liang1, Yingjie mei2, Yunfan Wu1, Guomin Li1, Mengchen Liu1, and Guihua Jiang1
1Medical image center, Guang dong No.2 General Hospital, Guangzhou, China, 2Philips Healthcare, Guangzhou, China
Synopsis
Previous studies using IVIM DWI in evaluating the dynamic change of renal functions both in normal and CIAKI rats’ kidney, However, to the best of our knowledge, this techniques have not been explored to evaluate Diabetic Nephropathy(DN). In oue study, we found that IVIM DWI showed potential value of clinical application in DN.
Introduction
GFR(glomerular filtration rate)helps to characterize kidney infarction and thus is highly valuable in clinical. However, this parameter is usually measured with some invasive methods and interfered by many factors. IVIM DWI (intravoxel incoherent motion diffusion weighted image) is a noninvasive imaging technology capable of estimating kidney function relying on the D, D* and f value1,2. This study is in order to investigate the feasibility of IVIM DWI in evaluating the renal injury with DN (Diabetic Nephropathy).Methods
Diabetic nephropathy group enrolled 46 patients with diabetic nephropathy . According to the eGFR (estimated glomerular filtrationrate), patients were divided into three groups: the early DN group included 18 cases (eGFR > 60 ml·min-1·(1.73 m2)-1); the intermediate stage DN group included 15 cases (eGFR > 30 ml·min-1·(1.73 m2)-1, < 60 ml·min-1·(1.73 m2)-1); terminal stage DN group included 13 cases (eGFR <30 ml·min-1·(1.73 m2)-1). Control group enrolled 17 healthy volunteers, All participants signed informed consent and the study was accepted by the local ethics committee. All experiments were performed using a 3.0-T MR scanner (Ingenia, Philips Healthcare) , In IVIM DWI, ten b values (0, 20, 40, 60, 80, 100, 200, 400, 500 and 600 s/mm2) were applied with a single-shot diffusion-weighted spin-echo echo-planar sequence. 32-cm field of view, 3.0-mm slice thickness, 0.6-mm slice gap, 3,000-ms TR, 60.3-ms TE, 96×96 matrix and NEX=8. Scan Time= 2 min 06s.All MR images were evaluated by two radiologists with over 10 years experience blindly to the group designations. The two radiologists were asked to reach a consensus if there was a discrepancy in the result. All images were used to measure ADC ADC,D,D*and f values. We selected cortex and medulla of right kidney to position regions of interest (ROIs).Results
To compare and analysis the D and ADC values that associated with diffusion, the result shows that in the early stage DN group, the ADC values in cortex and medulla(2.26±0.04×10⁻³ mm2/s, 2.02±0.03×10⁻³ mm2/s) appear significant lower (P<0.05) than control group(2.71±0.03×10⁻³ mm2/s, 2.34±0.02×10⁻³ mm2/s), and the D values in cortex and medulla(1.71±0.06×10⁻³ mm2/s, 1.48±0.06×10⁻³ mm2/s) appear significant lower (P<0.05) compared with control group(2.24±0.08×10⁻³ mm2/s, 2.71±0.03×10⁻³ mm2/s). In intermediate stage DN group, the ADC values in cortex and medulla (1.70±0.03×10⁻³ mm2/s, 1.52±0.02×10⁻³ mm2/s) and D values in cortex and medulla (1.49±0.06×10⁻³ mm2/s, 1.25±0.04×10⁻³ mm2/s)show significantly lower (P<0.05) than early stage DN group. In terminal stage DN group, the ADC values in cortex and medulla (1.36±0.04×10⁻³ mm2/s, 1.22±0.04×10⁻³ mm2/s) and the D values in cortex and medulla (1.04±0.04×10⁻³ mm2/s, 1.07±0.03×10⁻³ mm2/s) appear significant lower (P<0.05) compared with intermediate stage DN group; D values in three groups always show significant lower than ADC values (P < 0.05), ADC values and the D values in cortex were significant higher than in the medulla (P < 0.05).To compare and analysis the D* and f values that associated with perfusion, the result shows that in the early stage DN group, the D* values in cortex and medulla(30.1±14.95×10⁻³ mm2/s, 38.0±11.87×10⁻³ mm2/s) appear significant lower (P<0.05) than control group(43.1±10.80×10⁻³ mm2/s, 45.4±10.7×10⁻³ mm2/s), and the f values in cortex and medulla(31.6±19.59%, 30.1±14.3%) appear significant higher (P<0.05) compared with control group (26.1±10.03%,26.9±7.82%). In intermediate stage DN group, the D* values in cortex and medulla (23.9±7.83×10⁻³ mm2/s, 28.0±17.24×10⁻³ mm2/s) and f values in cortex and medulla (21.4±16.74%, 23.6±13.22%)show significantly lower (P<0.05) than early stage DN group. In terminal stage DN group, the D* values in cortex and medulla (18.6±9.12×10⁻³ mm2/s, 20.9±13.59×10⁻³ mm2/s) and the f values in cortex and medulla (14.8±8.88%, 18.8±7.64%) appear significant lower (P<0.05) compared with intermediate stage DN group; in the three groups, D* values in cortex always show significant lower than in the medulla (P < 0.05).Conclusions
According to the part of DN patients research, IVIM DWI can effectively display dynamic change process of kidney function with diabetic nephropathy, that reflects the micromechanism of pathological changes of diabetic nephropathy. this study had shown that IVIM DWI can make noninvasive assessment of kidney function with diabetic nephropathy, providing reference for clinical diagnosis and therapy, consequently, IVIM DWI appears potential value of clinical application.Acknowledgements
No acknowledgements foundReferences
1.Ichikawa S, Motosugi U, Ichikawa T, et al. Intravoxel incoherent motion imaging of the kidney: alterations in diffusion and perfusion in patients with renal dysfunction. Magnetic resonance imaging, 2013, 31: 414-7.2.Notohamiprodjo M, Chandarana H, Mikheev A, et al. Combined intravoxel incoherent motion and diffusion tensor imaging of renal diffusion and flow anisotropy. Magnetic resonance in medicine : official journal of the Society of Magnetic Resonance in Medicine / Society of Magnetic Resonance in Medicine, 2015, 73: 1526-32Figures
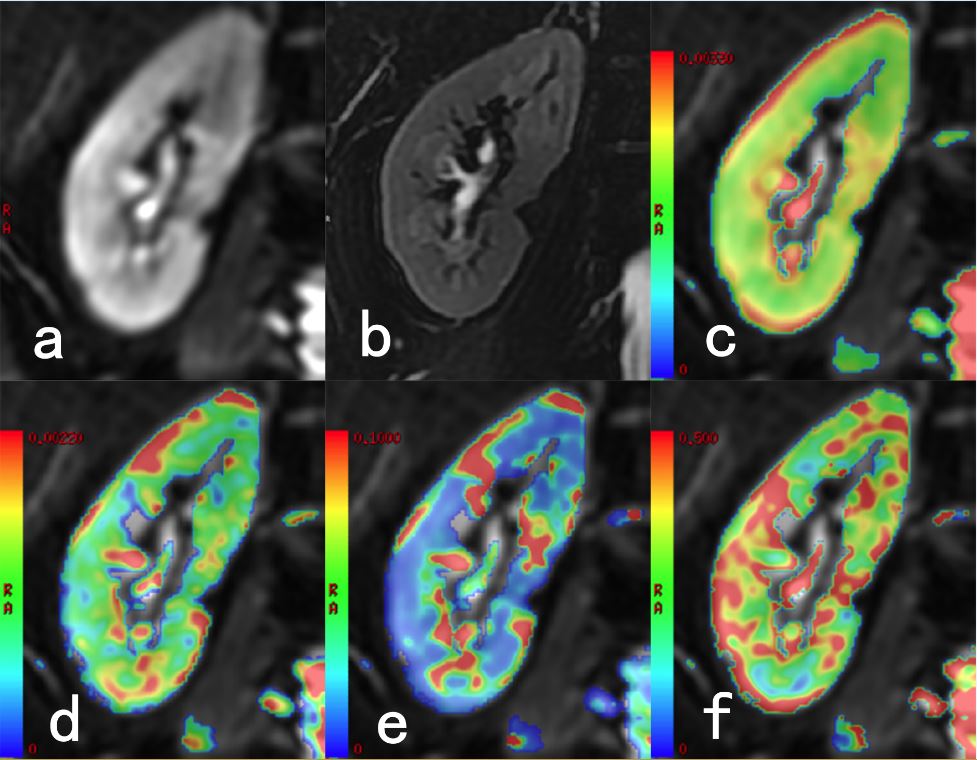
60 years old women, early stage of diabetic nephropathy (eGFR = 96.51ml · min-1 · (1.73m2) -1), IVIM images (a) coronal right kidney with IVIM (b) coronal right kidney with T2WI (c)ADC map (d) D value map (e) D * value map (f) f value map
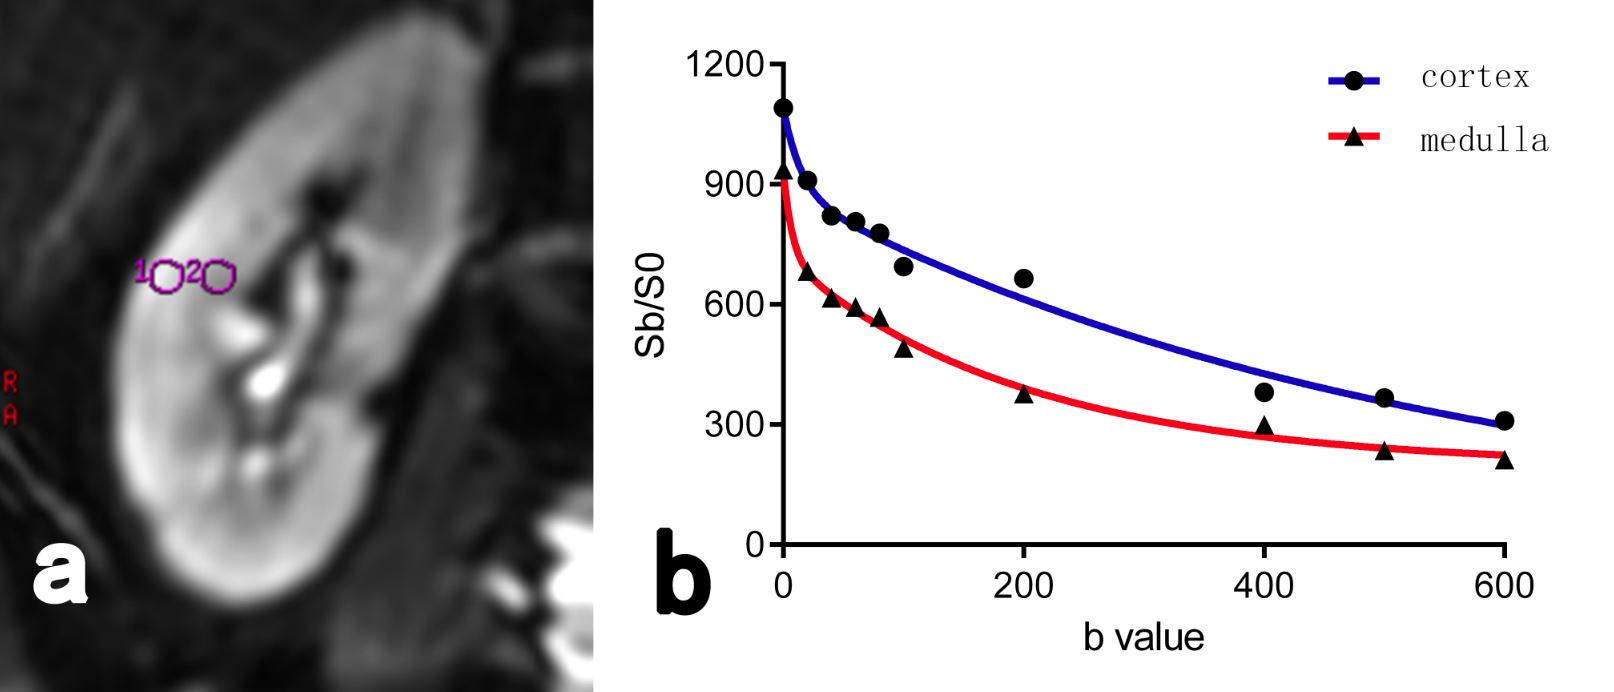
The signal exhibits a biexponential decay curve (red line) with b value and shows calculated diffusion and perfusion related parameters (abscissa: b value, ordinate: S/S0, S is the signal strength when b is not 0, S0 is the signal strength when b is equal to 0, (a) Right kidney IVIM curve ROI, 1 indicate cortex and 2 indicate medulla (b) cortex and medulla signal attenuation curve showed that the medulla temporal signal curve slope slightly larger than the cortex corresponding curve, especially in the low b value range (<200 s / mm2)
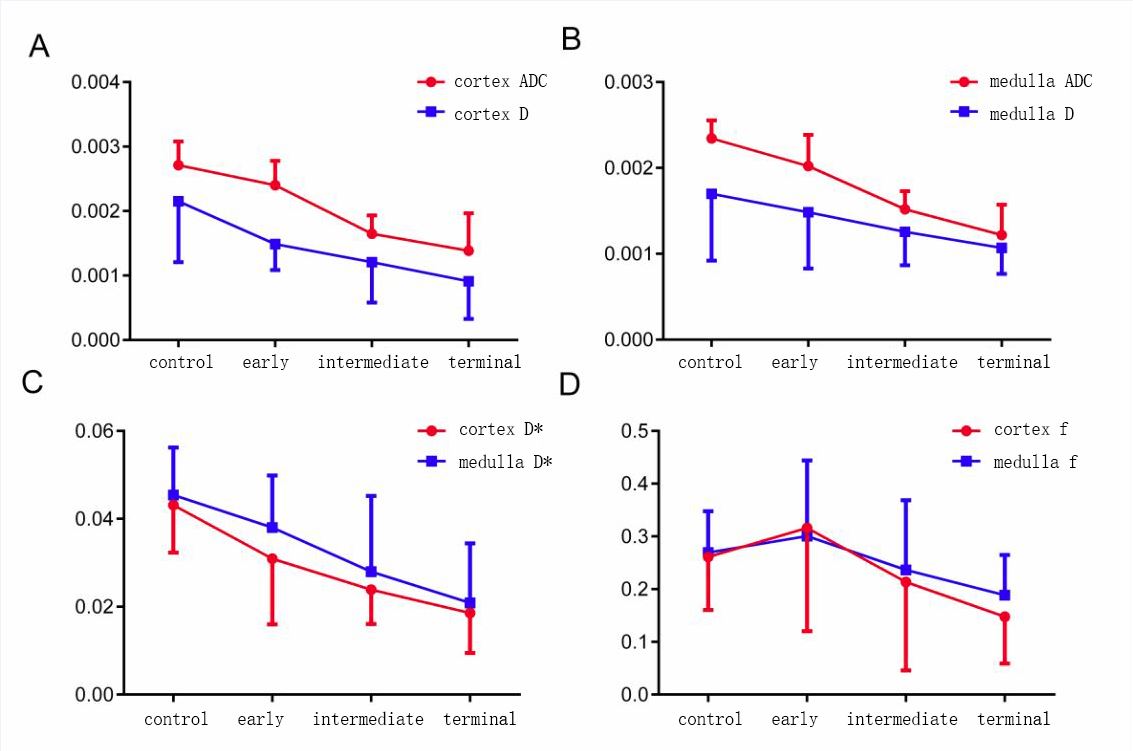
(a) cotex ADC value and D value (b) Medulla ADC value and D value (c) cotex and medulla D * value (d) cotex and medulla f valueIn renal cortex and medulla, D values were less than ADC value; D * value in cotex lower than that in medulla; f value in early stage group was higher than control group