4585
ADC and T1-weighted MRI Identifies Necrosis in Wilms Tumours Without the Need for Contrast Agents1Great Ormond Street Institute of Child Health, University College London, London, United Kingdom, 2Great Ormond Street Hospital, London, United Kingdom
Synopsis
Wilms Tumour (WT) is a paediatric renal tumour. Identifying necrosis in WT is clinically important; it can assess patients’ chemotherapy response and ultimately predict progression-free survival. It is also important for guiding biopsies. Lack of enhancement following intravenous administration of gadolinium is commonly used to identify necrosis, however, WT is a kidney tumour, and the use of gadolinium is contra-indicated in patients with renal failure. In this study we demonstrate how apparent diffusion coefficient values from DWI and pre-gad T1 imaging can predict the level of enhancement in WT, and quantify the percentage of necrotic tissue without exogenous contrast agents.
Purpose
Wilms Tumour (WT) is the most common paediatric kidney tumour; accounting for ~90% of all renal tumours1. In Europe patients receive pre-operative chemotherapy2, after which volume of necrotic tissue is used as a marker of chemotherapy response and overall survival rate3. T1-weighted (T1w) MRI following administration of gadolinium identifies non-enhancing regions, which represent necrotic tumour tissue. Gadolinium, however is contra-indicated in patients with renal failure4 and WT is associated with varying levels of renal failure5. The Apparent Diffusion Coefficient (ADC) derived from diffusion-weighted MRI (DWI) is related to cellularity6 thus ADC may provide alternative information to identify necrosis. Hyper-intense regions on T1w images can indicate necrosis by coagulation. This form of necrosis has low ADC and mimics high-cellular-density tissue. Thus, a combination of T1w (without gadolinium) and ADC could be used as a surrogate marker for identifying necrosis in WT.Methods
Patients: 36 WT patients from Great Ormond Street Hospital (London, UK) received MRI scans (March 2012–April 2016) following chemotherapy, prior to surgery.
MRI: A 1.5T Siemens Magnetom Avanto scanner equipped with 40 mT/m gradients. The multichannel body coil was based on patient size. DWI was acquired with 7 or 8 b values (0, 50, 100, 250, 500, 750, 1000 or 0, 50, 100, 150, 200, 250, 500, 1000 s/mm2), in 3 orthogonal directions. Patients received axial T1w MRI before and after injection of gadolinium-based contrast.
Post-Processing: A mono-exponential fit to all b values generated ADC maps. Pre- and post-gadolinium T1w images and ADC maps were smoothed with a 2mm Gaussian kernel. Regions of Interest (ROIs) were drawn around entire tumour volumes on b0 scans (verified by a radiologist). Fractional Enhancement (FE) maps were generated, where FE = ((Post Gad T1w – Pre Gad T1w)/Pre Gad T1w)). FE maps were co-registered to DWI space. Pre-Gad T1w images were normalised to a reference tissue of the erector spinae muscles, to produce quantitative, normalised T1w images (T1wnorm).
Analysis: Tumour ROIs were placed on co-registered ADC, FE, and T1wnorm maps. Means were calculated for each parameter for every WT. Multiple linear regression identified whether ADC and T1wnorm could predict overall FE in a tumour. Using this model, voxel-wise Predicted Enhancement (PE) maps were generated for each WT. A radiologist independently identified regions within each WT which represented completely necrotic tissue, using all clinically acquired MR sequences for guidance. These necrotic ROIs were placed on corresponding FE maps and mean values were calculated. The 75th percentile of these values was calculated to provide an upper threshold of enhancement in completely necrotic tissue; tissue within WT with enhancement below this value was categorised as necrotic. This threshold was used to calculate %Necrosis of entire WT volume for both measured (FE) and predicted (PE) enhancement maps.
Results
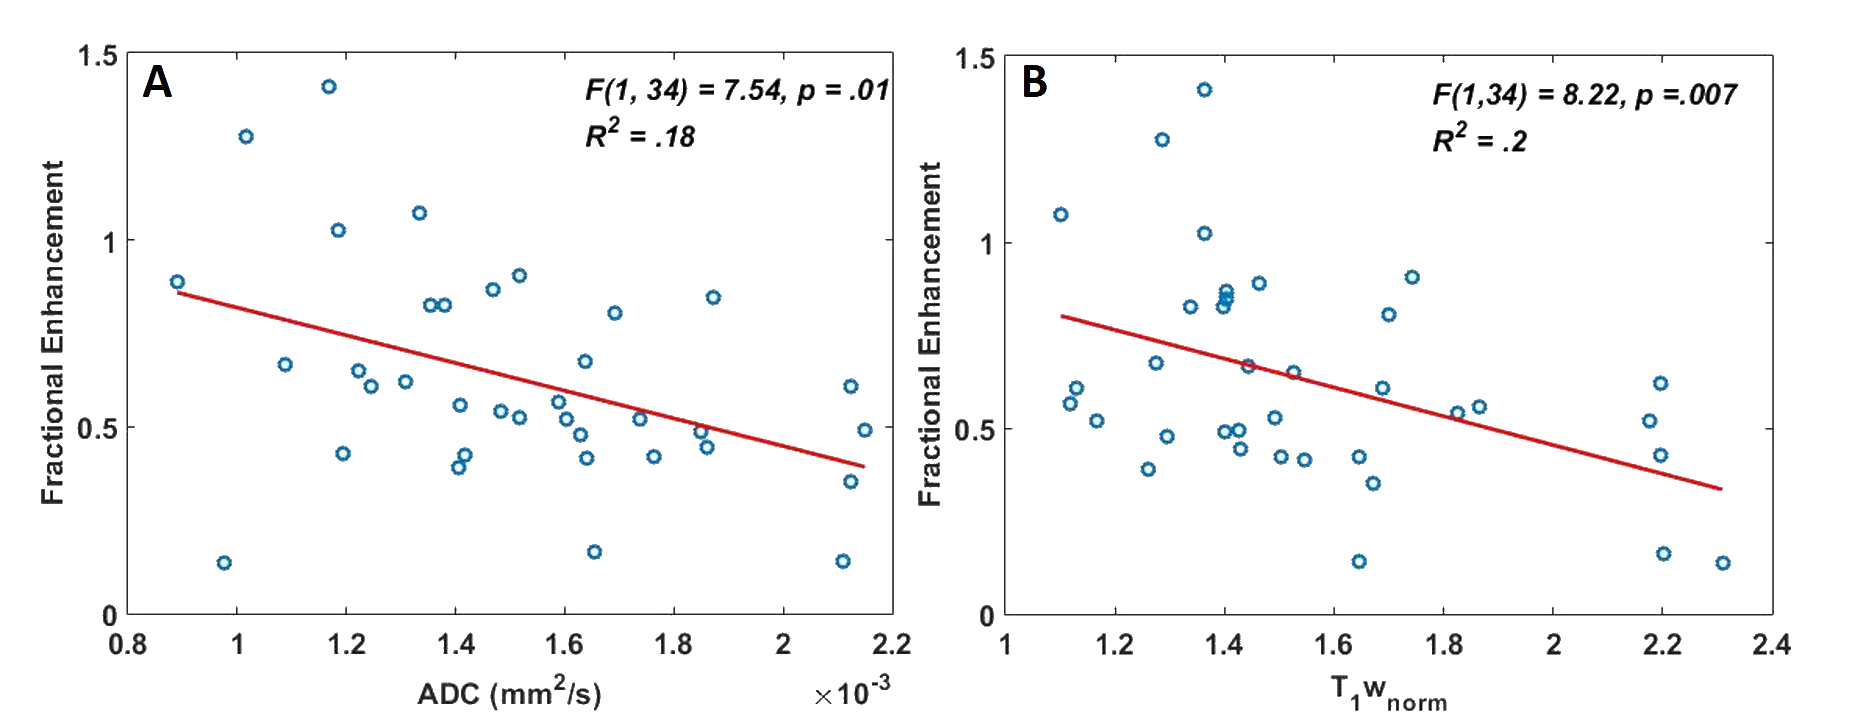
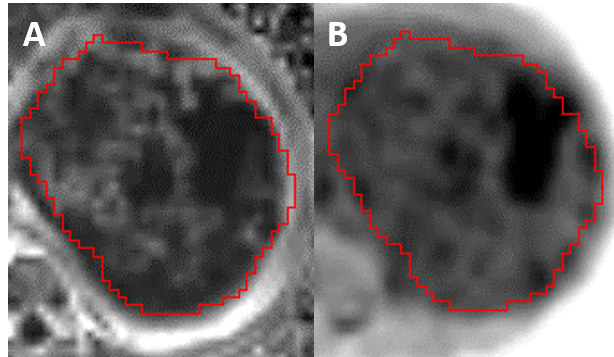
A multiple regression demonstrated that ADC and T1wnorm significantly predicted fractional enhancement F(2, 33) = 12.817, p <0.001, R = .661, R2 = 0.437 and Adjusted R2 = 0.403. Both ADC (p = 0.001) and T1wnorm (p <0.001) added significantly to the prediction, with both increased ADC and increased T1wnorm being associated with reduced FE, (FE = 1.979 – (432.354 * ADC) – (0.477* T1wnorm, Figure 1). The PE and FE maps were visually similar (Figure 2).
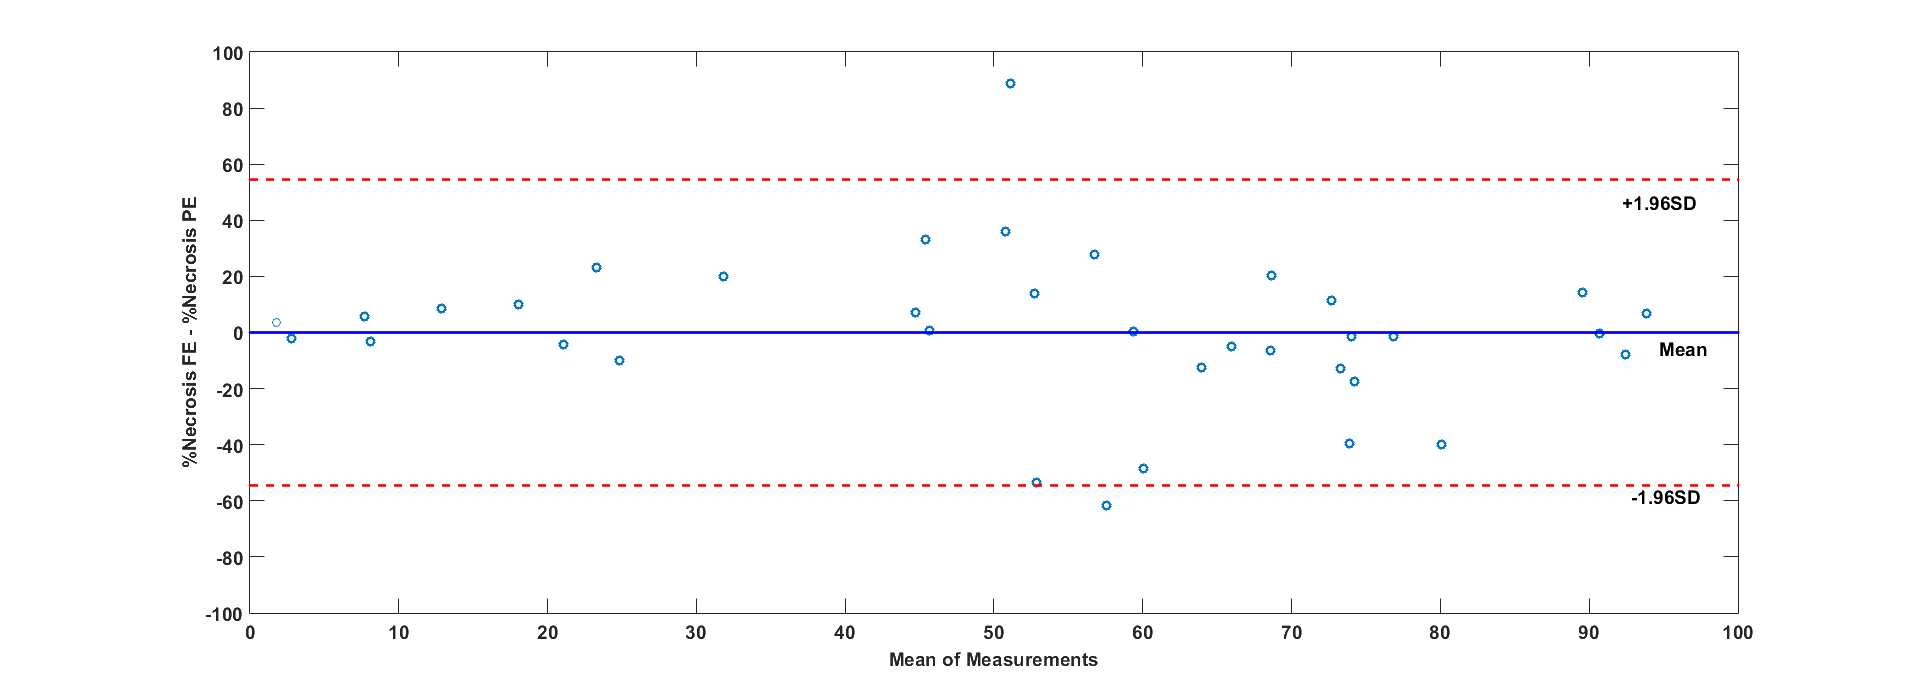
The upper threshold for FE in necrotic tissue was 0.63. A Bland-Altman plot (Figure 3) shows the agreement between the measured and predicted level of necrosis in individual WTs, with little bias in predicted values across a wide range of enhancement levels (Mean =-0.0073, CI = [54.53, -54.54]). The mean dice index of similarity7 between necrotic regions via FE and via PE was 0.6.
Discussion
A combination of DWI and T1w reliably predicted enhancement in WTs without the need for gadolinium. This provides a qualitative measure for visualising viable and necrotic tumour tissue. Additionally, this allows quantification of %Necrosis, and this measure can provide important prognostic information about chemotherapy response. One study has shown that every patients with 100% necrosis post-chemotherapy had relapse free survival at 5 year follow-ups in WT3. Furthermore in-vivo localisation of viable and necrotic tissue might assist with guiding biopsies.Conclusion
Currently measuring necrosis in WT with MRI relies heavily on the injection of gadolinium contrast. As gadolinium is contra-indicated in renal failure, is expensive and requires intravenous access, the ability to identify necrotic regions using DWI and T1w would be extremely beneficial. Separating necrotic and viable tissue within WT is also useful for understanding chemotherapy response, and may help in predicting survival and guiding biopsies and surgery.Acknowledgements
No acknowledgement found.References
1. Pastore G, Znaor A, Spreafico F, et al. Malignant renal tumours incidence and survival in European children (1978-1997): report from the Automated Childhood Cancer Information System project. Eur. J. Cancer. 2006; 42(13): 2103-2114.
2. Graf N, Tournade MF, & de Kraker J. The role of preoperative chemotherapy in the management of Wilms' tumor. The SIOP studies. International Society of Pediatric Oncology. Urol Clin North Am. 2000; 27(3): 443-454.
3. Boccon-Gibod et al. Complete Necrosis Induced by Preoperative Chemotherapy in Wilms Tumor as an Indicator of Low Risk: Report of the International Society of Paediatric Oncology (SIOP) Nephroblastoma Trial and Study 9. Med Pediatr Oncol. 2000; 34(3):183-190.
4. Perazella MA. Gadolinium-contrast toxicity in patients with kidney disease: nephrotoxicity and nephrogenic systemic fibrosis. Curr Drug Saf. 2008; 3(1): 67-75.
5. Grigoriev Y et al. Treatments and outcomes for end-stage renal disease following Wilms tumor. Pediat Nephrol. 2012; 27(8): 1325 – 1333.
6. Humphries PD et al. Tumors in pediatric patients at diffusion-weighted MR imaging: apparent diffusion coefficient and tumor cellularity. Radiology. 2007; 245(3), 848–854.
7. Dice L. Measures of the Amount of Ecologic Association Between Species. Ecology. 1945; 26(3), 297-30.
Figures