4583
MRI assessment of renal function in Acute Kidney Injury and associated longitudinal changes with recovery1Sir Peter Mansfield Imaging Centre, University of Nottingham, Nottingham, United Kingdom, 2Centre for Kidney Research and Innovation, University of Nottingham, Nottingham, United Kingdom
Synopsis
Acute Kidney Injury (AKI), a sudden reduction in kidney function, arises from a number of causes with the degree of renal recovery varying widely between individuals. We use multi-parametric MRI to monitor renal changes at the time of AKI and during the subsequent recovery from AKI. At peak AKI, an increase in renal volume, and both renal cortex and medulla T1 was seen. Medullary T1 significantly correlated with the severity of biochemical injury as measured by serum creatinine, whilst no significant correlation was found for cortex T1. At 3 months post AKI, T1 remained elevated compared to healthy volunteers.
Purpose:
Acute Kidney Injury (AKI) is the sudden reduction in kidney function, the degree of subsequent renal recovery varies widely between individuals, and most AKI patients do not undergo renal biopsy. Mouse models of AKI show increased longitudinal relaxation time (T1)1, greater in the medulla than cortex, and decreased ASL perfusion2 from day 7–28 following AKI1, with changes in T1 and perfusion differentiating AKI severity. The transverse (T2) relaxation time has been shown to increase and apparent diffusion coefficient (ADC) decrease at day 7 following AKI.3 We use multiparametric MRI to assess changes in renal pathophysiology in AKI patients at time of injury and perform longitudinal follow-up of recovery.Methods:
Data Acquisition: Nine patients with AKI Stage 3 (4M/5F; 18-74yrs, no pre-existing kidney disease) were scanned at 2–16 days (median 6 days) and 3 months following peak AKI, two patients have now been assessed at 1 year. 14 healthy volunteers (HV) were scanned as a reference. Serum creatinine (SCR) and eGFR measures were collected at each scan session. Scanning was performed on a 3T Philips Ingenia scanner. Localiser bTFE scans were used for kidney volume measures. ASL, T1, and DWI data were acquired using a spin-echo EPI readout in matched space (5 coronal-oblique slices, FOV 288x288mm, resolution 3x3x5mm, SENSE 2) using respiratory-triggered schemes. ASL was collected using a flow alternating inversion recovery (FAIR) scheme (inflow map, post-label delay 1800ms, selective (S)/non-selective (NS) thickness 45/400mm, 25 pairs). Inversion recovery T1 data was acquired at 13 inversion times (200-1500ms). DWI data was acquired with 11 b-values (0-500s/mm2). Higher resolution (1.5x1.5mm) T1 measures were also obtained using a bFFE readout. T2* data was acquired with a 12 echo mFFE scheme (TE 5ms, echo spacing 3ms, voxel 1.5x1.5x5mm and FOV 288x288mm). PC-MRI was used to assess renal artery blood flow.
Data Analysis: Kidney volumes were calculated using Analyze9. Multiparametric maps were generated using Matlab. Inversion recovery data was fit to form T1 maps. Perfusion maps were formed from the average perfusion weighted images (S-NS) normalised to a base magnetisation image, and fitted to a kinetic model. mFFE data was fit to compute T2* maps. DWI data was fit to ADC and an IVIM model to calculate D, D* and perfusion fraction. Cortex and medulla masks were created from T1 maps, and the mode of all MRI parameters computed.
Results:
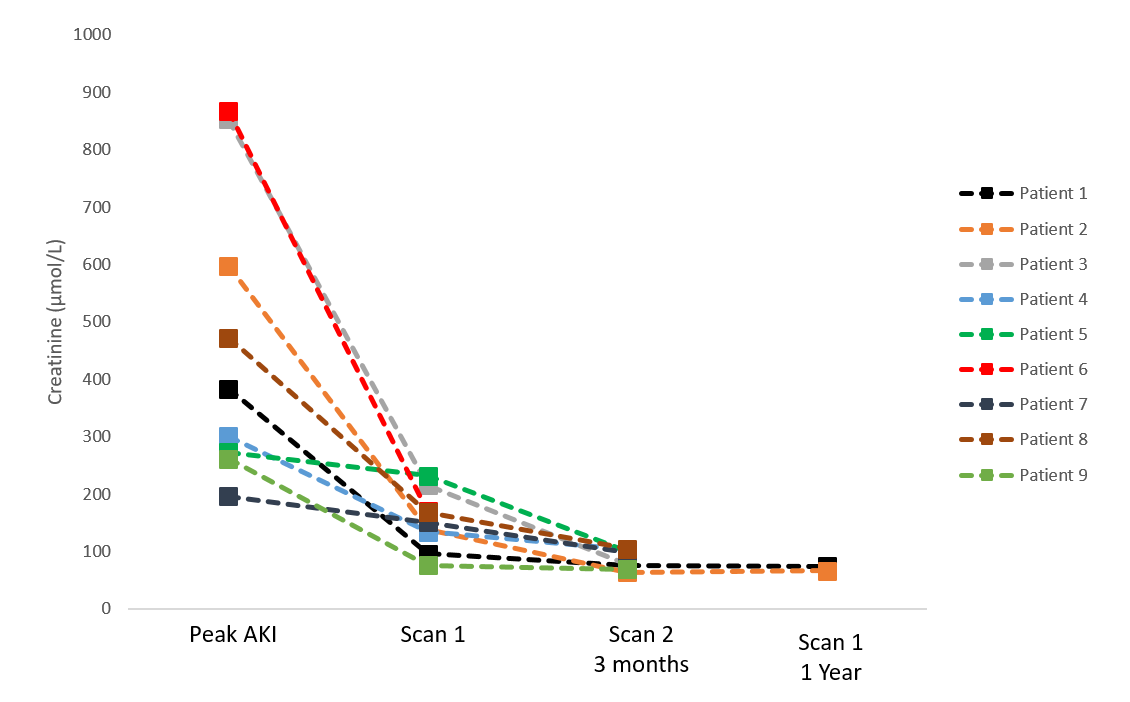
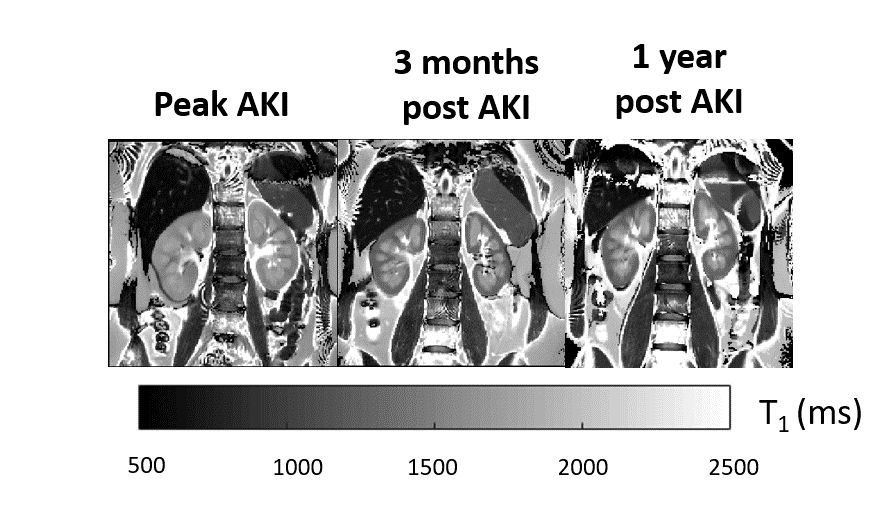
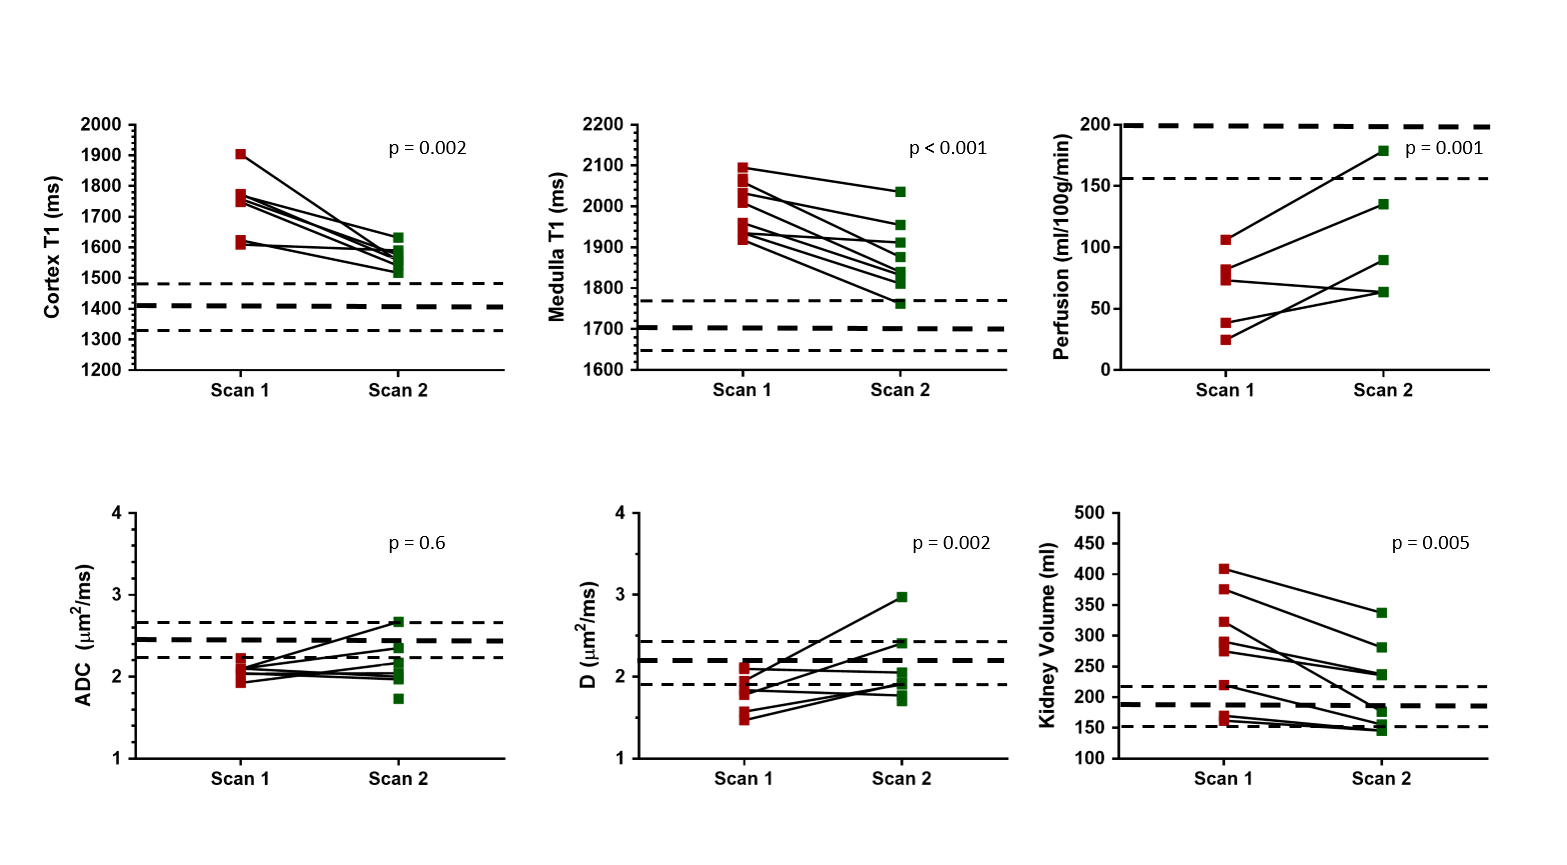
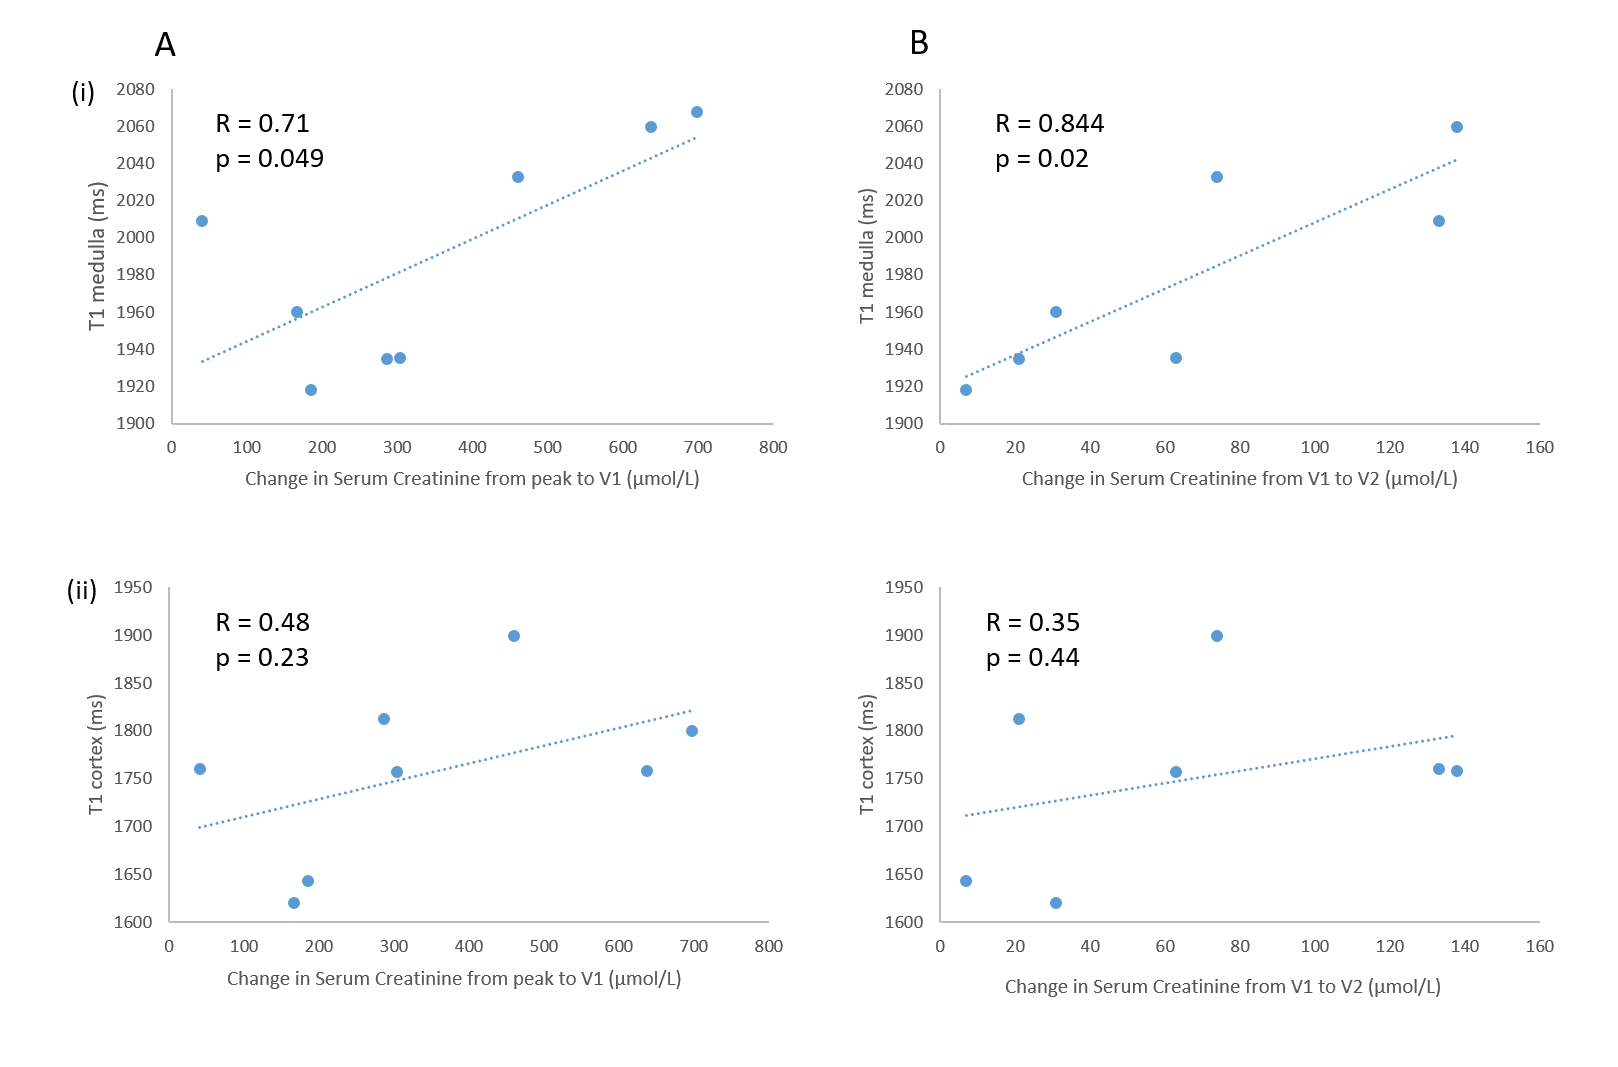
Figure 1 shows the serum creatinine levels for each AKI patient. Example T1 maps at peak AKI, 3 months and 1 year are shown in Figure 2. In comparison to HVs, T1 in the cortex and medulla, and whole kidney volume were elevated at peak AKI (p<0.001). T1 maps showed a reduced corticomedullary differentiation (228 ± 72 ms Peak AKI, 302 ± 101 ms 3 months), but this was not significant. Perfusion and ADC were reduced in comparison to HVs at peak AKI (p<0.02). At 3 months, T1 in the cortex and medulla significantly decreased (p <0.002), but remained elevated compared to HVs, while perfusion, ADC and D remained decreased compared to HVs (Figure 3). Correlations between serum creatinine levels and T1 values are shown in Figure 4, with a significant correlation shown between medulla T1 at Scan1 and (Peak-Scan1 SCR) (R=0.71, p=0.05) and (Scan1–Scan2 SCR) (R=0.844, p=0.02) (Figure 4). No significant differences in Scan1 MRI parameters were found between those patients with a positive and negative cumulative fluid balance (p>0.3).Discussion:
This is the first human study to use multiparametric MRI to assess kidney function and structure during AKI. The acute phase of AKI is associated with inflammation of the renal parenchyma4 with cell swelling and interstitial oedema. The pronounced increase in medulla and cortex T1 is consistent with this. Furthermore, the severity of AKI correlated with renal T1 measures, with correlations strongest between medullary values and AKI severity. Note that such significant changes in medulla T1 are not found in CKD. This provides insights into the pathophysiology of AKI, showing that the medulla is particularly sensitive to the reduction in perfusion that we also demonstrate at time of AKI. Similar findings have been shown in animal models5. Importantly, MRI measures also inform AKI recovery, with a persistent increase in T1 at 3 months potentially indicating renal fibrosis, and significant changes detectable despite complete biochemical recovery.Conclusion:
MRI provides valuable insight into the understanding of AKI, and can detect incomplete recovery at 3 months even with complete normalisation of biochemistry. MRI has the potential to inform AKI aetiology, stratify severity and identify maladaptive repair, helping to develop future therapies.Acknowledgements
This work was funded by the MRC Confidence in Concept Award.References
1. Hueper K, Peperhove M, Rong S, et al. T1-mapping for assessment of ischemia-induced acute kidney injury and prediction of chronic kidney disease in mice. Eur. Radiol. 2014;24:2252–60.
2. Hueper K, Gutberlet M, Rong S, et al. Acute Kidney Injury: Arterial Spin Labeling to Monitor Renal Perfusion Impairment in Mice—Comparison with Histopathologic Results and Renal Function. Radiology, 2013;270:117-124
3. Heuper K, Rong S, Gutberlet M, et al, T2 Relaxation Time and Apparent Diffusion Coefficient for Noninvasive Assessment of Renal Pathology After Acute Kidney Injury in Mice: Comparison With Histopathology. Invest. Radiol 2013;48: 834-82
4. Rabb H, Griffin MD, McKay DB, et al. Inflammation in AKI: Current Understanding, Key Questions, and Knowledge Gaps. J Am Soc Nephrol. 2016;27(2):371-9.
5. Langenberg, C., et al. (2007). Renal blood flow and function during recovery from experimental septic acute kidney injury. Intensive Care Med 33(9): 1614-1618).
Figures