4582
Use of Multiparametric MRI in assessment of Chronic Kidney Disease: reproducibility, correlation with histology and progression1Sir Peter Mansfield Imaging Centre, University of Nottingham, Nottingham, United Kingdom, 2Centre for Kidney Research and Innovation, University of Nottingham, Nottingham, United Kingdom
Synopsis
We use multi-parametric renal MRI including T1, ASL perfusion and DWI to assess structural and haemodynamic changes in CKD patients compared to healthy volunteers (HV). A significant increase in renal cortex and medulla T1 (and reduced corticomedullary differentiation), and reduction in renal cortex perfusion, was found between CKD patients and HVs. MRI measures in CKD patients were highly reproducible. A significant negative correlation was found between renal cortex T1 and eGFR, and a positive correlation of corticomedullary differentiation and perfusion with eGFR. Renal cortex T1 and corticomedullary differentiation correlated most strongly with quantitative biopsy measures of renal interstitial fibrosis (IF).
Purpose:
Chronic kidney disease (CKD) affects 1 in 7 of the population, it can progress to end-stage-kidney disease (ESKD) requiring dialysis or transplantation, and increases cardiovascular risk. The treatment of CKD is supportive and non-specific. Kidney biopsy assessment of interstitial fibrosis is used to assess CKD severity, but is invasive, static and susceptible to sampling error. Improved methods for determining mechanisms for CKD and its progression are urgently required to allow improved stratification of patients. Previous MRI studies have shown CKD is associated with lower cortical perfusion1-3, increased longitudinal (T1) relaxation time3,4, and reduced diffusion-weighted imaging (DWI) ADC values4,5 compared to healthy subjects. Here, we perform a multi-parametric MRI protocol6 (T1, T2*, DWI, ASL, volume) in CKD patients with renal biopsy and healthy volunteers (HV). This forms part of a study to annually assess CKD progression with MRI, CKD patients have currently been followed up after 1 year.Methods:
25 patients with CKD Stage 3 or 4 (eGFR 18–60 ml/minute/1.73 m2, 19M, 6F, 56±15 years) were scanned twice (median 10 days between scans) at Year 0 for reproducibility of MRI measures within a median of 53 days from renal biopsy, data was also collected on 17 age-matched HVs. Histological fibrosis quantification was performed on CKD renal biopsies with sirius red staining to determine percentage interstitial fibrosis (IF). To date, 11 patients have completed their Year 1 scan, all patients are due to complete this by February 2018.
MR Acquisition: Scanning was performed on a 3T Philips Ingenia scanner. Localiser bFFE scans were acquired to estimate kidney volume. ASL, T1, and DWI data were collected using respiratory-triggered schemes in matched data space (5 coronal-oblique slices, SE-EPI readout, FOV 288x288mm, 3x3x5mm, SENSE 2); ASL data: flow alternating inversion recovery (FAIR) scheme (post-label delay times of 300, 500, 700, 900, and 1800ms, S/NS thickness 45/400mm), T1 data: 13 inversion times (200-1500ms), DWI data: 8 b-values (0-500s/mm2). T1 data were also obtained using a higher resolution bFFE readout (1.5x1.5x5mm). T2* data was acquired using a mFFE scheme with 12 echo times (TE 5ms, ΔTE 3ms, 1.5x1.5x5mm).
Data Analysis: In-house software (Matlab) was used to generate multi-parametric maps: T1 data was fit voxel-wise to form T1 maps; perfusion maps were formed from the average perfusion-weighted (PW) images (S-NS) normalised to a base magnetisation image and fit using a kinetic model accounting for inflow time; DWI data was fit to both ADC and IVIM models to calculate D, D* and perfusion fraction maps; mFFE data was fit to compute T2* maps. Cortex and medulla masks were created, and histogram analysis applied to determine the mode of each MRI measure. Kidney volume was determined using Analyze9. To assess reproducibility, coefficient of variance (CoV) was computed between Year 0 scans, and Year 0 MR measures were assessed against clinical measures of eGFR and biopsy IF score. Year 1 MRI data was grouped by percentage change in eGFR over 1 Year to assess progression.
Results:
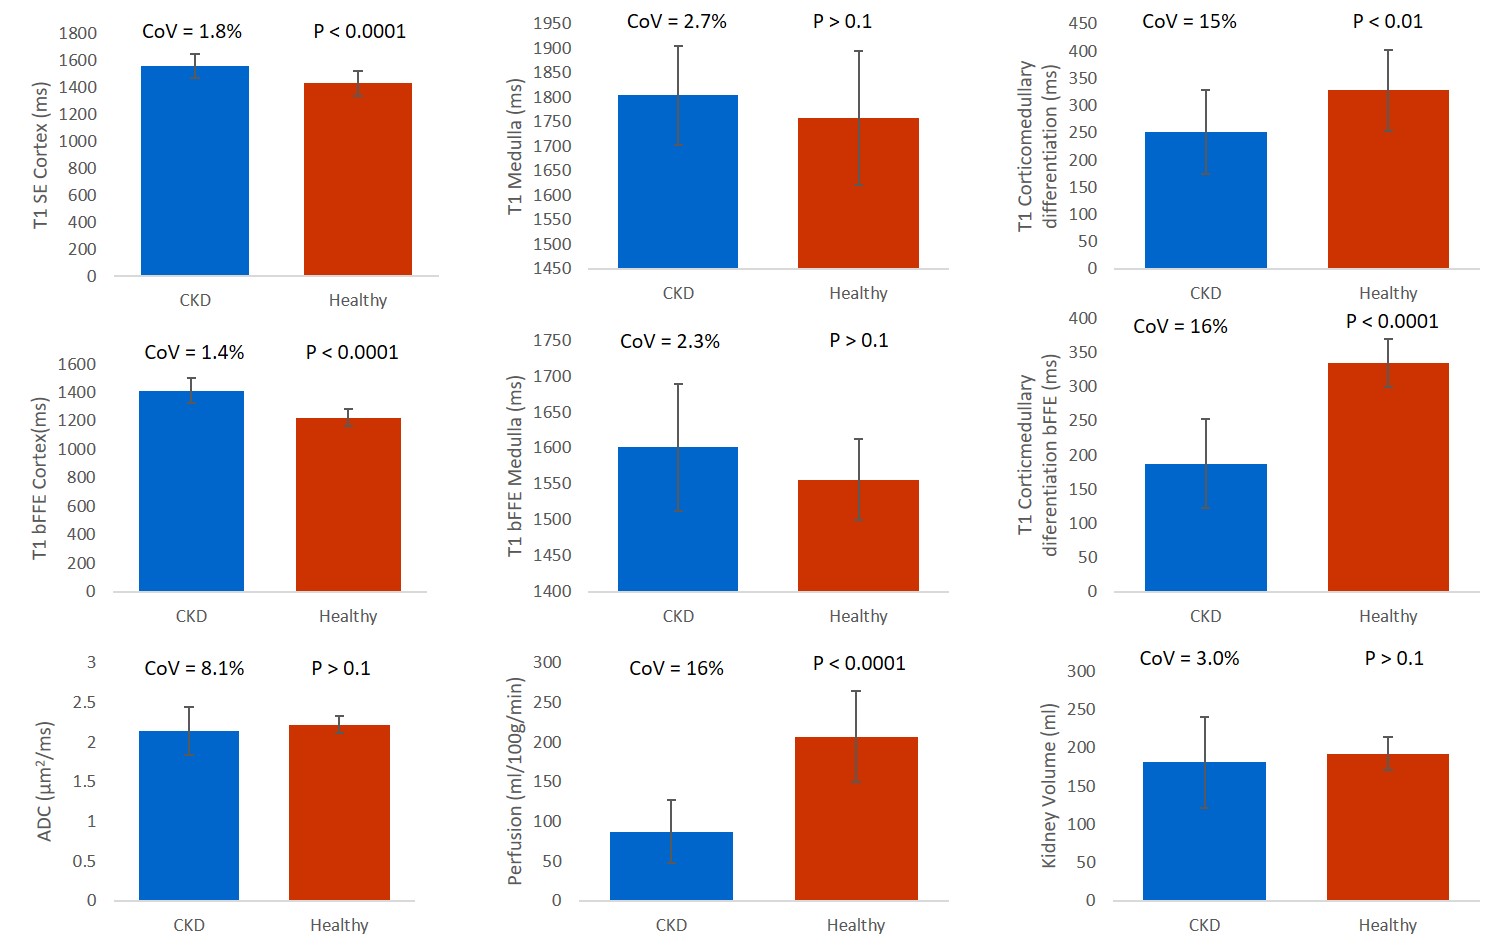
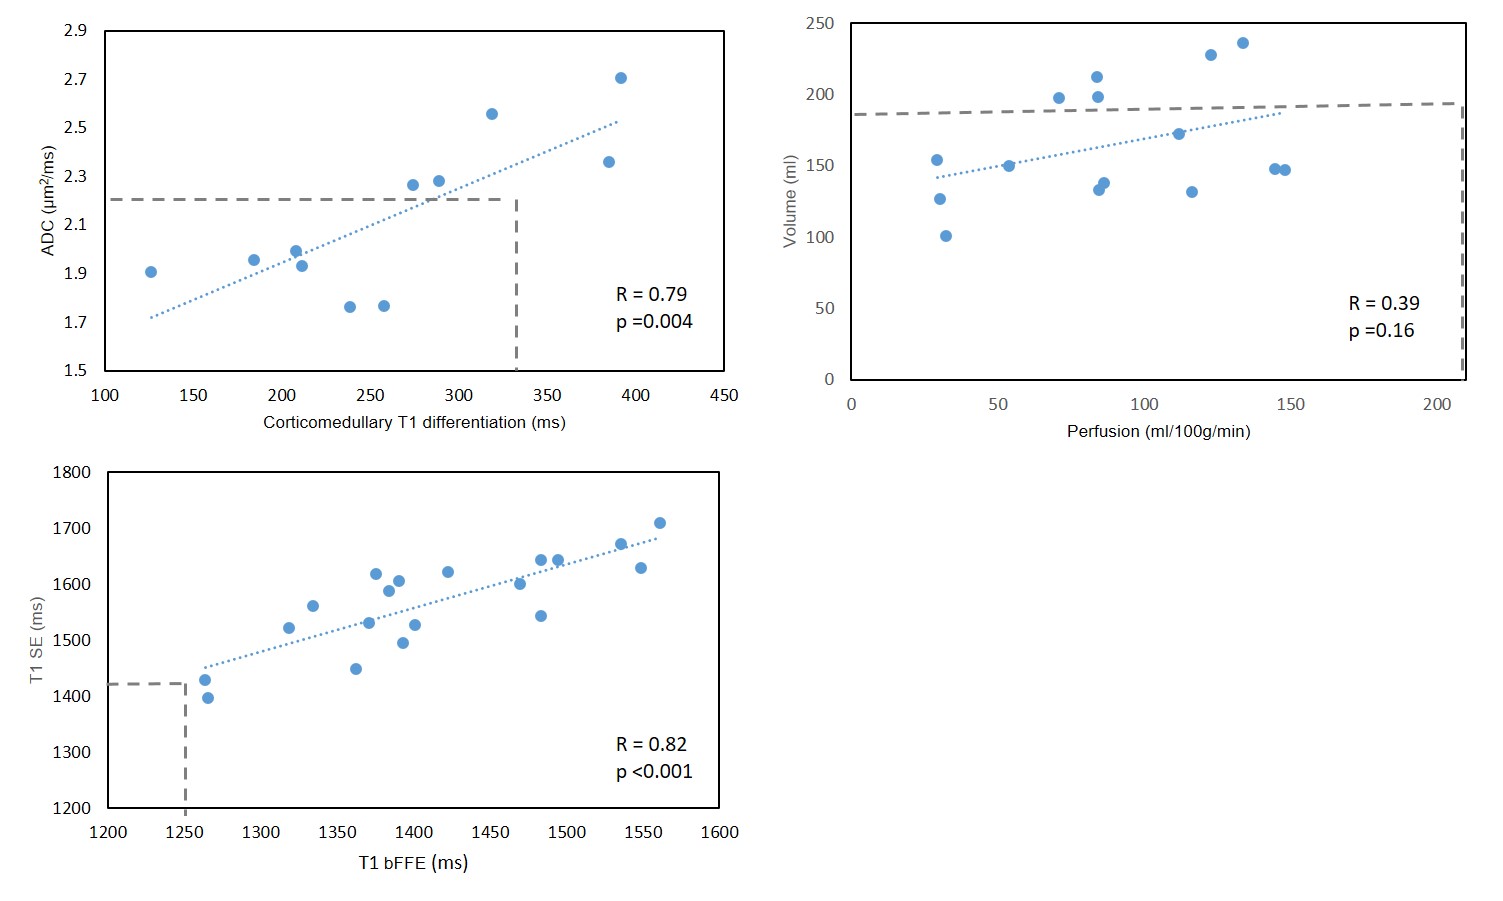
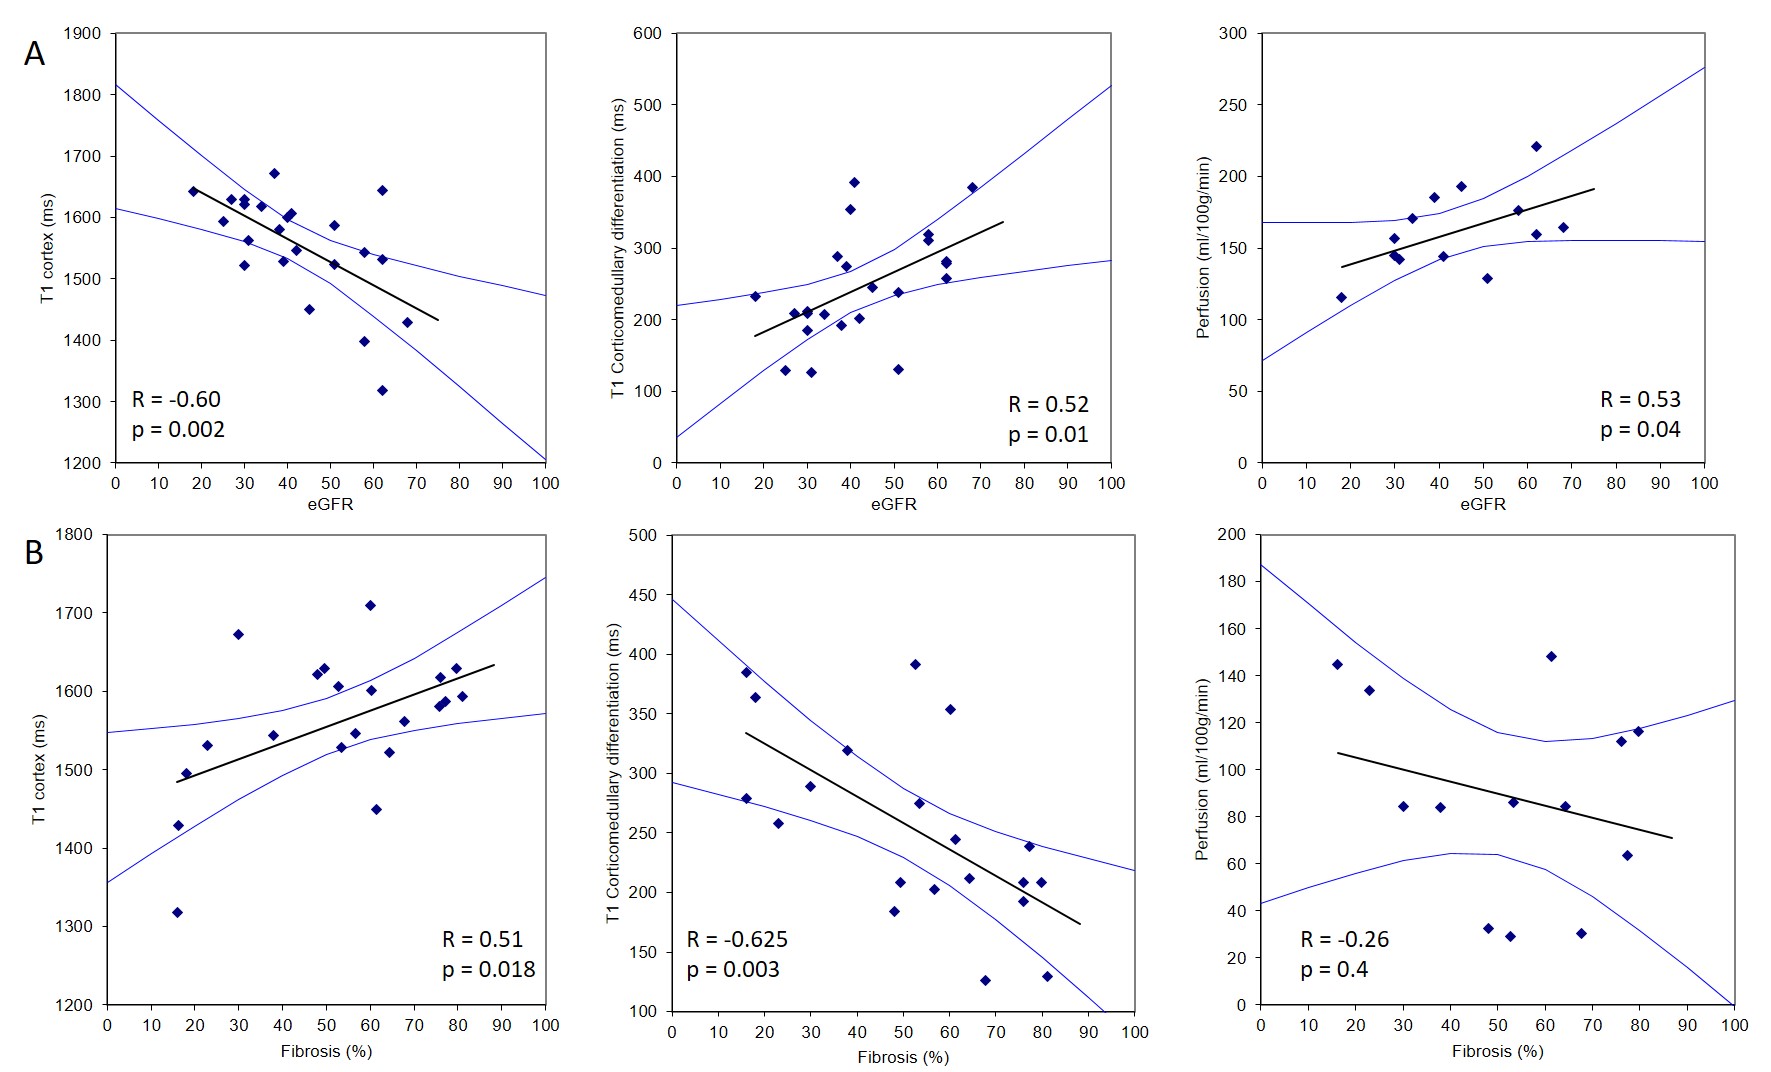
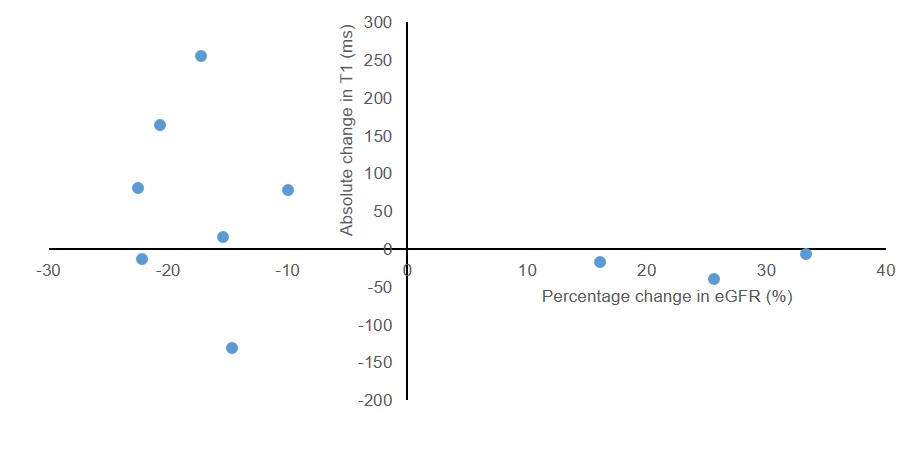
Figure 1 compares MRI parameters in CKD patients and the HV group, with the CoV in CKD patients and the t-test between CKD and HV provided. T1 was significantly increased in CKD patients compared to HVs (p < 0.001), with a low CoV. Corticomedullary differentiation in T1 was significantly lower in CKD patients, and more pronounced in the bFFE data, likely due to reduced partial volume effects. ADC and D reduced in CKD patients, but not significantly. There was no significant difference in kidney volume or T2* between CKD patients and HVs, despite a low CoV in these measures. A significant correlation was seen between T1 corticomedullary differentiation and ADC, with no correlation seen between perfusion and kidney volume, Figure 2. Correlating MRI parameters with clinical measures, a significant negative correlation was found between renal cortex T1 and eGFR, and positive correlation of corticomedullary differentiation and perfusion with eGFR (Figure 3A). Renal cortex T1 and corticomedullary differentiation correlated most strongly with quantitative biopsy measures of renal interstitial fibrosis (IF) (Figure 3B). At Year 1, the majority of patients remained stable, with no significant change in eGFR or creatinine and a significant increase in urine protein creatinine, likely secondary to medical intervention. There was a trend for change in T1 associated with progression (Figure 4).Discussion:
This study has used multi-parametric measures to show those MRI parameters which are significantly different in CKD patients compared to HVs, and has shown good reproducibility. T1 measures correlate with eGFR and biopsy scores, and suggest progression. Long term follow-up will identify which MRI measures best correlate with outcomes.Acknowledgements
This work was funded by an MRC Confidence in Concept Award and the Dr Hadwen Trust. The Dr Hadwen Trust (DHT) is the UK’s leading non-animal biomedical research charity that exclusively funds and promotes human-relevant research that replaces the use of animals whilst supporting the progress of medicine.References
1. Rossi C, Artunc F et al. Histogram analysis of renal arterial spin labeling perfusion data reveals differences between volunteers and patients with mild chronic kidney disease. Invest Radiol, 2012; 47(8); 490-6.
2. Tan H, Koktzoglou I, Prasad PV. Renal perfusion imaging with two-dimensional navigator gated arterial spin labeling. Magn Reson Medl 2014 Febl 71(2) 570-9.
3. Gillis KA, McComb C, Patel RK. Non-contrast magnetic resonance imaging to assess perfusion and corticomedullary differentiation in health and chronic kidney disease. Nephron, 2016; 133(3) 183-92
4. Friedli I, Crowe LA, Berchtold et al. New magnetic resonance imaging index for renal fibrosis assessment: a comparison between diffusion weighted imaging and T1 mapping with histological validation. Nature scientific reports; 2016; 10.1038.
5. Goyal A, Sharma R, Bhalia AS et al. Diffusion-weighted MRI in assessment of renal dysfunction. Indian J Radiol Imaging; 2012; 22(3);155-9.
6. Multiparametric Renal Magnetic Resonance Imaging: Validation, Interventions, and Alterations in Chronic Kidney Disease. Cox EF, Buchanan CE, Bradley CR, Prestwich B, Mahmoud H, Taal M, Selby NM, Francis ST. Front Physiol. 2017;8:696.
Figures