4581
Multiparametric MRI for assessment of renal transplant fibrosis: preliminary results.1Translational and Molecular Imaging Institute, Icahn School of Medicine at Mount Sinai Hospital, New York, NY, United States, 2Radiology, Icahn School of Medicine at Mount Sinai Hospital, New York, NY, United States, 3University Hospital Zurich, Zurich, Switzerland, 4Groupe Hospitalier Pitie-Salpetriere, Paris, France, 5Recanati-Miller Transplantation Institute, Icahn School of Medicine at Mount Sinai Hospital, New York, NY, United States, 6Pathology, Icahn School of Medicine at Mount Sinai Hospital, New York, NY, United States
Synopsis
The goal of our study is to develop a multiparametric MRI (mpMRI) protocol for the assessment of renal transplant fibrosis. Our initial results show decrease of cortical and medullary ADC, cortical D and PF, and increase of cortical T1 in fibrotic allografts compared to functional allografts. We also observed loss of corticomedullary differentiation in ADC and T1 with fibrosis. We conclude that diffusion and T1 measurements are sensitive to renal allograft fibrosis, to be confirmed in a larger study.
Introduction
Detection and quantification of fibrosis in renal allografts can identify patients at risk of progression to renal dysfunction 1, and enable evaluation of the efficacy of novel anti-fibrotic agents in clinical trials 2. The reference standard for evaluating renal fibrosis is histopathologic analysis of biopsy samples. However, biopsy is invasive, prone to sampling errors and difficult to repeat, and can result in complications such as bleeding. The goal of our study is to develop a quantitative multiparametric MRI (mpMRI) protocol for the evaluation of renal transplant fibrosis.Methods
21
initial patients including 15 with functional renal allografts (M/F 9/6 mean
age 55.2 y, estimated MDRD serum eGFR 47.6-87 ml/min/1.73m2) and 6
with chronic dysfunction and fibrosis (M/F, 2/4, mean age 57.7y, eGFR 15.9- 59
ml/min/1.73 m2, biopsy performed 150 ± 48
days before MRI) were enrolled in this IRB-approved single center prospective
study. All subjects gave signed informed consent. All patients underwent mpMRI
at 1.5T (Aera, Siemens) including intravoxel-incoherent motion DWI (IVIM-DWI), diffusion
tensor imaging (DTI), blood oxygen level dependent (BOLD) and T1 mapping
(Table 1). DTI fractional anisotropy (FA) maps were calculated from the eigenvalues
of diffusion tensors.
IVIM-DWI, T1 and BOLD signal curves, and DTI FA values, were
measured from circular ROIs placed in the cortex and medulla at the upper, middle
and lower renal allograft poles. IVIM-DWI parameters (true diffusion D,
pseudodiffusion D*, perfusion fraction PF) were obtained by Bayesian fitting 3. Cortex and medulla MRI parameters were
averaged across polar ROIs. Corticomedullary percentage differences [100 x
(cortex-medulla)/cortex] in ADC (ΔADC),
FA (ΔFA), R2* (ΔR2*), and T1 (ΔT1), were also calculated. MRI parameters were
compared between functional and fibrotic allografts using the Mann-Whitney
test. Spearman correlations were calculated between cortical MRI parameters and
cortical biopsy score for interstitial fibrosis (ci), tubular atrophy (ct)
Banff scores, combined interstitial fibrosis/tubular atrophy (IFTA=ci+ct) and
inflammation (i)4.Results
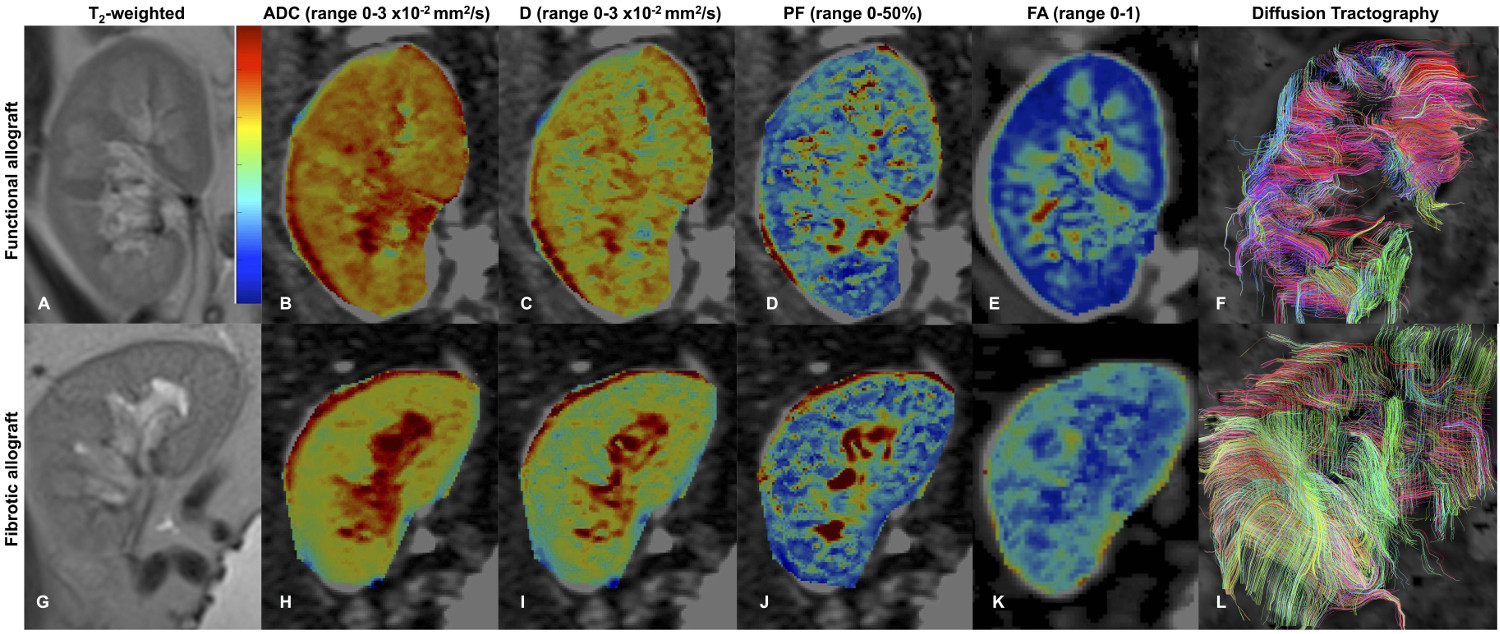
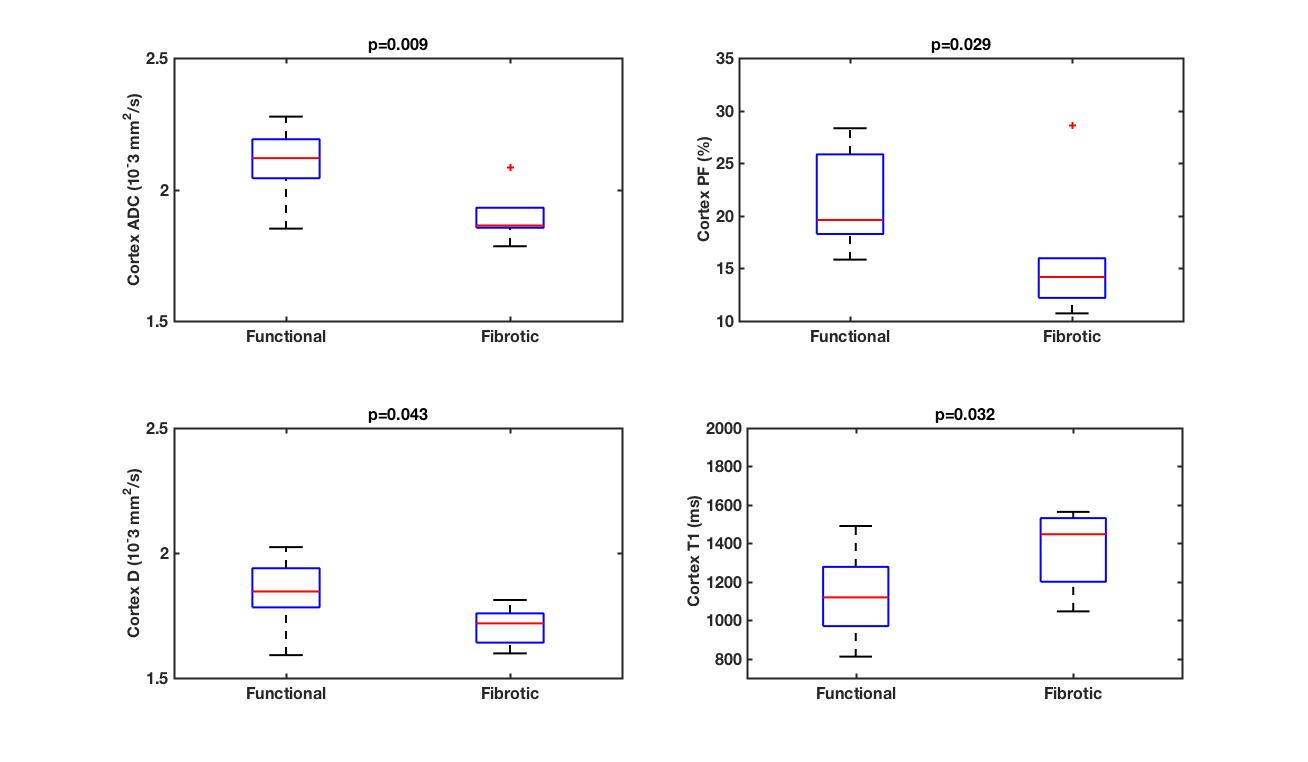
Among patients with fibrotic allografts, the majority had moderate fibrosis (ci+ct=4: n=5/6 patients, ci+ct=2: n=1), and no inflammation (i=0: n=4/6). FA and T1 were measured in all patients. IVIM and R2* measurements could not be obtained in 1/7 fibrotic allografts, and in 1/14 stable allografts, respectively, due to poor image quality. Qualitative assessment of advanced diffusion parametric maps (Fig. 1) shows decreased values in fibrotic vs. functional allografts, which is confirmed by the quantitative analysis (Fig. 2-4). Cortical ADC, PF and D as well as medullary ADC were significantly decreased in fibrotic allografts (Table 2, Fig. 2). ΔADC was not significantly different between fibrotic and functional allografts, although there is loss of the corticomedullary differentiation in ADC observed in functional allografts [e.g. Table 2, significantly elevated cortex ADC compared to medulla in healthy allografts, (p=0.042), and no significant difference in ADC observed in fibrotic allografts (p>0.999)]. There was significant decrease in ΔFA in fibrotic allografts (Table 2), and loss of corticomedullary differentiation [Table 2, significantly elevated FA in the medulla compared to cortex of functional allografts (p<0.001), but not of fibrotic allografts (p=0.06)]. Cortical T1 was significantly elevated, and ΔT1 significantly decreased in fibrotic allografts (Table 2). We also observed loss of corticomedullary differentiation in T1 [Table 2: T1 significantly elevated in medulla compared to cortex of functional allografts (p<0.001), compared to no significant difference between cortex and medulla of fibrotic allografts, p=0.438). There were no significant differences in FA, R2*, or ΔR2* between fibrotic and functional allografts. There were no significant correlations between MRI parameters and pathology scores (p=0.06-0.99).Discussion
Our study confirms earlier findings of decreased corticomedullary ΔADC and ΔT1 with renal allograft fibrosis 5. The observed decrease in ADC, D and PF with fibrosis is in agreement with findings in a murine model of renal fibrosis 6 and with human studies correlating ADC and IVIM parameters with fibrosis 7 and renal function 8. Increased medullary FA compared is expected in normal allografts, and the loss of corticomedullary difference in FA is consistent with changes in the medulla with renal dysfunction9. Prolonged T1 with tissue fibrosis and inflammation also agrees with previous studies 5,10. Due to the small number of patients with fibrosis, and the reduced range of pathology scores, we were unable to reproduce correlations between ΔADC and ΔT1 and pathology observed in a larger study 5.Conclusion
Our preliminary data shows the sensitivity of IVIM-DWI and T1 parameters to allograft fibrosis in renal transplant patients. The value of mpMRI-derived metrics in combination for characterizing renal transplant fibrosis will be confirmed in a larger study.Acknowledgements
Acknowledgements This research was supported by the National Institutes of Health NIDDK Grant 1F32DK109591, Society of Abdominal Radiology (SAR) Morton Bosniak Research Award, and Guerbet LLC GrantReferences
1. Leung G, Kirpalani A, Szeto SG, et al. Could MRI Be Used To Image Kidney Fibrosis? A Review of Recent Advances and Remaining Barriers. Clinical journal of the American Society of Nephrology : CJASN 2017.
2. Boor P, Floege J. Renal allograft fibrosis: biology and therapeutic targets. American journal of transplantation : official journal of the American Society of Transplantation and the American Society of Transplant Surgeons 2015;15(4):863-886.
3. Jerome NP, Orton MR, d'Arcy JA, Collins DJ, Koh DM, Leach MO. Comparison of free-breathing with navigator-controlled acquisition regimes in abdominal diffusion-weighted magnetic resonance images: Effect on ADC and IVIM statistics. Journal of magnetic resonance imaging : JMRI 2014;39(1):235-240.
4. Loupy A, Haas M, Solez K, et al. The Banff 2015 Kidney Meeting Report: Current Challenges in Rejection Classification and Prospects for Adopting Molecular Pathology. American journal of transplantation : official journal of the American Society of Transplantation and the American Society of Transplant Surgeons 2017;17(1):28-41.
5. Friedli I, Crowe LA, Berchtold L, et al. New Magnetic Resonance Imaging Index for Renal Fibrosis Assessment: A Comparison between Diffusion-Weighted Imaging and T1 Mapping with Histological Validation. Scientific reports 2016;6:30088.
6. Boor P, Perkuhn M, Weibrecht M, et al. Diffusion-weighted MRI does not reflect kidney fibrosis in a rat model of fibrosis. Journal of magnetic resonance imaging : JMRI 2015;42(4):990-998.
7. Inoue T, Kozawa E, Okada H, et al. Noninvasive evaluation of kidney hypoxia and fibrosis using magnetic resonance imaging. Journal of the American Society of Nephrology : JASN 2011;22(8):1429-1434.
8. Thoeny HC, Zumstein D, Simon-Zoula S, et al. Functional evaluation of transplanted kidneys with diffusion-weighted and BOLD MR imaging: initial experience. Radiology 2006;241(3):812-821.
9. Lanzman RS, Ljimani A, Pentang G, et al. Kidney transplant: functional assessment with diffusion-tensor MR imaging at 3T. Radiology 2013;266(1):218-225.
10. Hueper K, Peperhove M, Rong S, et al. T1-mapping for assessment of ischemia-induced acute kidney injury and prediction of chronic kidney disease in mice. European radiology 2014;24(9):2252-2260.
Figures
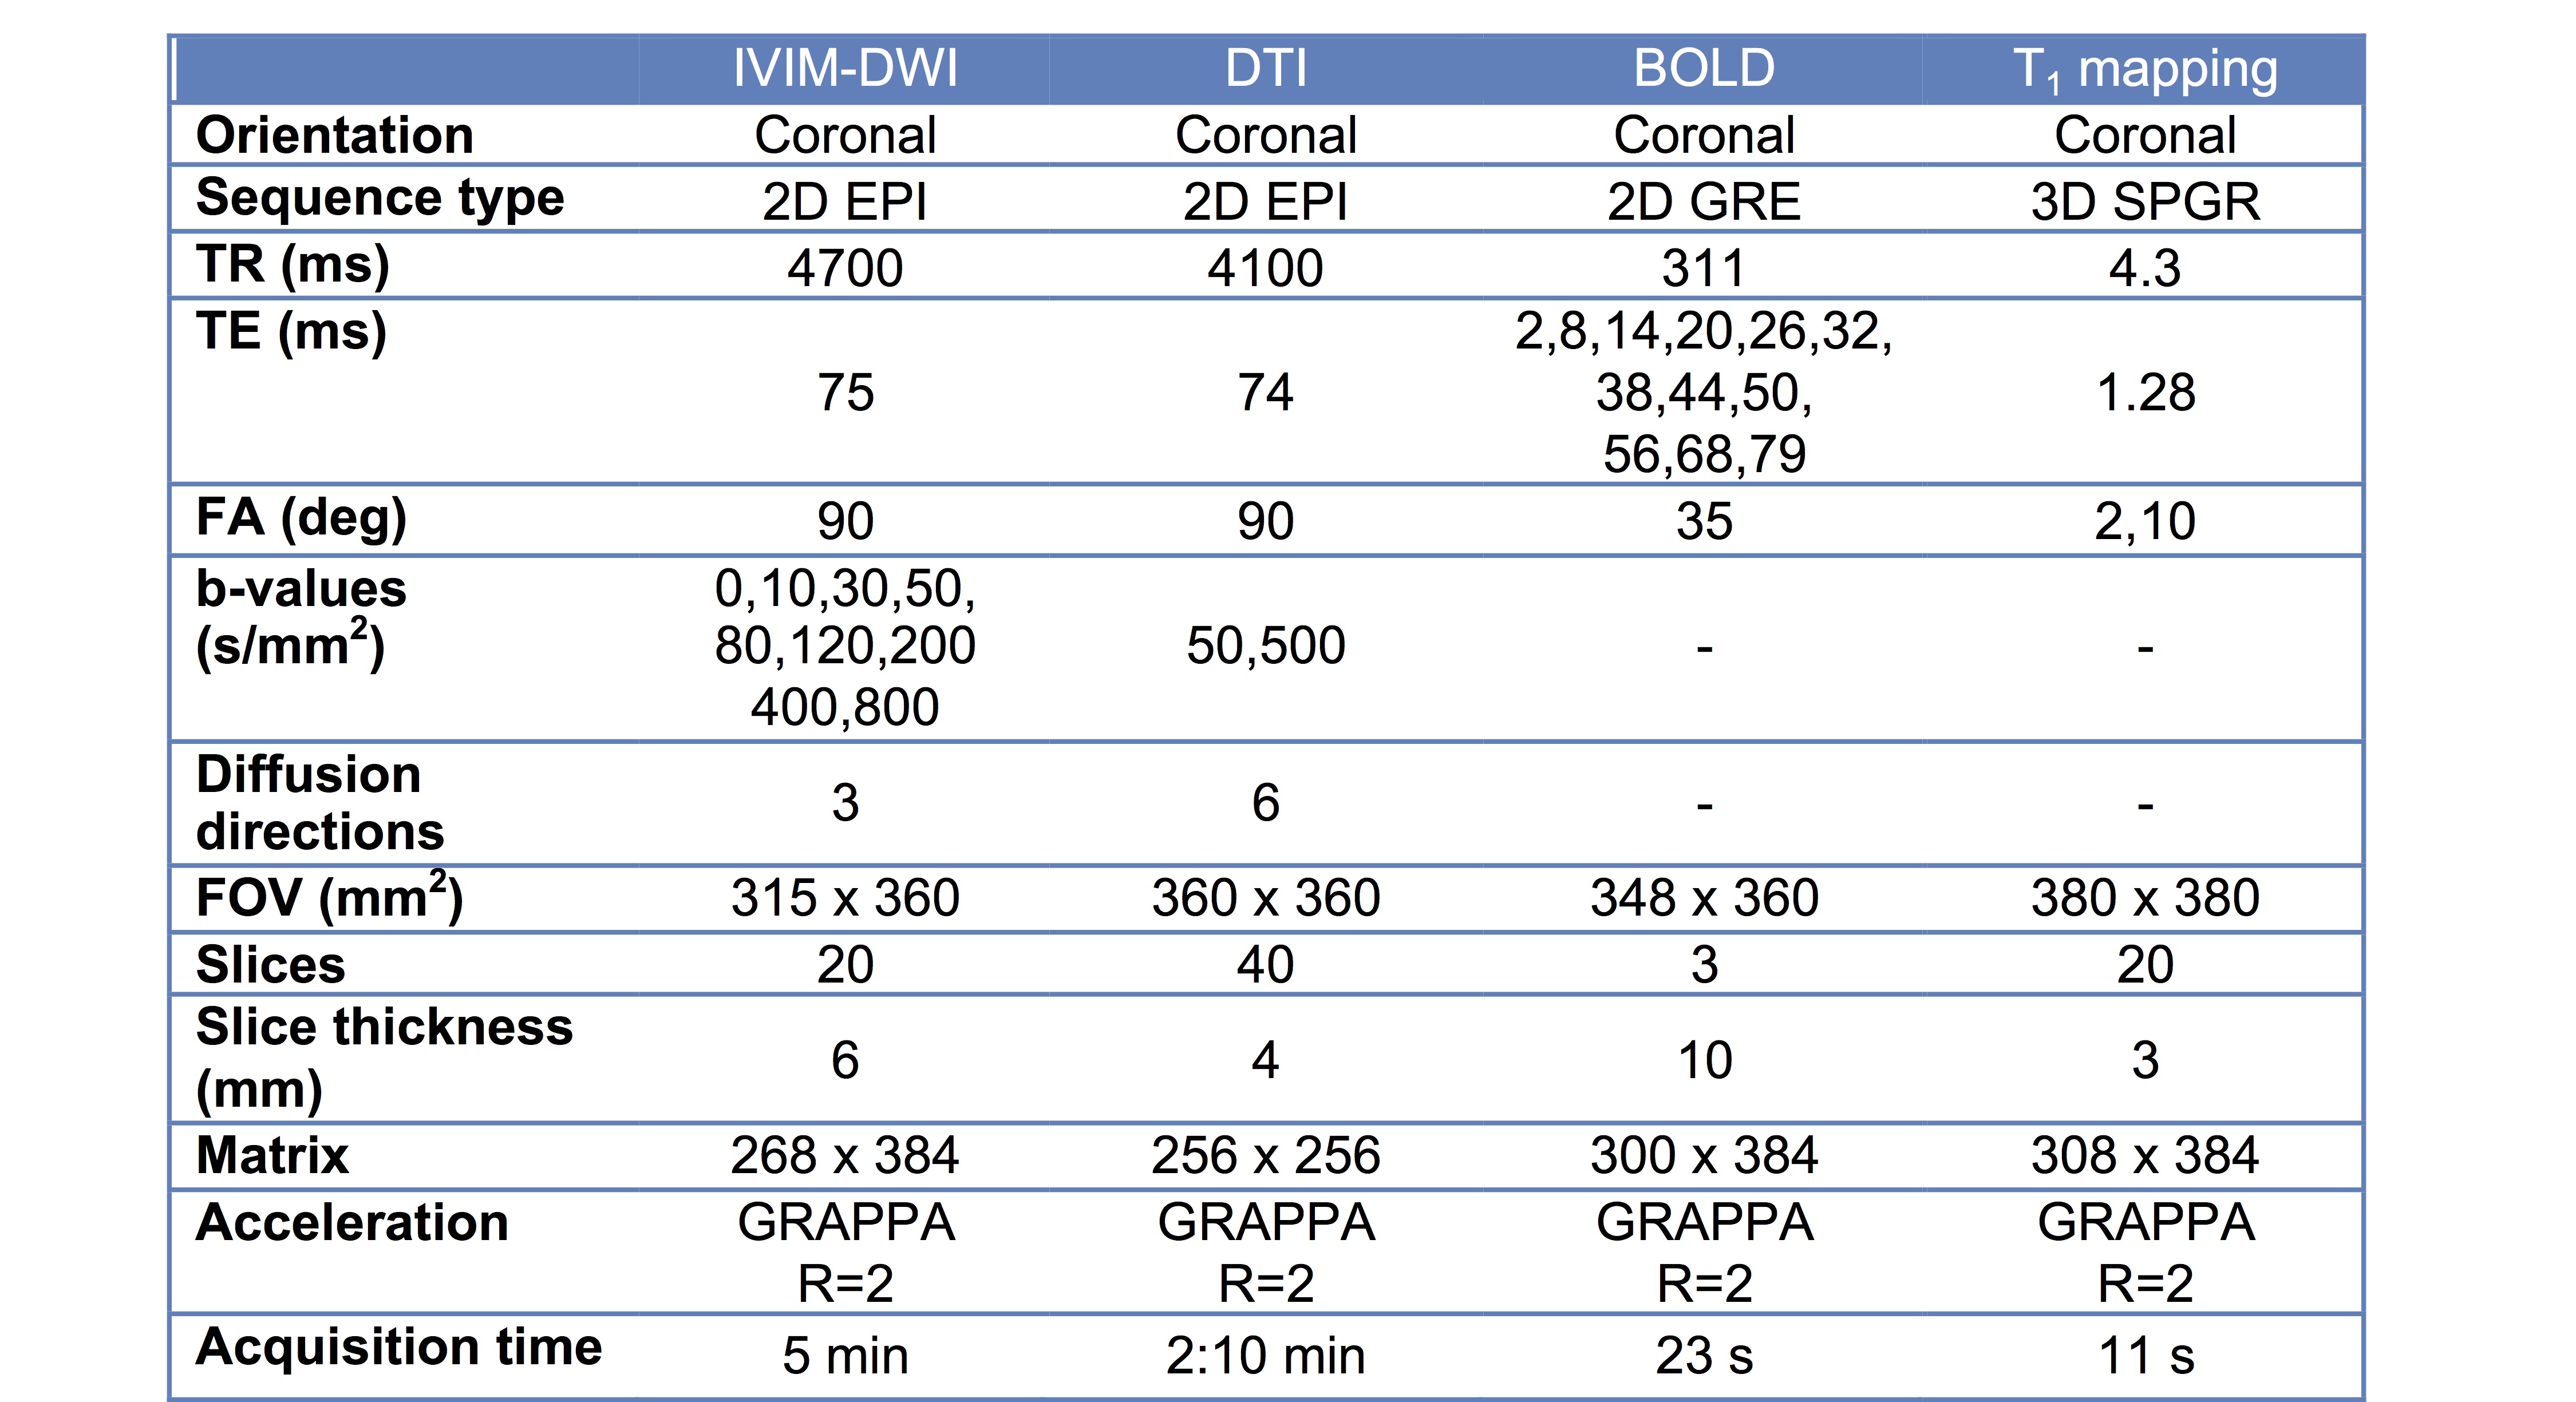
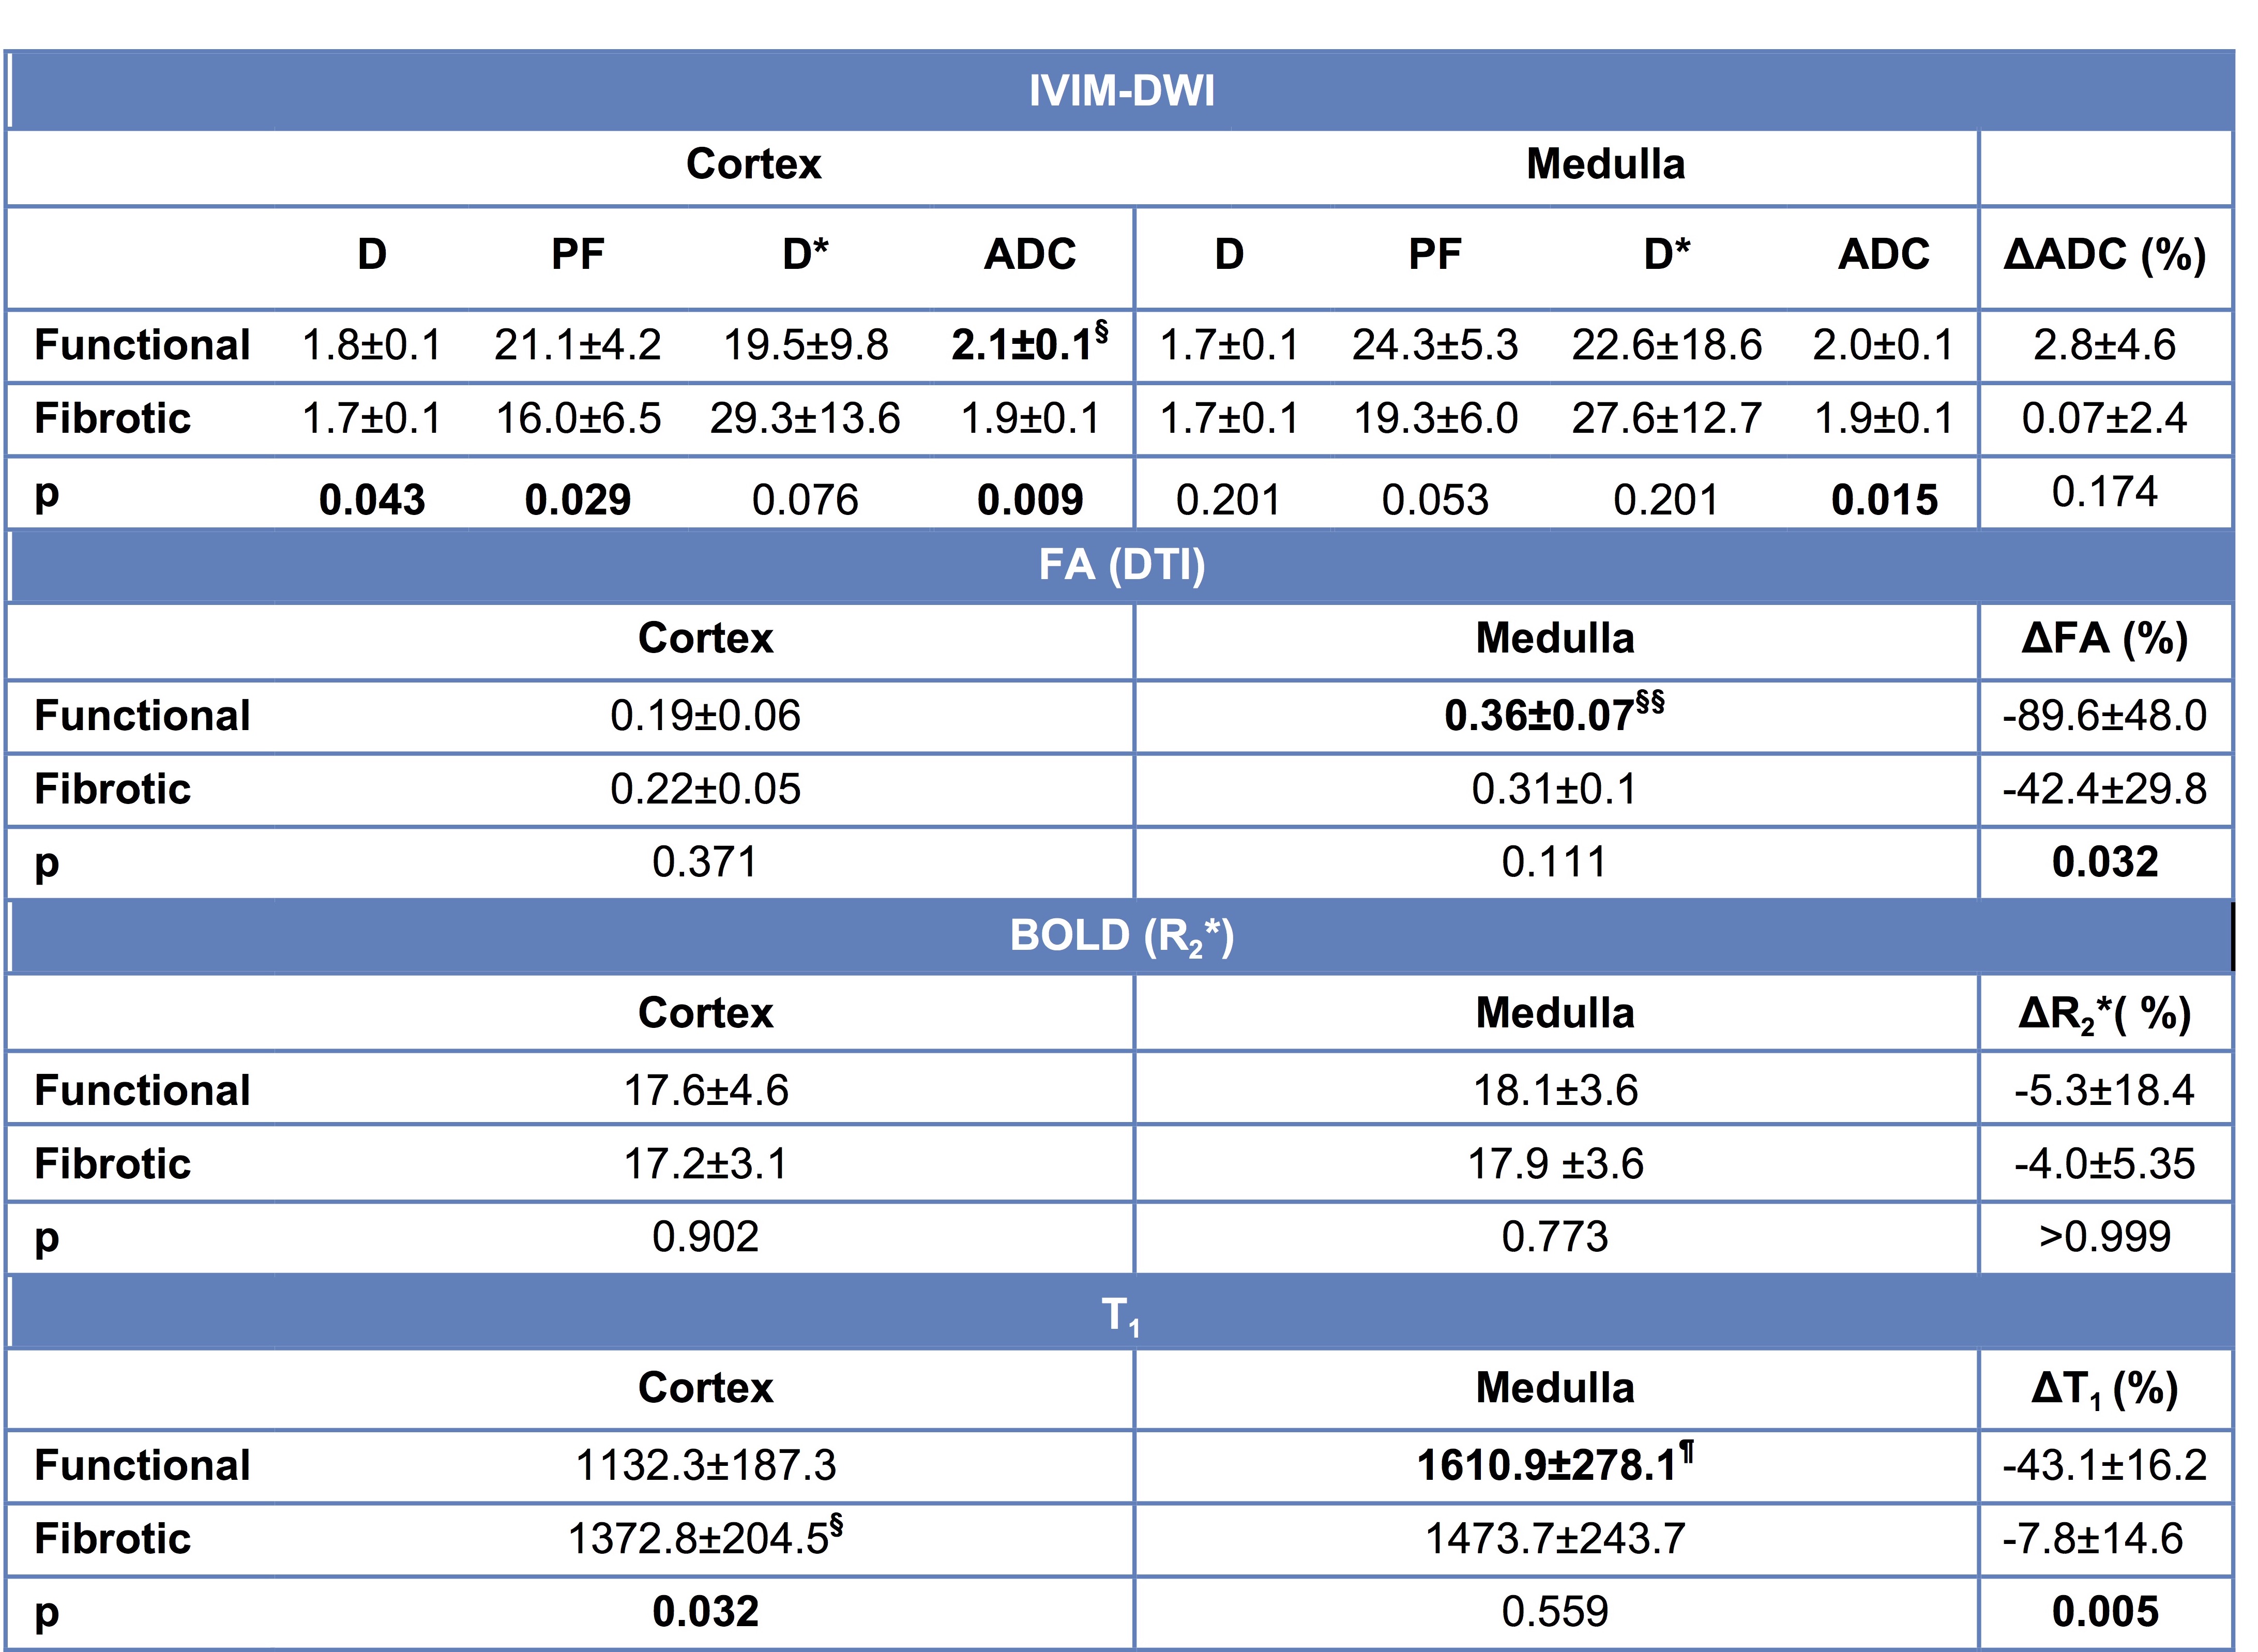
Table 2. mpMRI parameters in the functional and fibrotic allografts. IVIM-DWI parameters: true diffusion coefficient D (10-3 mm2/s), perfusion fraction PF (%), pseudo-diffusion coefficient D* (10-3 mm2/s), apparent diffusion coefficient ADC (10-3 mm2/s); DTI: fractional anisotropy FA (adimensional); BOLD: R2* (s-1), T1 (ms).
§Significantly higher ADC in the cortex compared to medulla of functional allografts (p=0.042).
§§Significantly higher FA in the medulla compared to cortex of functional allografts (p<0.001).
¶Significantly higher T1 in the medulla (p<0.001) compared to the cortex of functional allografts.