4580
Renal BOLD & Diffusion MRI in CKD: First Application to a Multi-center Trial1Northshore University Healthsystem, Evanston, IL, United States, 2Northwestern University School of Medicien, Chicago, IL, United States
Synopsis
There is growing interest in applying functional MRI methods to patient studies, especially BOLD and Diffusion MRI in patients with chronic kidney disease. We have had the opportunity to analyze data from a multi-center trial involving patients with advanced CKD (stage 3B & 4) with multiple etiologies. A healthy control group was used to compare the patient cohort. Data shows small increase in cortical R2*, decrease in medullary R2* and response to furosemide in CKD. ADC was reduced in CKD and was correlated with medullary R2*.
INTRODUCTION
Over the last decade, the role of chronic hypoxia in the progression of chronic kidney disease (CKD) has gained attention mostly based on pre-clinical data [1]. Blood oxygenation level dependent (BOLD) MRI is a non-invasive method currently available to evaluate relative oxygenation status of the kidney [2]. Apparent diffusion coefficient (ADC) estimated using diffusion MRI has been shown to strongly correlate with histological measures of renal fibrosis [3]. To-date, there have been few single site studies reported in the literature evaluating either BOLD [4-6] or combination of BOLD and Diffusion MRI in patients with CKD [7,8]. All these studies included CKD at all stages.
Here, we present data from a multi-site study with a large number of subjects with advanced CKD (stage 3.b and 4) and compare them to a healthy control group.
MATERIALS AND METHODS
Subjects: All procedures were performed with approval from the institutional review boards and written subject consent prior to enrollment. Subjects with stage 3B & 4 CKD with multiple etiologies (N: 127, age=65±12 years; eGFR=30±12 ml/min/1.73m2) participated at six different sites within United States. For reference, similar data was acquired in a group of healthy subjects (self reported) with normal renal function (N: 13; age: 59 ± 9 yr; eGFR: 91 ± 12 ml/min/1.73 m2). All subjects were instructed to fast after midnight on the day of the MRI and not to take NSAIDs for 3 days prior to MRI scan.
MRI acquisition methods: All MRI data was acquired on 1.5T (CKD n=4) or 3T (CKD n=123; control n=13) whole body scanners (Siemens Healthcare, Erlangen, Germany). Imaging parameters: BOLD: mGRE sequence with TR 62ms, TE 3.09 to 30.53ms, 8 echoes, slice thickness 5mm. Acquisitions were made during breath-holding and in the coronal orientation. BOLD MRI measurements were repeated following i.v. administration of 20 mg of furosemide. Diffusion MRI: Single-shot spin- echo Ech- planar-imaging sequence: TR = 3000 ms, TE = 78 ms, diffusion weighting factor b = 200, 300, 500, 700, 1000 s/mm2, slice thickness 5mm; FOV=400 mm, Matrix =192x192, # averages = 5. Acquisitions made while free breathing and in coronal plane.
MRI analysis methods: Regions of interest (ROIs) were manually defined using a custom image-processing library written in Python. For BOLD MRI data, ROIs were placed in the cortex, medulla, and whole kidney respectively [9]. For ADC data, ROIs were placed in the cortex only.
Statistical methods: Group wise comparisons were performed using two sample non-parametric Mann-Whitney U Test. Spearman correlation was performed to see associations between the MRI parameters and renal function and age. Associations between ADC and BOLD MRI measurements were also assessed. BOLD MRI data from 1.5 T was not included for the statistical analysis.
RESULTS
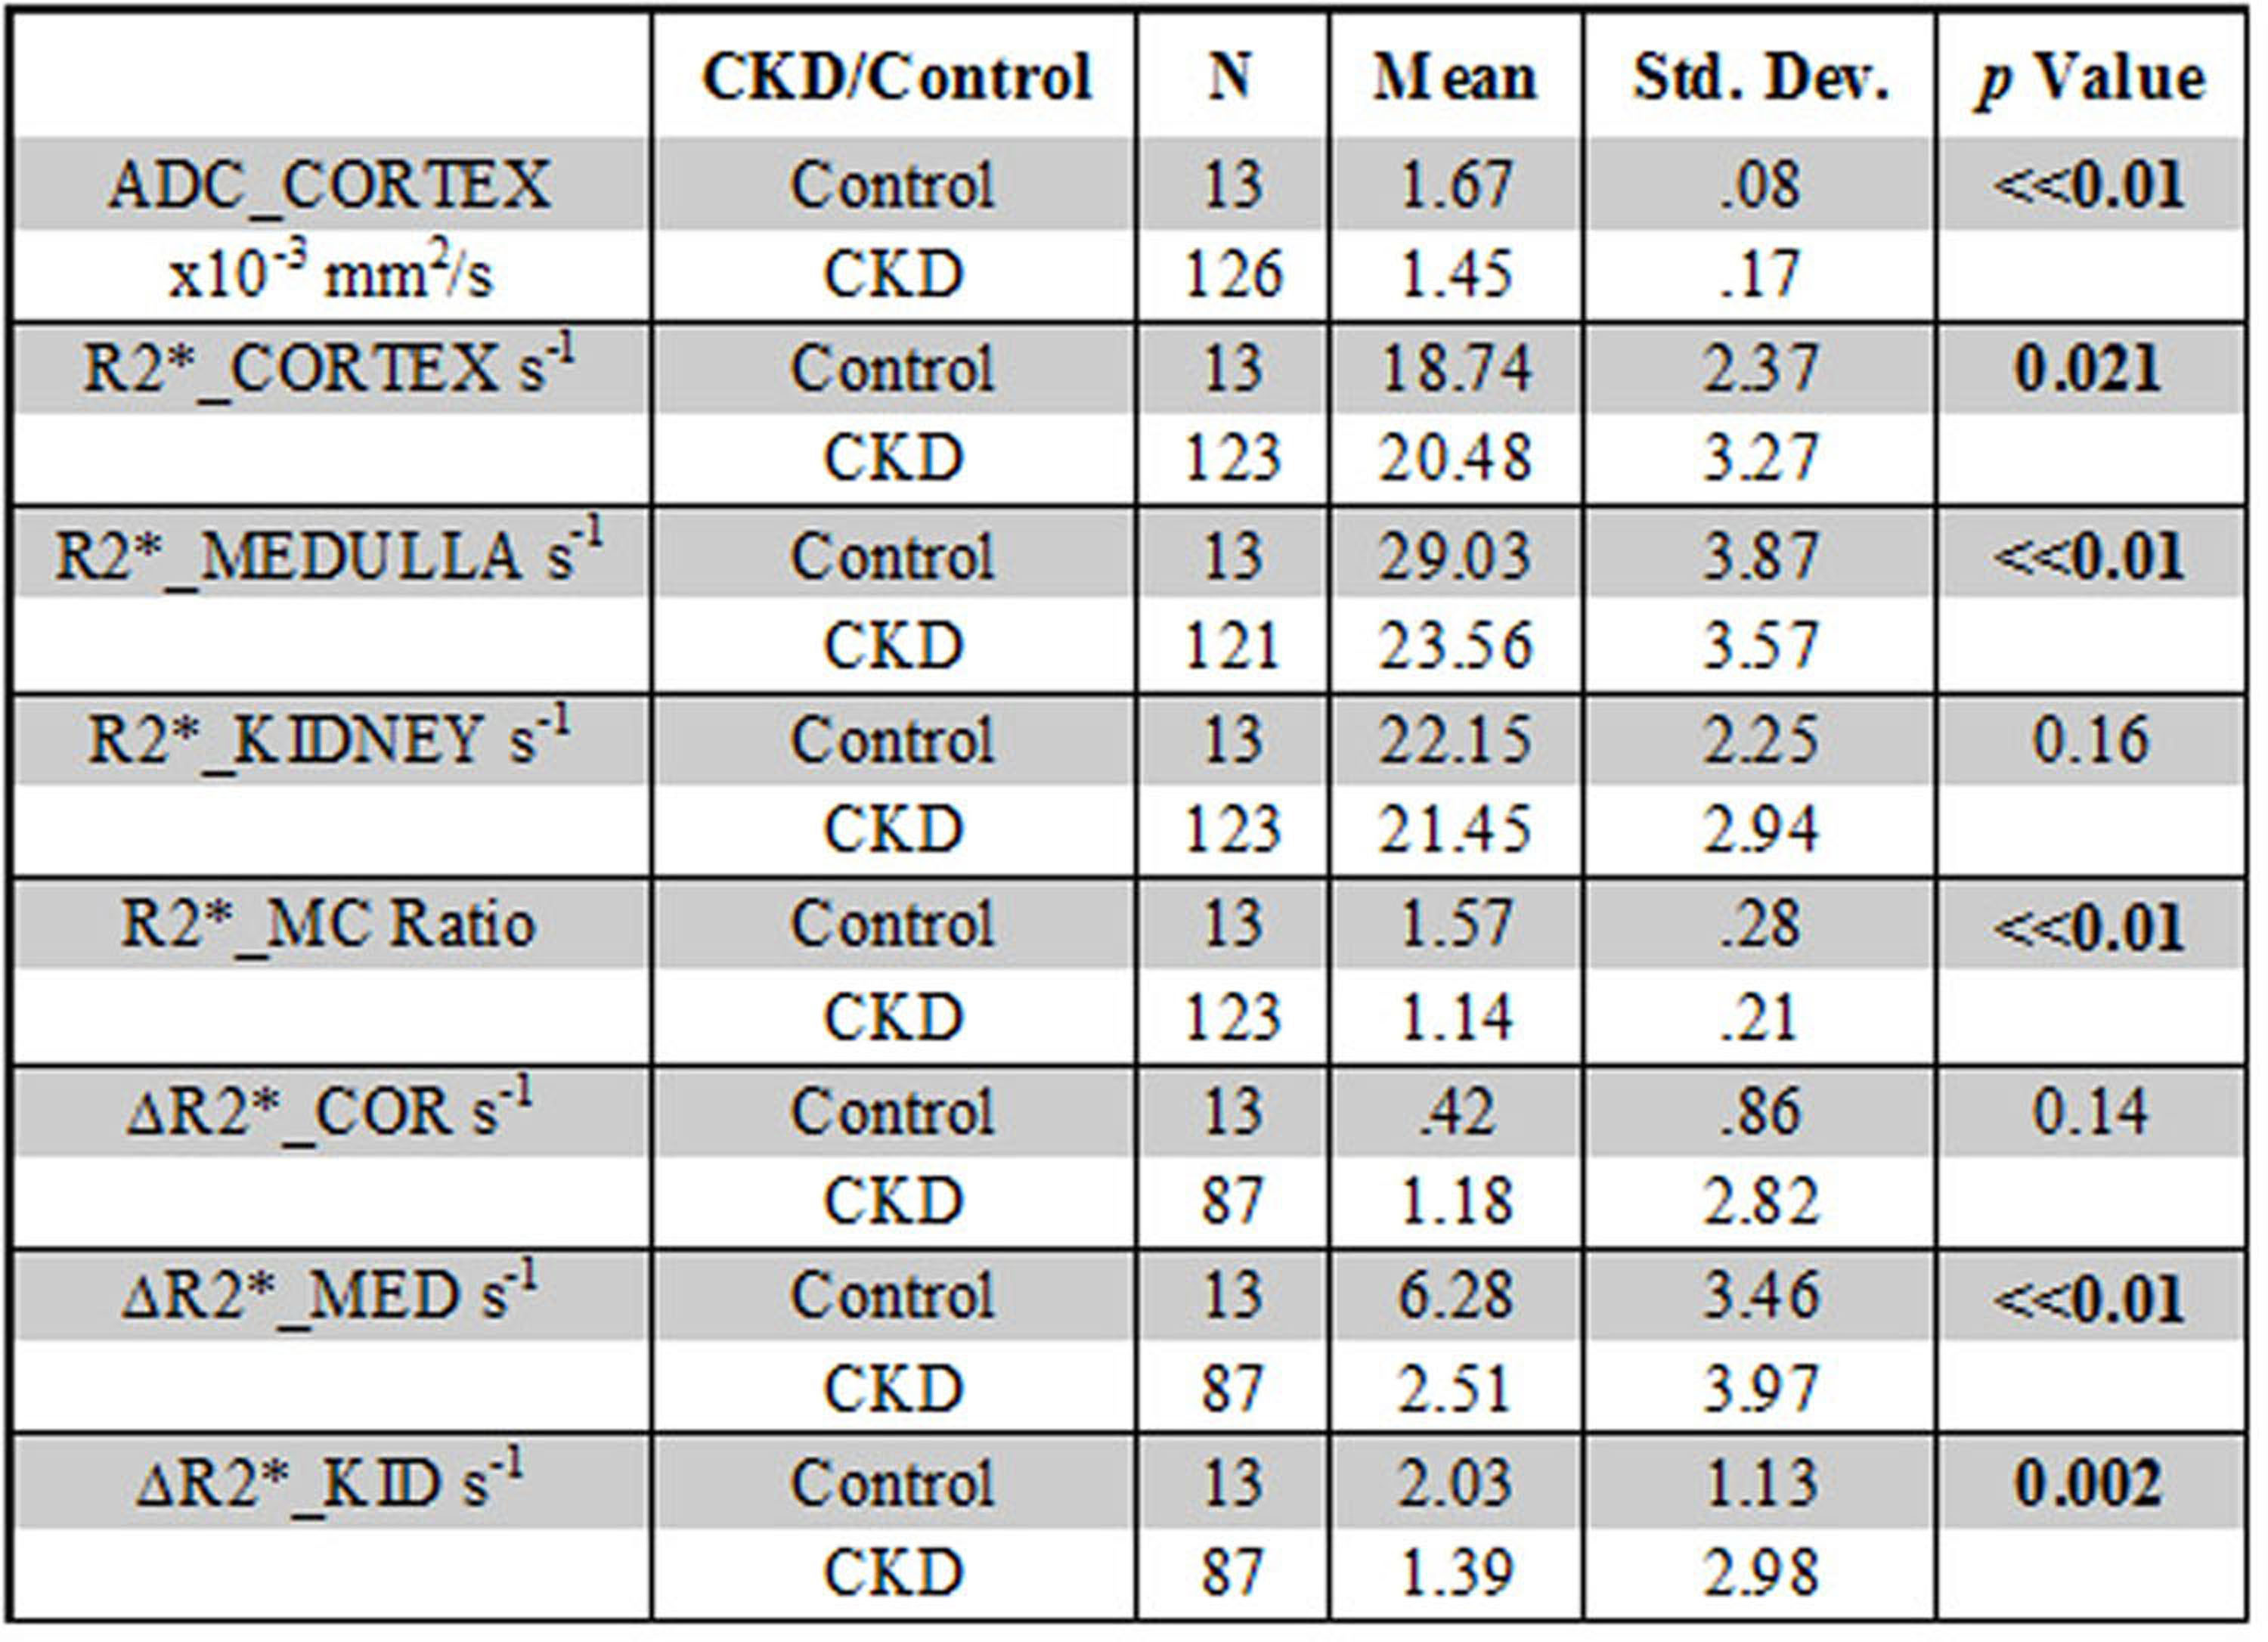
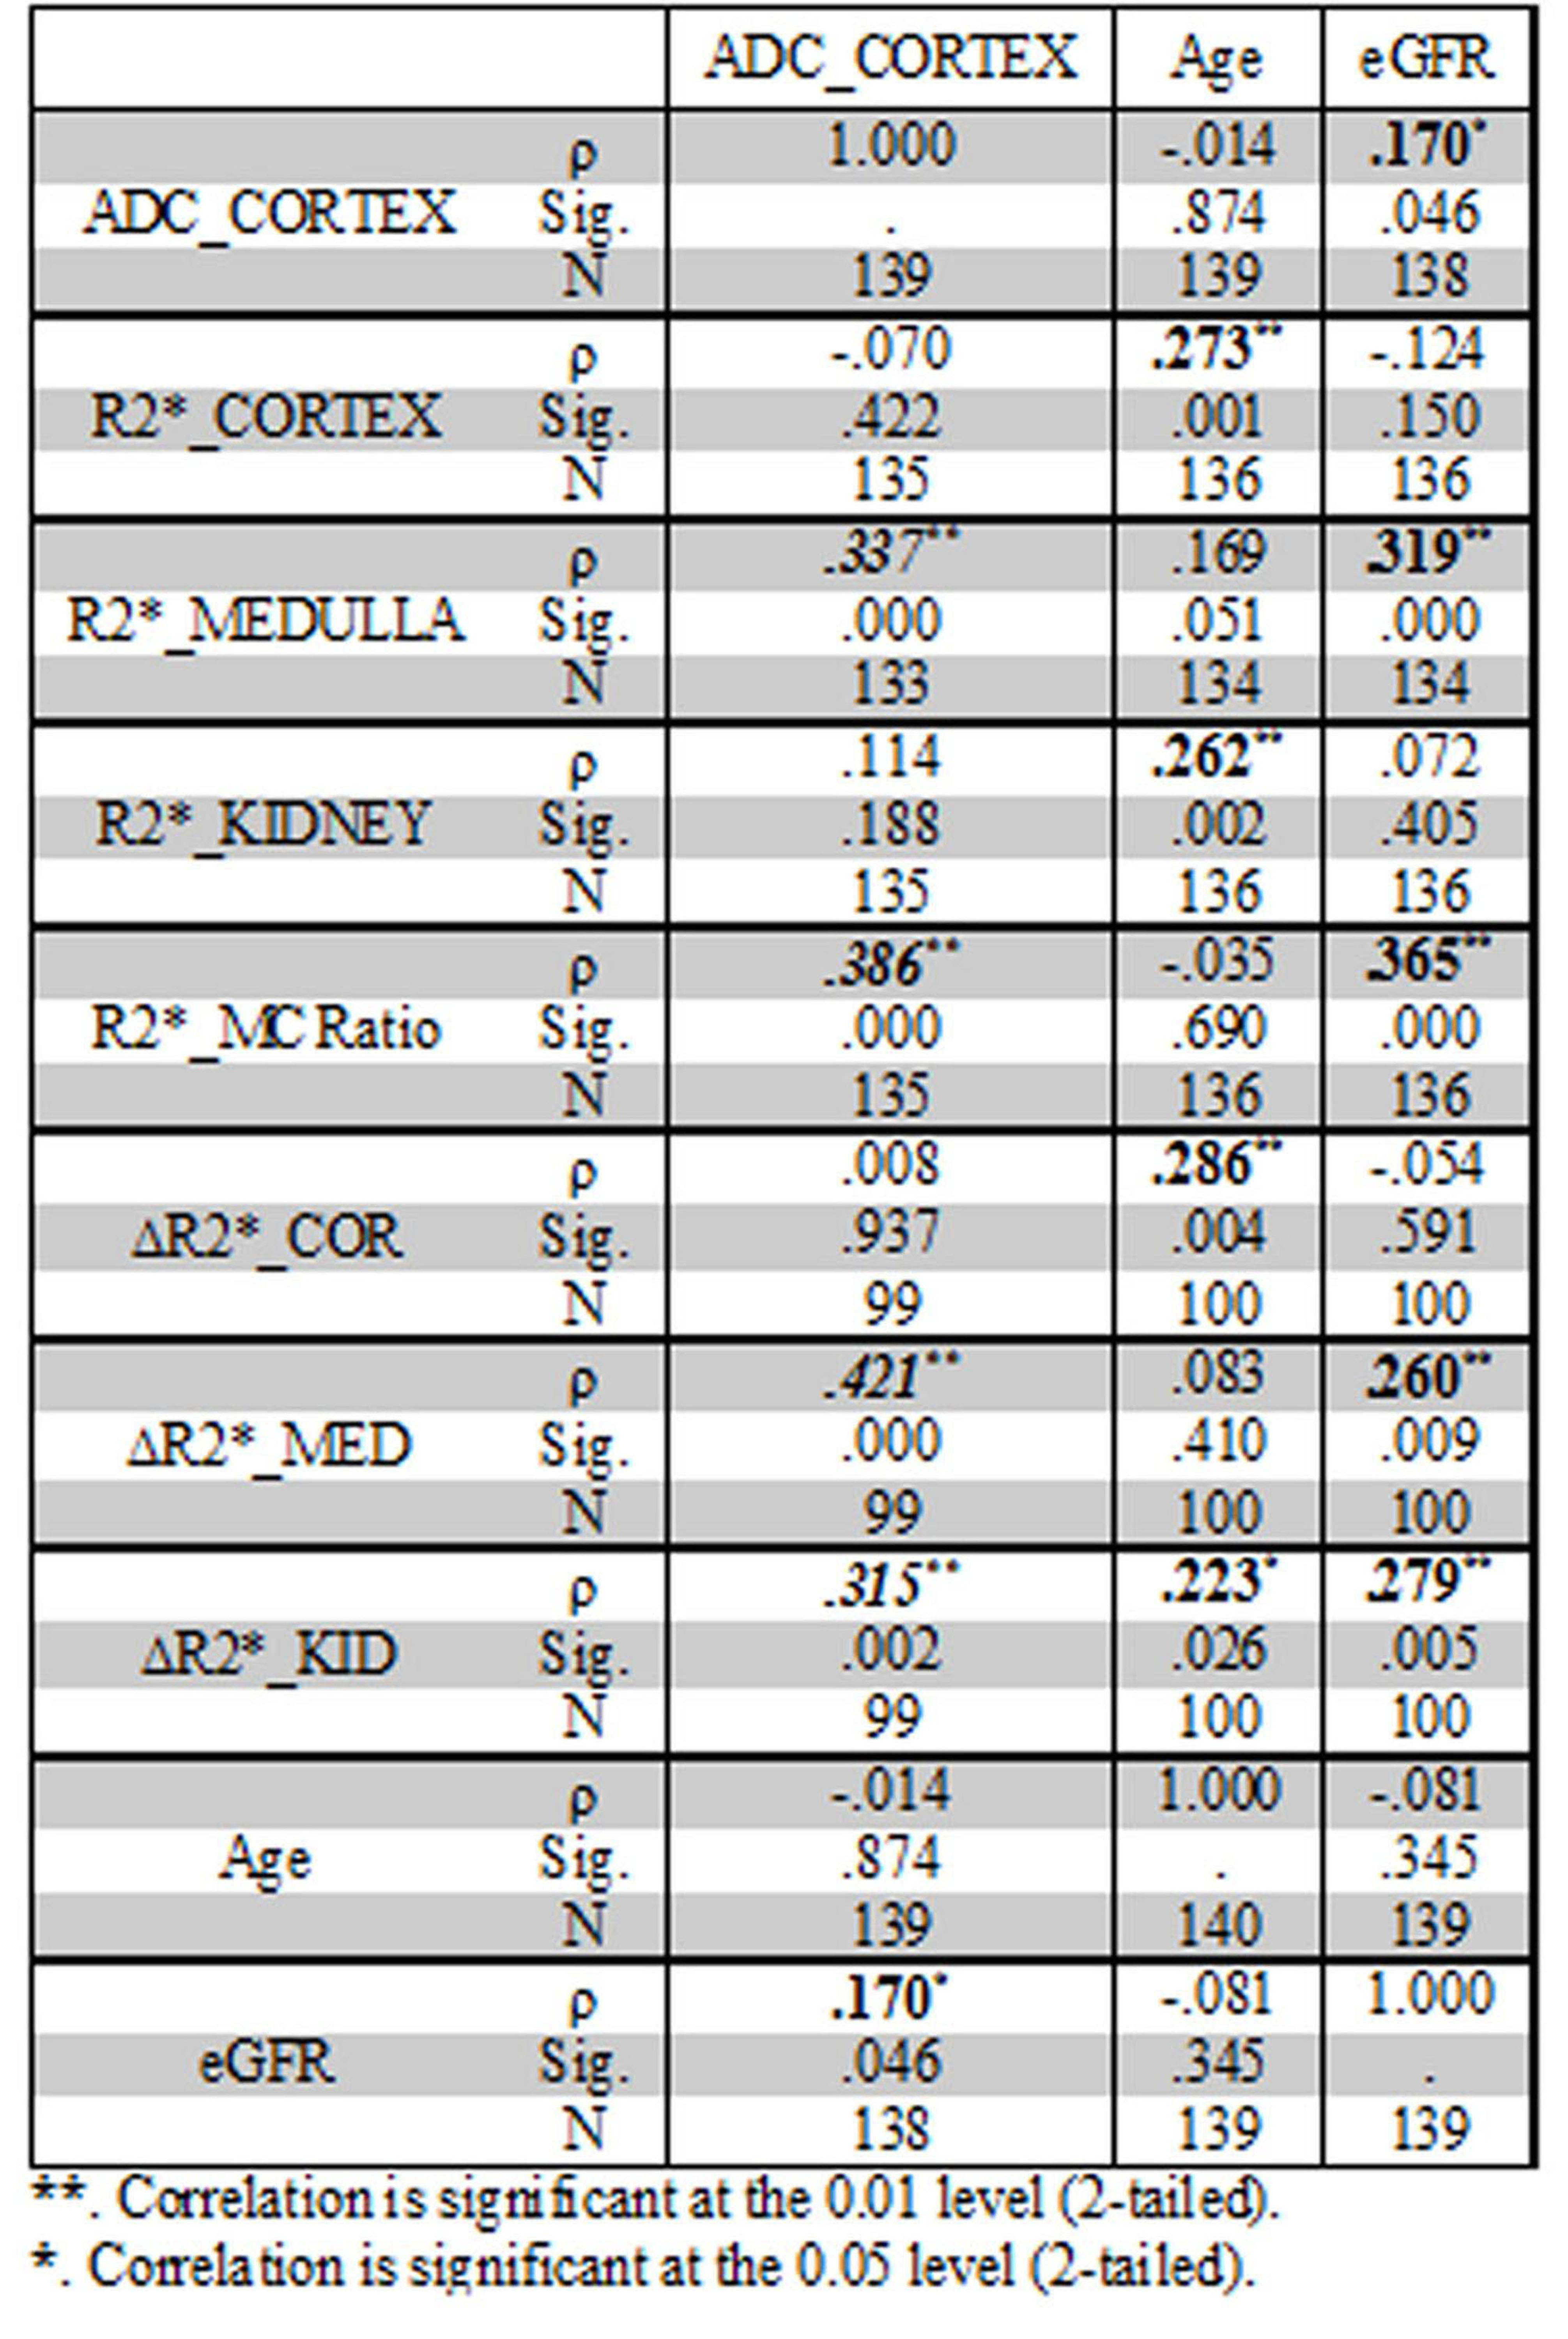
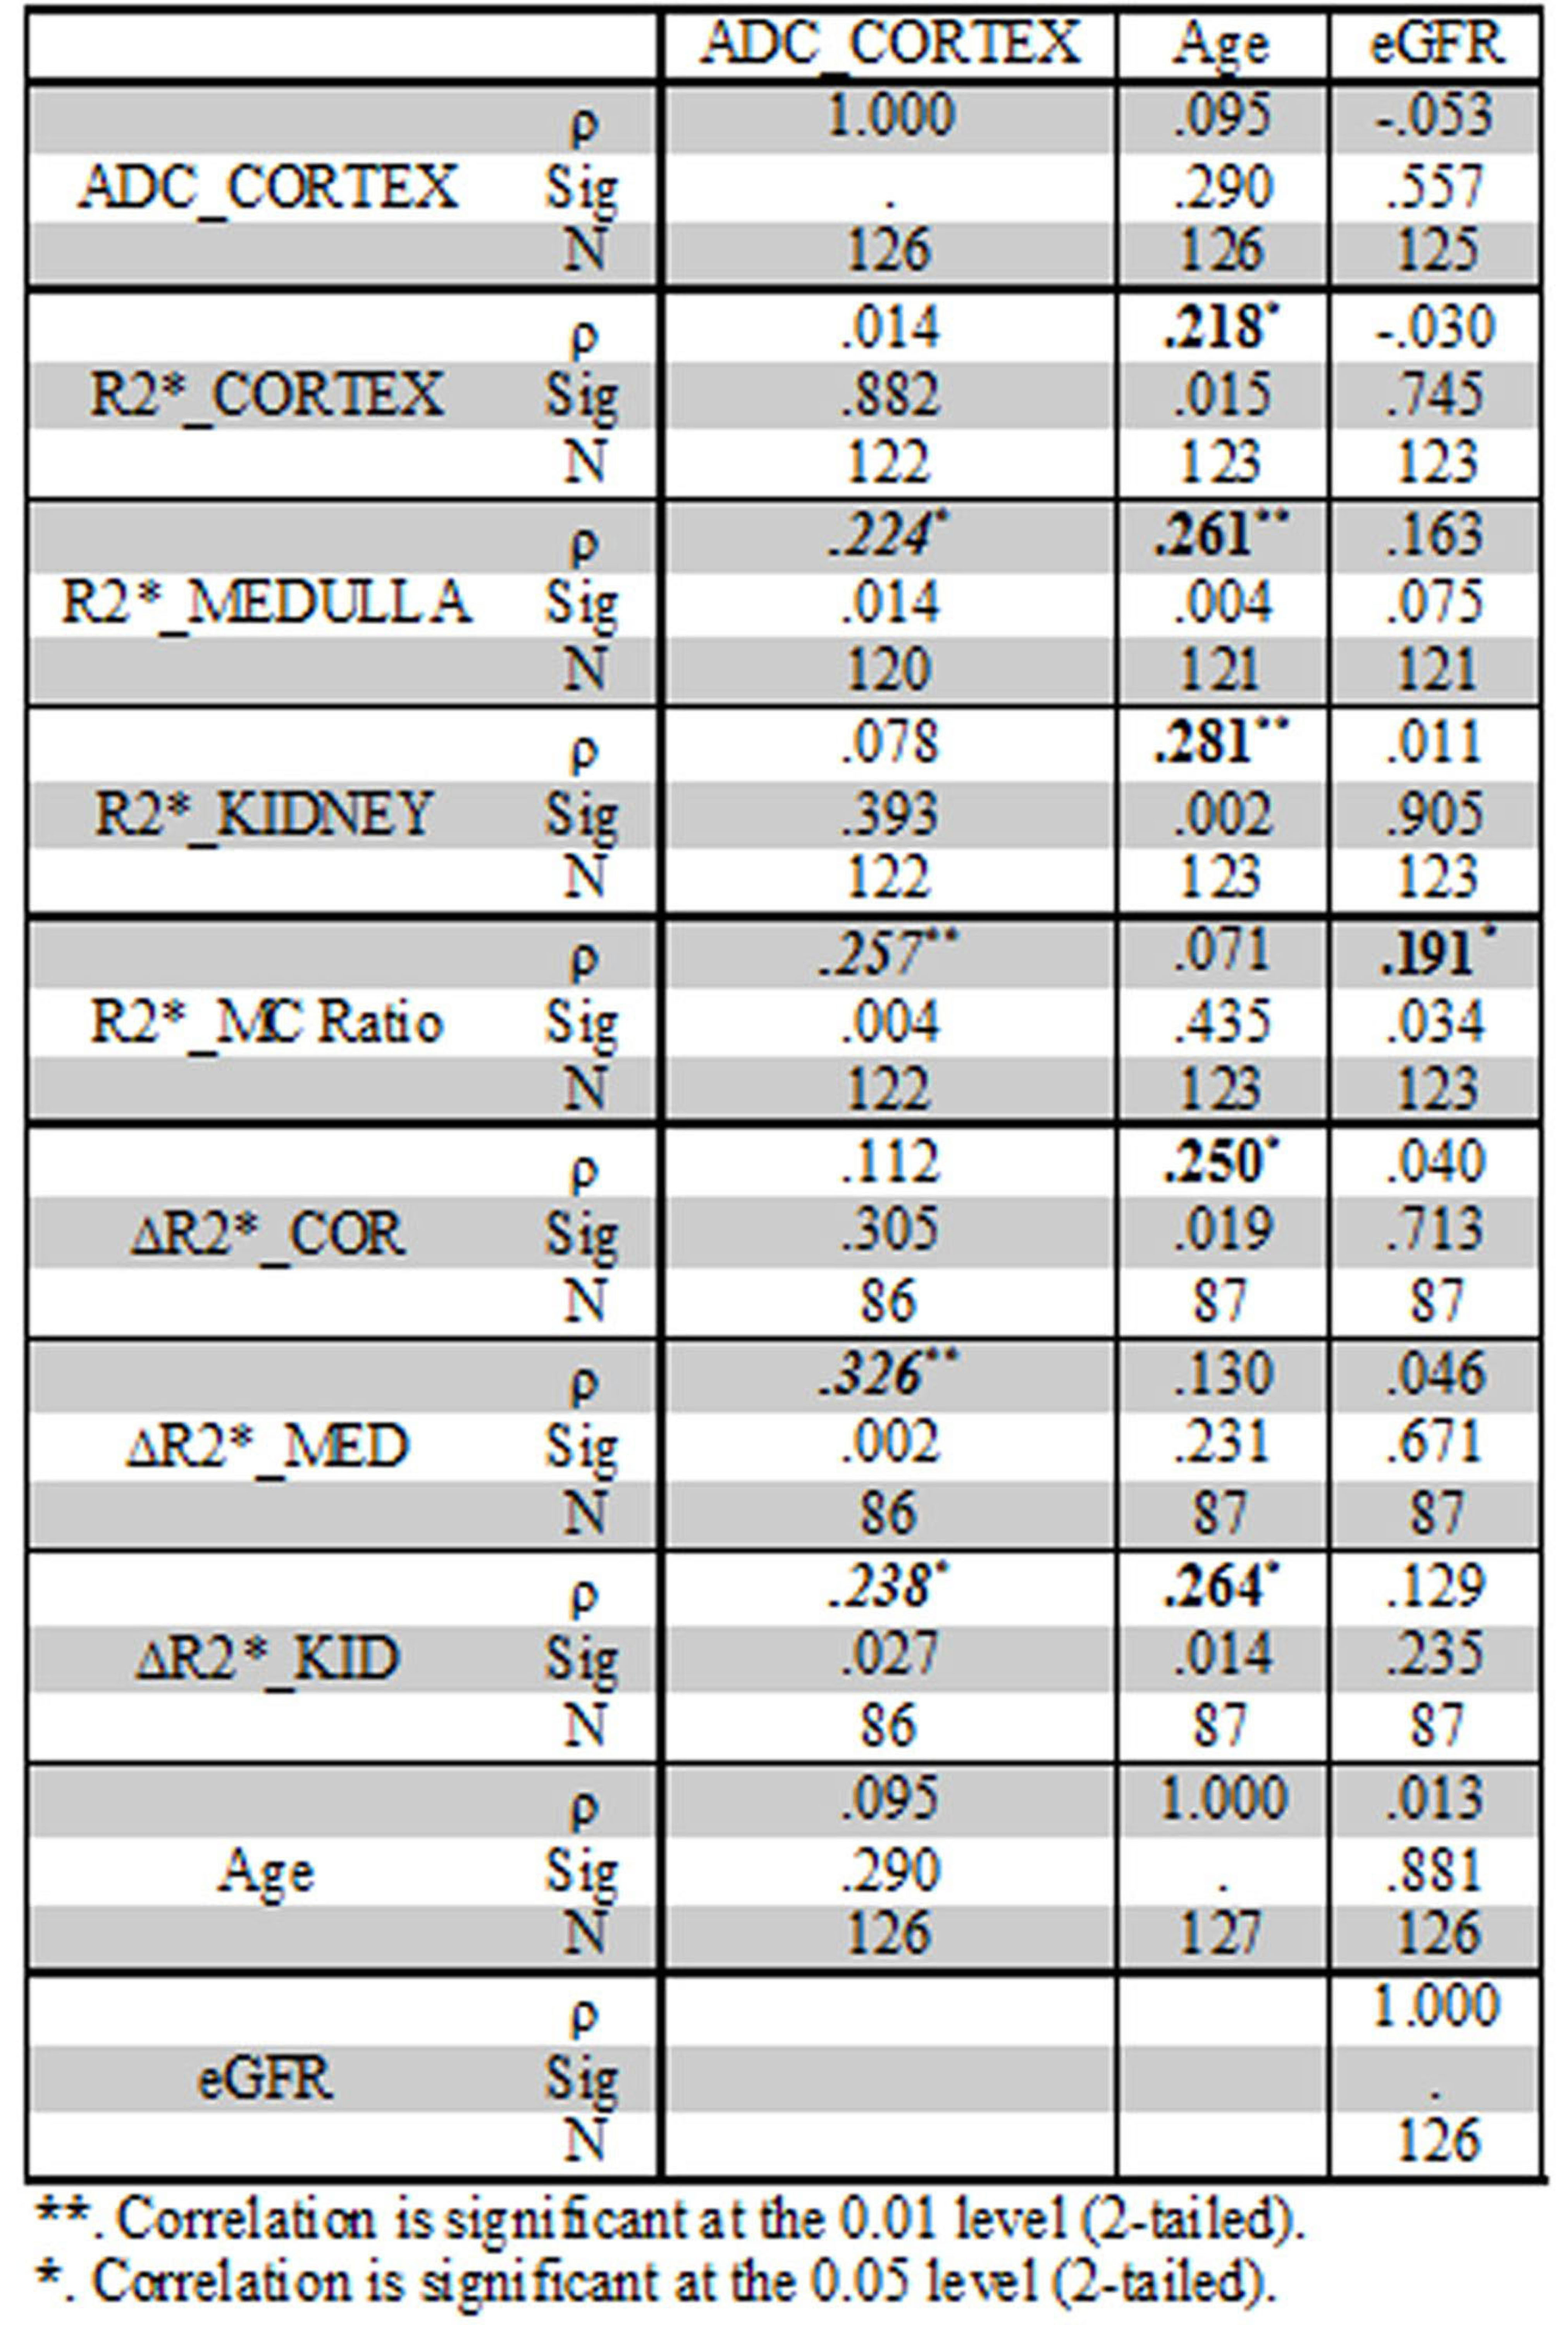
Table 1 summarizes the differences between CKD and control groups. Table 2 summarizes the Spearman correlations between MRI parameters vs. age and eGFR including all subjects with CKD and controls. Also included are correlations between ADC and the various BOLD MRI measures. Table 3 similarly summarizes Spearman correlations within only the CKD cohort.DISCUSSION AND CONCLUSION
We present the results from the largest study to date including BOLD and Diffusion MRI data in a multi-racial CKD population across multiple clinical sites.
Higher R2* values in the cortex and lower R2* in the medulla in the CKD group are consistent with recent data that estimated depth-wise variation in R2* in human kidneys.[10] While the exact cause for lower R2* in the medulla (suggesting improved oxygenation) is not yet clear, it is thought to be related to reduced oxygen consumption due to reduction in sodium reabsorption (in proportion to the reduced GFR). This observation is also consistent with the reduced response to furosemide. The reduced response to furosemide was previously reported in CKD [5,8]. The higher R2*_Cortex is consistent with the chronic hypoxia hypothesis [1]. However, the magnitude of change appears to be small. Concomitant reductions in blood volume and hematocrit may have reduced R2* in contrast to increasing R2* due to lower blood oxygenation.
This is the first study to report reduced ADC values in patients with advanced CKD, without the confounding effects of microcirculation as in prior reports [3,7,11]. These prior reports used b value of zero for the diffusion MRI which makes the measurement sensitive to micro-circulation. Our diffusion MRI acquisition used b values ranging 200 – 1000 s/mm2 and hence the ADC values would be more specific to the tissue compartment and hence more specific to the presence of fibrosis [12].
Our data supports the feasibility of using BOLD and Diffusion MRI in multi-site studies necessary for use in clinical trials.
Acknowledgements
Work supported in part by grant from the National Institutes of Health, R01-DK093793 (PVP) and R01DK102438 (TI). The COMBINE study is supported by grants U01DK099877, U01DK097093, U01DK099930, U01DK099933, and U01DK099924.References
1. Fine LG, Orphanides C, Norman JT (1998) Progressive renal disease: the chronic hypoxia hypothesis. Kidney Int Suppl 65: S74-78.
2. Prasad PV (2006) Evaluation of intra-renal oxygenation by BOLD MRI. Nephron clinical practice 103: c58-c65.
3. Zhao J, Wang ZJ, Liu M, Zhu J, Zhang X, Zhang T, et al. (2014) Assessment of renal fibrosis in chronic kidney disease using diffusion-weighted MRI. Clin Radiol 69: 1117-1122.
4. Khatir DS, Pedersen M, Jespersen B, Buus NH (2015) Evaluation of Renal Blood Flow and Oxygenation in CKD Using Magnetic Resonance Imaging. Am J Kidney Dis 66: 402-411.
5. Pruijm M, Hofmann L, Piskunowicz M, Muller ME, Zweiacker C, Bassi I, et al. (2014) Determinants of renal tissue oxygenation as measured with BOLD-MRI in chronic kidney disease and hypertension in humans. PLoS One 9: e95895.
6. Yin WJ, Liu F, Li XM, Yang L, Zhao S, Huang ZX, et al. (2012) Noninvasive evaluation of renal oxygenation in diabetic nephropathy by BOLD-MRI. Eur J Radiol 81: 1426-1431.
7. Inoue T, Kozawa E, Okada H, Inukai K, Watanabe S, Kikuta T, et al. (2011) Noninvasive evaluation of kidney hypoxia and fibrosis using magnetic resonance imaging. J Am Soc Nephrol 22: 1429-1434.
8. Prasad PV, Thacker J, Li LP, Haque M, Li W, Koenigs H, et al. (2015) Multi-Parametric Evaluation of Chronic Kidney Disease by MRI: A Preliminary Cross-Sectional Study. PLoS One 10: e0139661.
9. Thacker JM, Li LP, Li W, Zhou Y, Sprague SM, Prasad PV (2015) Renal Blood Oxygenation Level-Dependent Magnetic Resonance Imaging: A Sensitive and Objective Analysis. Invest Radiol 50: 821-827.
10. Milani B, Ansaloni A, Sousa-Guimaraes S, Vakilzadeh N, Piskunowicz M, Vogt B, et al. (2016) Reduction of cortical oxygenation in chronic kidney disease: evidence obtained with a new analysis method of blood oxygenation level-dependent magnetic resonance imaging. Nephrol Dial Transplant.
11. Xu X, Fang W, Ling H, Chai W, Chen K (2010) Diffusion-weighted MR imaging of kidneys in patients with chronic kidney disease: initial study. Eur Radiol 20: 978-983.
12. Togao O, Doi S, Kuro-o M, Masaki T, Yorioka N, Takahashi M (2010) Assessment of renal fibrosis with diffusion-weighted MR imaging: study with murine model of unilateral ureteral obstruction. Radiology 255: 772-780.
Figures