4577
Spatial Vascular Heterogeneity in the Normal Placenta Assessed with Multi-compartment Placental MRI1University College London, London, United Kingdom, 2University College Hospital, London, United Kingdom
Synopsis
The placenta is perfused by the fetus and mother, allowing oxygen and nutrients to be transferred to the developing fetus. Histologically there is large variation in vascularity within normal placentae but this has not been studied in vivo. The DECIDE model was fitted to separate signals from fetal and maternal perfusion. We imaged placental perfusion using the multi-compartment MR DECIDE model over the placental volume to investigate signal heterogeneity in four uncomplicated singleton pregnancies. The spatial composition of the placenta is investigated by inspecting the parametric heterogeneity across the organ.
Introduction
Optimal fetal growth depends on normal exchange of oxygen and nutrients across the placenta. Placental perfusion is poorly understood but clinically important as one third of stillbirths are due to placental failure1. Fetal blood in the two umbilical arteries is distributed across the placental surface via chorionic arteries before passing into the placental volume through networks of villous capillaries. Maternal uterine artery blood is transported to the placenta via the decidual spiral arteries, entering into the intervillous space where it bathes the fetal villous capillaries with low velocity flow to facilitate oxygen exchange. The placenta has geometrically distinct vascular architecture (Figure 1), and histologically vascular density changes with depth, and across the chorionic plate2,3. This has not been investigated in vivo.
T2 relaxometry (T2R) and Intravoxel incoherent modelling (IVIM) have been shown to be markers of placental function4,5,6,7. Many studies have averaged values from full thickness slices, or manually selected areas of interest defined from the MRI signal8, or from spatial location9. This approach may lose important structural information. Here we use a combined T2R and IVIM signal and a multimodal model (DECIDE)(Figure 1) that separates signals from fetal and maternal perfusion10. To investigate heterogeneity of normal fetal and maternal placental perfusion we analyse how maps from multi-parametric MRI vary by depth and slice location.
Methods
Four women in mid-pregnancy (28+4 to 34+0 weeks of gestation) consented for fetal MRI. Obstetric ultrasound confirmed normal fetal size, and normal fetal and maternal Doppler measurements. Imaging was performed on 1.5T Siemens Symphony, taking 41 measurements grouped across 7 b-values (0, 50, 100, 150, 200, 400, 600)s.mm-2 and 10 echo times (81, 90, 96, 120, 150, 180, 210, 270, 300ms). Images at 96ms echo time constituted an IVIM-like acquisition and were acquired three times for diffusion in the slice, phase and read directions. The imaging plane was selected to cover the depth of placenta, from chorionic to basal plate, and the whole placental volume was imaged. A non-rigid registration routine was used to align images, and we carried out manual segmentation of the whole placenta. Distance maps were created between the manually defined basal plate and the chorionic surface. We adapted the DECIDE model10 to take into account typical T2 values from recent literature11 and assign a fetal T2 of 190ms and a maternal T2 of 230ms based upon estimated oxygen saturations11,12. The DECIDE model was fitted, giving the IVIM-like vascular density (f*) and the maternal inter-villous perfusion density (v). To investigate the change in signal with distance from basal plate, f* and v were plotted against depth for the whole placenta. To investigate signal variation through placental volume the mean f* and v were plotted against depth for each slice.Results
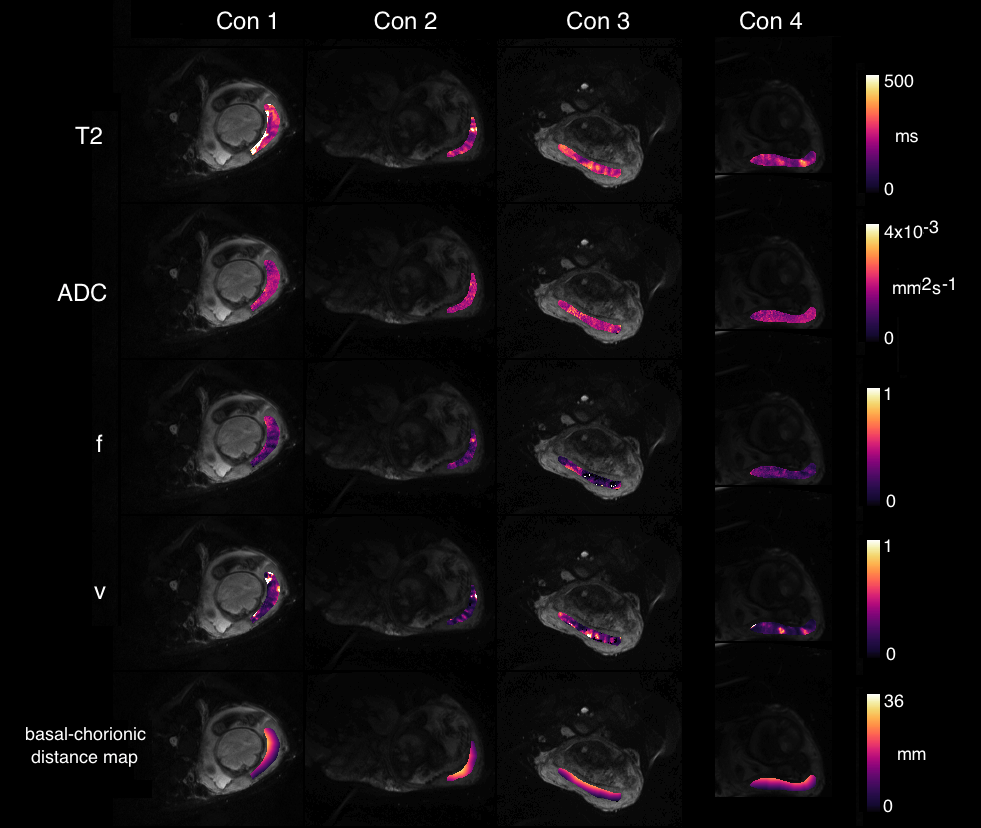
Parameter maps for an example slice for each case are shown in Figure 2. The heterogeneity of signal across one slice is apparent. Over the whole dataset the mean T2 was found to be 143±7ms, the ADC 0.0018±0.0002mm2s-1, the f*=0.14±0.11 and v=0.24±0.16.
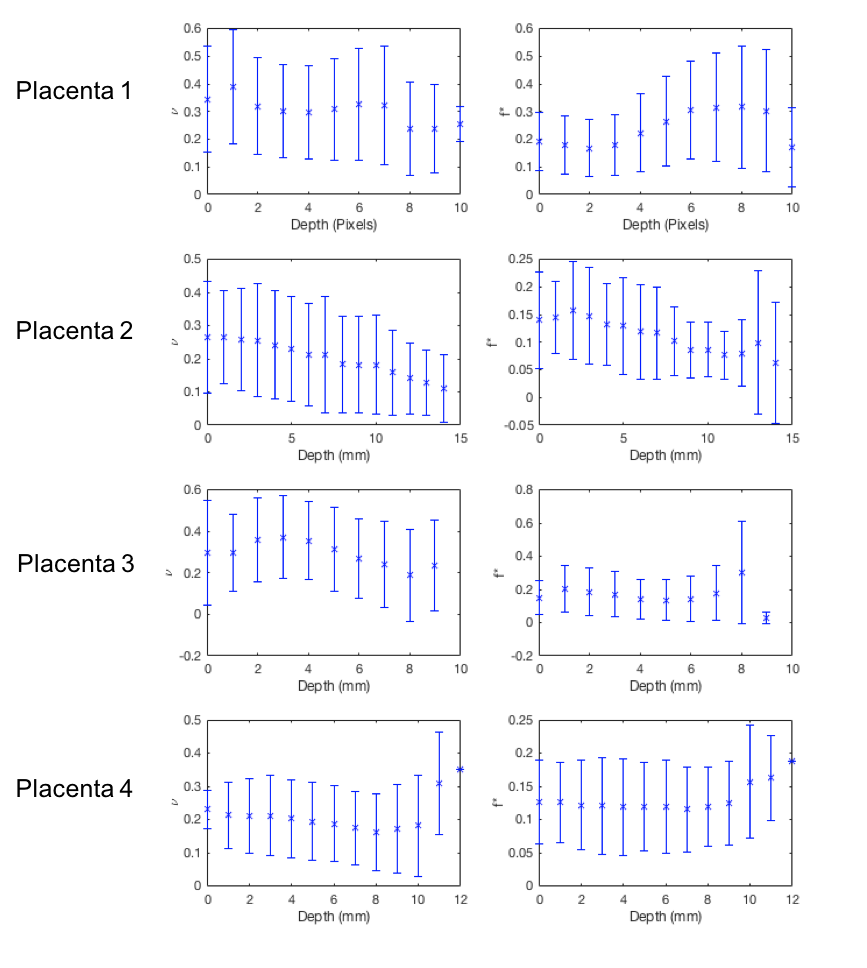
Figure 3 shows the mean f* and v plotted against depth from chorionic to basal plate for the whole placental volume. v tends to decrease with depth from the basal to chorionic plate, whilst f* tends to remain stable or increase with depth. The high v values close to the chorionic plate in case 4 likely represent the incorporation of large chorionic vessels or agitated amniotic fluid. The large error bars show the substantial spread of data.
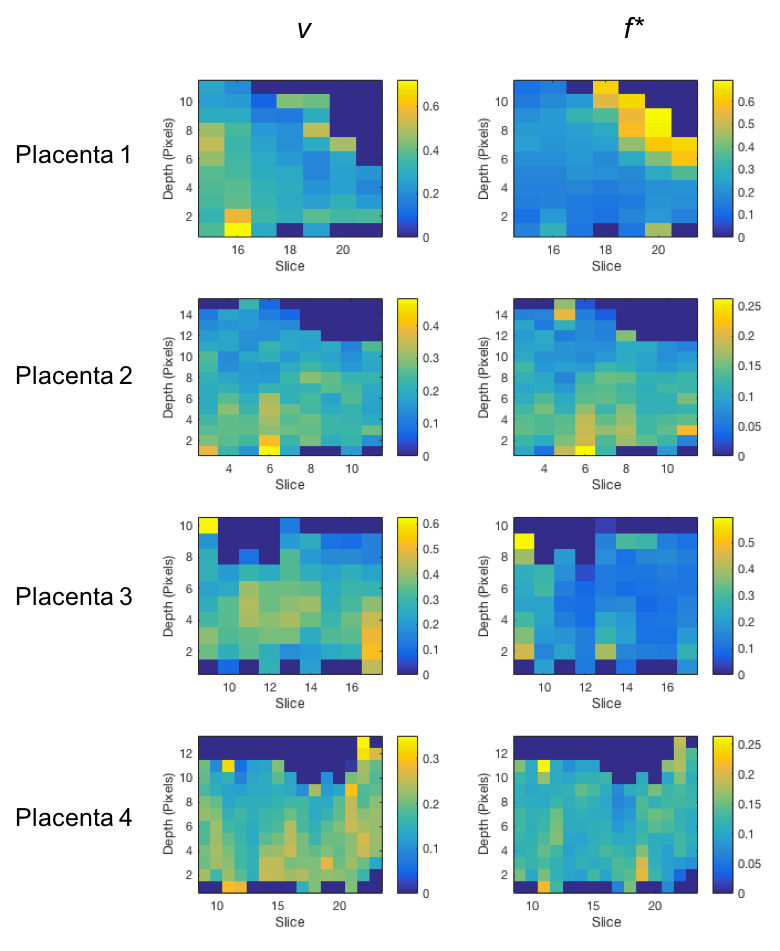
Figure 4 shows mean v and f* plotted against depth from chorionic to basal plate slice by slice. The large degree of heterogeneity within and between slices is apparent (0.2-0.5 for both v and f*). This variation between slices is indicative of spatial parameter heterogeneity in the plane of the chorionic surface.
Conclusion
This data demonstrates that v and f* values change in relation to placental depth and there is a large degree of heterogeneity in values within and between slices. This is in keeping with the large variation in vascularity observed histologically in normal placentae. Using a small area of interest is unlikely to capture this data spread, or to provide data that represents the whole placenta. Multi-compartment DECIDE model imaging of the whole placenta should allow a better understanding of the heterogeneity of perfusion and therefore the function of the whole placenta.Acknowledgements
This work was supported through an Innovative Engineering for Health award by the Wellcome Trust [ WT101957 ]; Engineering and Physical Sciences Research Council (EPSRC) [ NS/A000027/1 ], and the Wellcome/EPSRC Centre EPSRC [ NS/A000050/1 ] Wellcome [ 203145Z/16/Z ].References
1. Lawn, J. E. et al. Stillbirths: Where? When? Why? How to make the data count? Lancet (London, England) 377, 1448–63 (2011).
2. Fox, H. & Sebire, N. J. Pathology of the Placenta. (Saunders Elsevier, 2007).
3. Fox, H. THE PATTERN OF VILLOUS VARIABILITY IN THE NORMAL PLACENTA. BJOG An Int. J. Obstet. Gynaecol. 71, 749–758 (1964).
4. Moore, R. J. et al. In vivo intravoxel incoherent motion measurements in the human placenta using echo-planar imaging at 0.5 T. Magn. Reson. Med. 43, 295–302 (2000).
5. Gowland, P. A. et al. In vivo relaxation time measurements in the human placenta using echo planar imaging at 0.5 T. Magn. Reson. Imaging 16, 241–7 (1998).
6. Derwig, I. et al. Association of placental perfusion, as assessed by magnetic resonance imaging and uterine artery Doppler ultrasound, and its relationship to pregnancy outcome. Placenta 34, 885–91 (2013).
7. Derwig, I. et al. Association of placental T2 relaxation times and uterine artery Doppler ultrasound measures of placental blood flow. Placenta 34, 474–9 (2013).
8. Moore, R. J. et al. In utero perfusing fraction maps in normal and growth restricted pregnancy measured using IVIM echo-planar MRI. Placenta 21, 726–32 (2000).
9. Capuani, S. et al. Diffusion and perfusion quantified by Magnetic Resonance Imaging are markers of human placenta development in normal pregnancy. Placenta 58, 33–39 (2017).
10. Melbourne, A. et al. DECIDE: Diffusion-rElaxation Combined Imaging for Detailed Placental Evaluation. ISMRM 25th Annu. Meet. Exhib. (2017).
Figures