4576
Metabolic imaging of rodent placenta using hyperpolarized 13C pyruvate MRI1University of California, San Francisco, San Francisco, CA, United States
Synopsis
We have demonstrated the initial feasibility of hyperpolarized carbon-13 MRI assessment of placental metabolism in a pregnant rat model using [1-13C]pyruvate. This opens avenues for multiple applications investigating metabolic changes of placental dysfunction detrimental to maternal and fetal health.
Introduction
The placenta is a critical organ interfacing between maternal and fetal circulations, allowing for gas and nutrient exchange. Placental dysfunction has been associated with maternal and fetal disease such as preeclampsia and intrauterine growth restriction. Developing non-invasive techniques to assess placental function and its alterations with disease processes is critical. Routine ultrasound and MR imaging enable morphological and cardiovascular monitoring. While MR tools assessing oxygenation provide limited functional information, metabolic placental imaging has not been established. The placenta derives majority of its energy from glycolysis compared to oxidative phosphorylation, which is further accentuated in placental hypoxic conditions like pre-eclampsia, leading to a lactate excess in the placenta. A tool to non-invasively assess placental metabolism would help augment treatment strategies for early detection, appropriate intervention and treatment monitoring of such disorders. Hyperpolarized 13C MRI is one such tool that facilitates the real-time monitoring of enzyme kinetics of endogenous substrates. We present here the initial report of placental metabolism in a rodent model using hyperpolarized [1-13C]pyruvate MRI.Methods
Rats (n=10) at 17-20 days of gestation (220-280g) with an average of 9 pups, were imaged in a GE 3T MR750 system with a custom-built dual resonant 1H/13C rat body coil1. After an initial T2-weighted proton image to assess the number of fetal-placental units (FPU), the rats were infused with 80mM [1-13C] pyruvate polarized using Hypersense (Oxford Instruments). Dynamic 2D EPI images were acquired every 4s for a total of 80s. A single-band spectral-spatial RF pulse was used to alternately image pyruvate and lactate with a RF flip angle of 10° and 30° respectively with a 6 mm in plane resolution of a 15mm thick slice encompassing the FPUs. 4 of the 10 rats received a second injection of HP [1-13C]pyruvate and a 2D EPSI 13C image was acquired with similar resolution, using an RF compensated variable flip angle schedule2. For 2D EPI data, home built Matlab routines were used to process the area under the curve (AUC) lactate to pyruvate (LPratio) over the entire dynamic time course as well as to compute the kPL (apparent rate of pyruvate to lactate transfer) as detailed before3. The 2D EPSI data were processed using SIVIC to integrate the lactate and pyruvate peak areas and generate the metabolite maps to compute the AUC LPratio. Multiple FPUs were identified for each animal for an ROI analysis. PRISM was used to assess statistical significance (p<0.05). Data are represented as mean±std.error.Results and Discussion
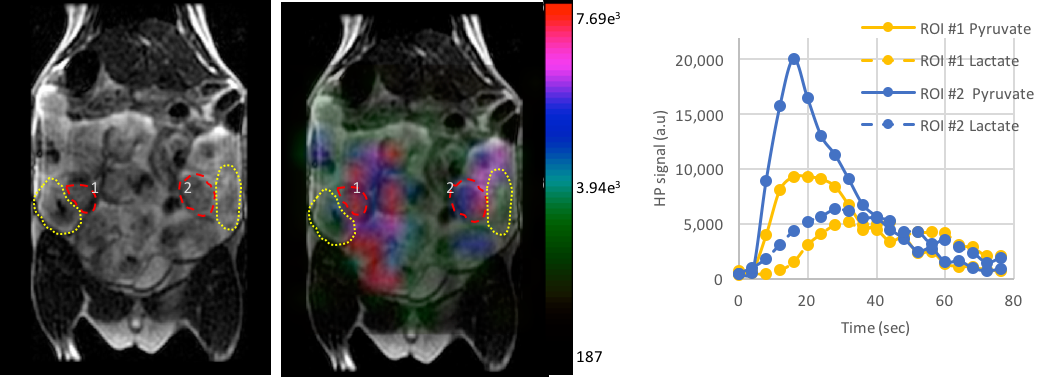
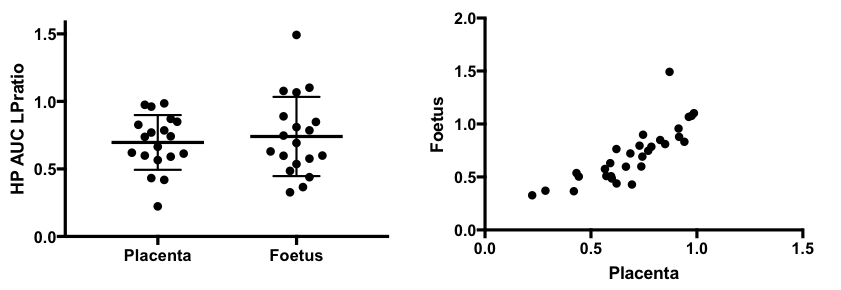
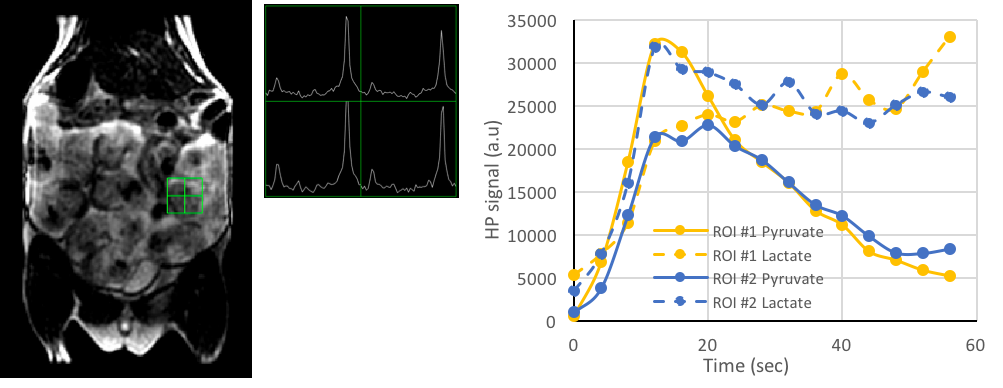
Dynamic 2D EPI imaging revealed good signal-to-noise ratio (SNR) of 240 at 60s after injection for lactate signal localized in the placenta, which are clearly delineated on the T2-weighted proton images (Fig.1). The pyruvate and lactate signals reached maximum intensity at 21±3s and 35±7s respectively in the placenta as shown in the dynamic curves (Fig.1). The peak lactate in the rat placenta observed here is 10s later than that seen in an earlier study in guinea pigs4, which can be attributed to the coarser temporal resolution in that study. Modeling of the dynamic curves to compute the kPL, yielded a flux rate of 0.025±0.0048, similar to the rodent kidney3. The AUC LPratio in the placenta is 0.712±0.037 (Fig.2). The AUC LPratio and kPL had a correlation of r=0.596 (p=0.007), reinforcing the observations of prior studies5 that the AUC is a surrogate marker of kPL. Meanwhile, although the fetal tissue had half the SNR (180 at 60s) of that of the placenta, they had similar AUC LPratio (Fig.2). The mean AUC LPratio of the corresponding fetus was 0.708±0.048 and was significantly correlated to the placental value with an r=0.818 (p<0.0001). The robust fetal metabolism measured here was not observed in a prior work in the chinchilla model6. Additionally, the 2D EPSI imaging revealed robust signal dynamics (Fig.3) with an SNR of 484 for the lactate signal at 40s post infusion, which is approximately 1 T1 of pyruvate at 3T3. Like in the EPI data, the placenta and fetus has similar AUC LPratios of 1.96±0.15 and 1.98±0.15 respectively, as well as a strong correlation (r=0.843, p<0.0001).Conclusion
We have demonstrated feasibility of hyperpolarized MRI for a unique non-oncologic application of placental metabolism in a pregnant rat model. Similar to prior oncology studies, the AUC LPratio correlates with kPL, thereby providing for a model free approach for metabolic measurements. Noticeably, the placental and fetal metabolism are significantly correlated, which can be imperative to assess etiologies of growth restriction intrinsic to the fetus, where there may placental-fetal metabolic dissociation. Currently studies are underway to examine the change in placental metabolism in animal models of preeclampsia.Acknowledgements
We would like to acknowledge the Surbeck Lab, Kurhanewicz and Vigneron lab members.References
1. Morze, von, C. et al. Detection of localized changes in the metabolism of hyperpolarized gluconeogenic precursors 13C‐lactate and 13C‐pyruvate in kidney and liver. Magn Reson Med (2016). doi:10.1002/mrm.26245
2. Zhao, L. et al. Gradient-Echo Imaging Considerations for Hyperpolarized 129Xe MR. J Magn Reson B 113, 179–183 (1996).
3. Bahrami, N., Swisher, C. L., Morze, von, C., Vigneron, D. B. & Larson, P. E. Z. Kinetic and perfusion modeling of hyperpolarized (13)C pyruvate and urea in cancer with arbitrary RF flip angles. Quant Imaging Med Surg 4, 24–32 (2014).
4. Friesen Waldner, L. J. et al. Hyperpolarized [1‐13C]pyruvate MRI for noninvasive examination of placental metabolism and nutrient transport: A feasibility study in pregnant guinea pigs. J. Magn. Reson. Imaging 43, 750–755 (2016).
5. Hill, D. K. et al. Model free approach to kinetic analysis of real-time hyperpolarized 13C magnetic resonance spectroscopy data. PLoS ONE 8, e71996 (2013).
6. Mikkelsen, E. et al. The chinchilla as a novel animal model of pregnancy. Royal Society Open Science 4, 161098 (2017).
Figures