4574
ADC and perfusion fraction f obtained by IVIM model are markers of maternal and fetal human placenta development in normal pregnancy1Department of Radiological, Oncological and Pathological Sciences, Policlinico Umberto I Università Sapienza di Roma, Rome, Italy, 2Physics Dpt. Sapienza Roma, CNR ISC Roma Sapienza, Rome, Italy, 3SAIMLAL Department, Morphogenesis & Tissue Engineering, Sapienza University of Rome, Roma, Italy
Synopsis
The purpose was to investigate the potential of IVIM model to quantify diffusion and perfusion in human placenta of normal pregnancy. The relation between Apparent diffusion coefficient ADC, perfusion fraction f and pseudo-diffusion coefficient D* obtained in fetal and maternal placenta with microstructural changes occurring during placenta development was investigated. 30 pregnant women (gestational age, GA range = 19-37w) underwent DW examination with b=0,10,30,50,75,100,150,400,700,1000s/mm2. The Pearson correlations between ADC, D*, f and clinical data (GA, Body-Mass Index and basal Glycaemia) were evaluated. ADCvsGA showed significant positive and negative correlation during the II and III trimester of gestation, respectively.
Introduction
Placenta is a temporary organ that forms in the uterus during pregnancy. Its primary function is to allow metabolic and gaseous exchanges between fetal and maternal blood1 to nourish, protect and support fetal growth. To carry out this function, the placenta consists of a complex tissue microstructure, with a broad variety of differently structured villi, and perfusion functions. As the knowledge of markers indicative of normal placenta development is essential to detect abnormalities and understand their pathogenesis, aim of this study is to investigate the potential of IVIM model2 of diffusion-weighted (DW) signal decay to quantify diffusion and perfusion changes in normal human placenta due to its development. Toward this goal, we examined the placenta of pregnant women at 1.5T, measuring diffusion and perfusion parameters in different placental sites and assessing their associations with subjects’ clinical data such as Gestational Age (GA), Body Mass Index (BMI) and basal Glycaemia (bG).
Methodological Details
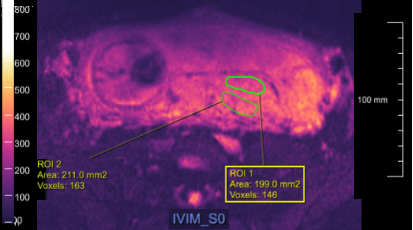
30 healthy pregnant women (GA range 19-37w), fulfilling the study inclusion criteria, underwent MRI examination at 1.5T (Siemens Avanto, Erlangen, Germany), without mother-foetal sedation. The study was approved by the local Ethics Committee, and written informed consent was obtained from all subjects before entering the study. The MRI protocol included a Diffusion weighted Spin Echo-Echo Planar Imaging with TR/TE=4000ms/79ms; bandwidth=1628Hz/px; matrix size=192x192, number of slices=30. The in-plane resolution was 2.0x2.0mm, slice thickness=4mm. Diffusion encoding gradients were applied along 3 no-coplanar directions using 9 different b-values (10,30,50,75,100,150,400,700,1000 s/mm2), plus the b=0 image. The number of averaged signal (NS) for each b value was NS=4. With the help of an expert radiologist six Regions of Interest (ROIs) depending on distance from lateral distance across uterine wall were identified in each placenta: maternal and fetal central ROI (C-ROI), maternal and fetal peripheral ROI (P-ROI) and maternal and fetal umbilical ROI (U-ROI) (see Fig. 1). The following function was used to fit data: S(b)/S(0)= f*exp(-b*D*) + (1-f)*exp(-b*ADC) where ADC, D* and f are the apparent diffusion coefficient, the pseudo-perfusion coefficient and the perfusion fraction, respectively2. The Siemens prototypes MR Body Diffusion Toolbox and N4_511E_VB17A_ADVDIFF were used to obtain ADC, f and D* maps. Pearson test with Bonferroni correction was performed to investigate correlation between ADC, D* ,f and GA, BMI and bG. ANOVA analysis with Bonferroni corrections was performed to identify differences between mean values.Results
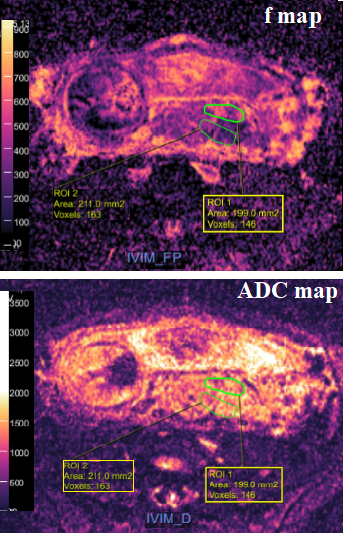
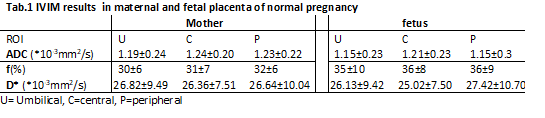
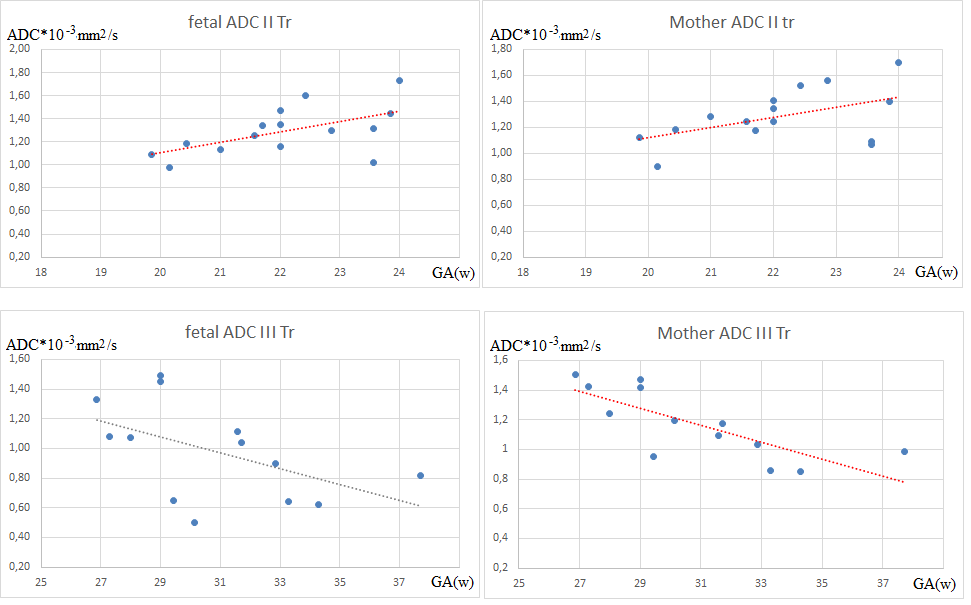
ADC and f maps of a subject’s cohort are displayed in Fig.2 and the mean values of ADC, D* ,f quantified in the six different ROIs are reported in Tab. 1. The perfusion fraction f of the three fetal ROIs are significantly higher than those quantified in maternal ROIs. No significant differences were found among the other parameters. A significant positive correlation was found between ADC and GA in the second trimester of gestation (GA between 19 and 24 w) in the peripheral fetal placenta (P_ROI), with r=0.60 and p<0.04 and in P_ROI of maternal placenta, with r=0.5 and p<0.03. Moreover, a significant negative correlation was found between ADC and GA in the third trimester of gestation (GA between 27 and 37 w) in the peripheral maternal placenta (r=-0.73, p<0.01) together with a negative trend in the peripheral fetal placenta (Fig. 3). Conversely, no significant correlations were found between ADC, D*,f and BMI, bG and between ADC, D*,f and GA in the umbilical and central placenta.Discussion and conclusion
The mean D, D* and f values are in general agreement with those found in literature3,4. However, in contrast with previous studies we found that f values are significantly greater in the fetal placenta regions than those obtained in the maternal placenta regions. This result is in agreement with the fact that the fetal placenta is richer in villi than the mother's placenta. Moreover, according to our previous results4, we found a significant decrease of ADC as the GA increases in the maternal peripheral ROI during the third trimester of gestation. The decrease of ADC with the GA increasing may highlight the parenchymal changes characterized by a more fibrotic environment during last gestational weeks5. An abnormal growth of fibrous parenchymal tissue increases the prevalence of barriers to diffusion and thus reduces ADC values6. On the other hand, our results highlight an increase of ADC with the GA increasing during the second trimester of gestation in P-ROI. This suggests the potential of IVIM model to provide information about placental micro-morphology changes during GA.Acknowledgements
We thank the developers of the Siemens software used for this work: Thorsten Feiweier and Robert GrimmReferences
[1] T.R. Regnault, H.L. Galan, T.A. Parker, R.V. Anthony (2002) Placental development in normal and compromised pregnancies: a review, Placenta 23 (Suppl. A) S119-S129.
[2] Le Bihan, D; Breton, E; Lallemand, D; Aubin, ML; Vignaud, J; Laval-Jeantet, M (1988). "Separation of diffusion and perfusion in intravoxel incoherent motion MR imaging". Radiology. 168 (2): 497–505
[3] R. Moore, B. Issa, P. Tokarczuk, K.R. Duncan, P. Boulby, P.N. Baker, R.W. Bowtell, B.S. Worthington, I.R. Johnson, P.A. Gowland. In vivo intravoxel incoherent motion measurements in the human placenta using echo-planar imaging at 0.5T. Mag. Reson. Med. 43 (2000) 295-302.
[4] Capuani, S., Guerreri, M., Antonelli, A., Bernardo, S., Porpora, M.G., Giancotti, A., Catalano, C., Manganaro, L., “Diffusion and perfusion quantified by Magnetic Resonance Imaging are markers of human placenta development in normal pregnancy”, Placenta, 58, 33-39 (2017).
[5] K. Benirschke, G.J. Burton, R.N. Baergen, Pathology of the Human Placenta, Springer-Verlang Berlin Heidelberg 2012.
[6] R.N. Baergen, Manual of Pathology of the Human Placenta, 2011 Springer.
Figures