4573
Quantitative ferumoxytol DCE MRI of the primate placenta perfusion domains1Medical Physics, University of Wisconsin - Madison, Madson, WI, United States, 2Radiology, University of Wisconsin - Madison, Madson, WI, United States, 3Biomedical Engineering, University of Wisconsin - Madison, Madson, WI, United States, 4Wisconsin National Primate Research Center, University of Wisconsin - Madison, Madson, WI, United States, 5Comparative Biosciences, University of Wisconsin - Madison, Madson, WI, United States, 6Obstetrics & Gynecology, University of Wisconsin - Madison, Madson, WI, United States, 7Medicine, University of Wisconsin - Madison, Madson, WI, United States, 8Emergency Medicine, University of Wisconsin - Madison, Madson, WI, United States
Synopsis
The placental vascular network is organized to effectively mediate exchange of nutrients, oxygen, and waste between mother and fetus. We report on the estimated number of placental functional domains in a healthy population of rhesus macaques using ferumoxytol DCE MRI. Noninvasive imaging of the maternal vasculature organization and localized perfusion within the placenta may be a sensitive biomarker to predict pregnancy complications.
Introduction
The placenta mediates the exchange of nutrients, oxygen, and waste between mother and fetus. The placental vascular network is organized into functional cotyledons1 optimized to facilitate this exchange, critical to fetal health and development. Several pregnancy complications involve vascular maladaptation which compromises the function of one or more cotyledons. A non-invasive means to assess placenta function in utero is needed. Recently, quantitative characterization of perfusion in the primate placental domains was achieved using dynamic contrast enhanced magnetic resonance imaging (DCE MRI) using a gadolinium (Gd) contrast agent.2 Ferumoxytol, an intravenously delivered iron supplement, is increasingly being used off-label as an alternative MRI contrast agent and has pharmacokinetics that make it attractive for vascular imaging. The objective of this work is to investigate whether DCE MRI with ferumoxytol can identify the placental perfusion domains in a population of healthy, nonhuman primates.Methods
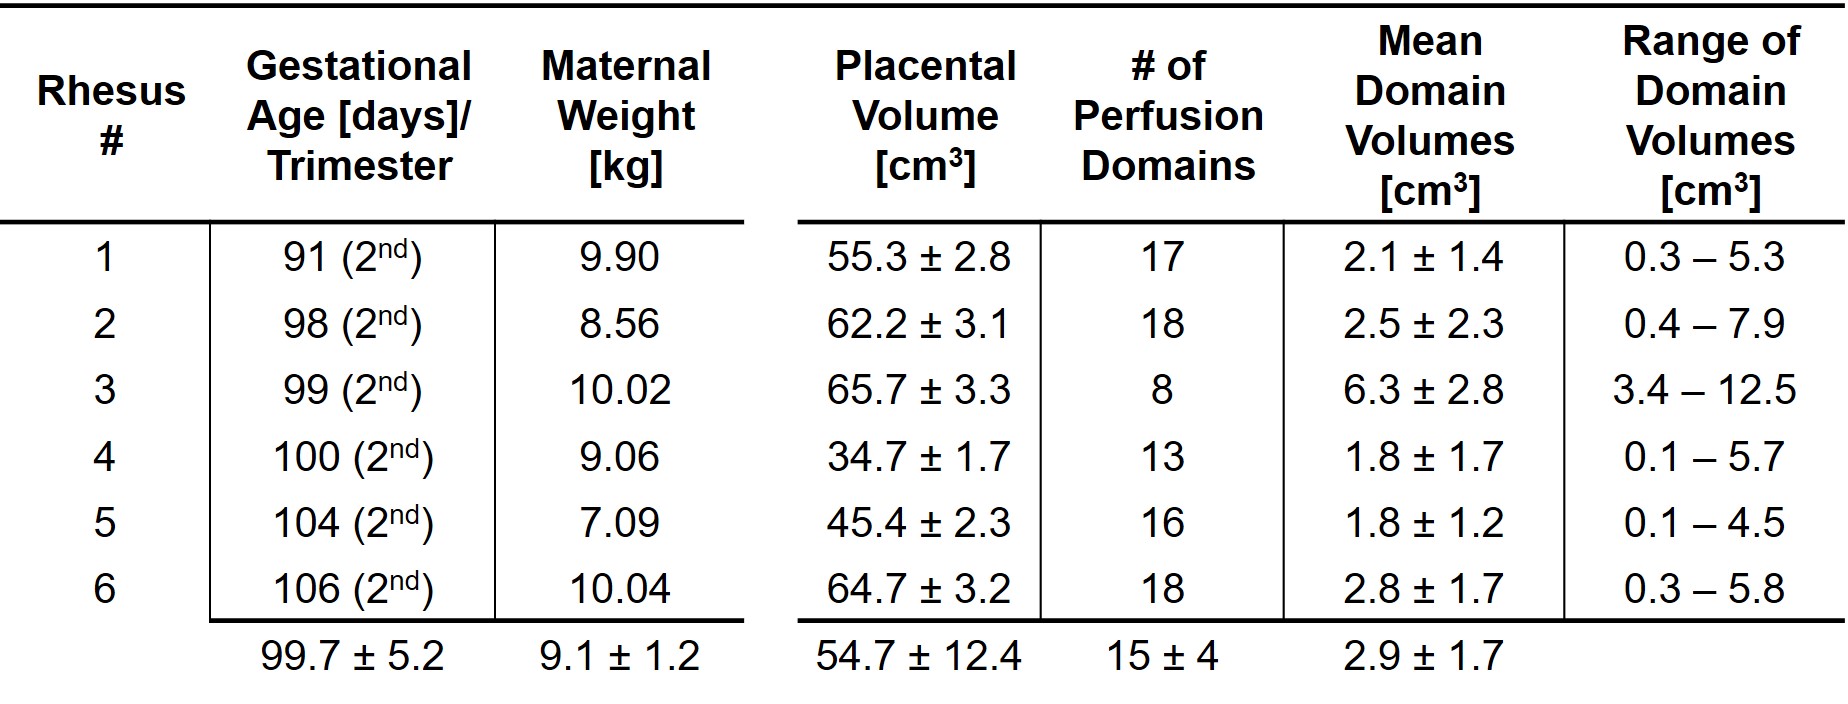
Animals: All procedures were approved by the institutional animal care and use committee. Six pregnant rhesus macaques were sedated with 1.5% isoflurane supplemented with O2. Table 1 summarizes the animal characteristics.
Imaging protocols: MRI was performed at 3.0T (Discovery MR750, GE Healthcare) with a 32-channel phased array coil. 4mg/kg bodyweight of ferumoxytol (AMAG Pharmaceuticals) was diluted 5:1 with saline and intravenously infused over 20 seconds. Dynamic 3D images were acquired with a respiratory-gated, T1-weighted spoiled gradient-echo with differential subsampling with Cartesian ordering (DISCO) product MRI sequence (TR=4.8ms, TE1/TE2=1.2/2.4ms, spatial resolution=0.86×0.86×1mm3, temporal resolution=5.0s, flip=12°).
Data analysis: Post-processing was performed in Matlab (Mathworks) unless noted. Semi-automatic placental tissue segmentation was performed in ITK-SNAP.3 DCE contrast-time data were fit to a sigmoid-shaped logistic function to determine contrast arrival times. A watershed algorithm segmented smoothed arrival time maps into functional domain maps.2
Results
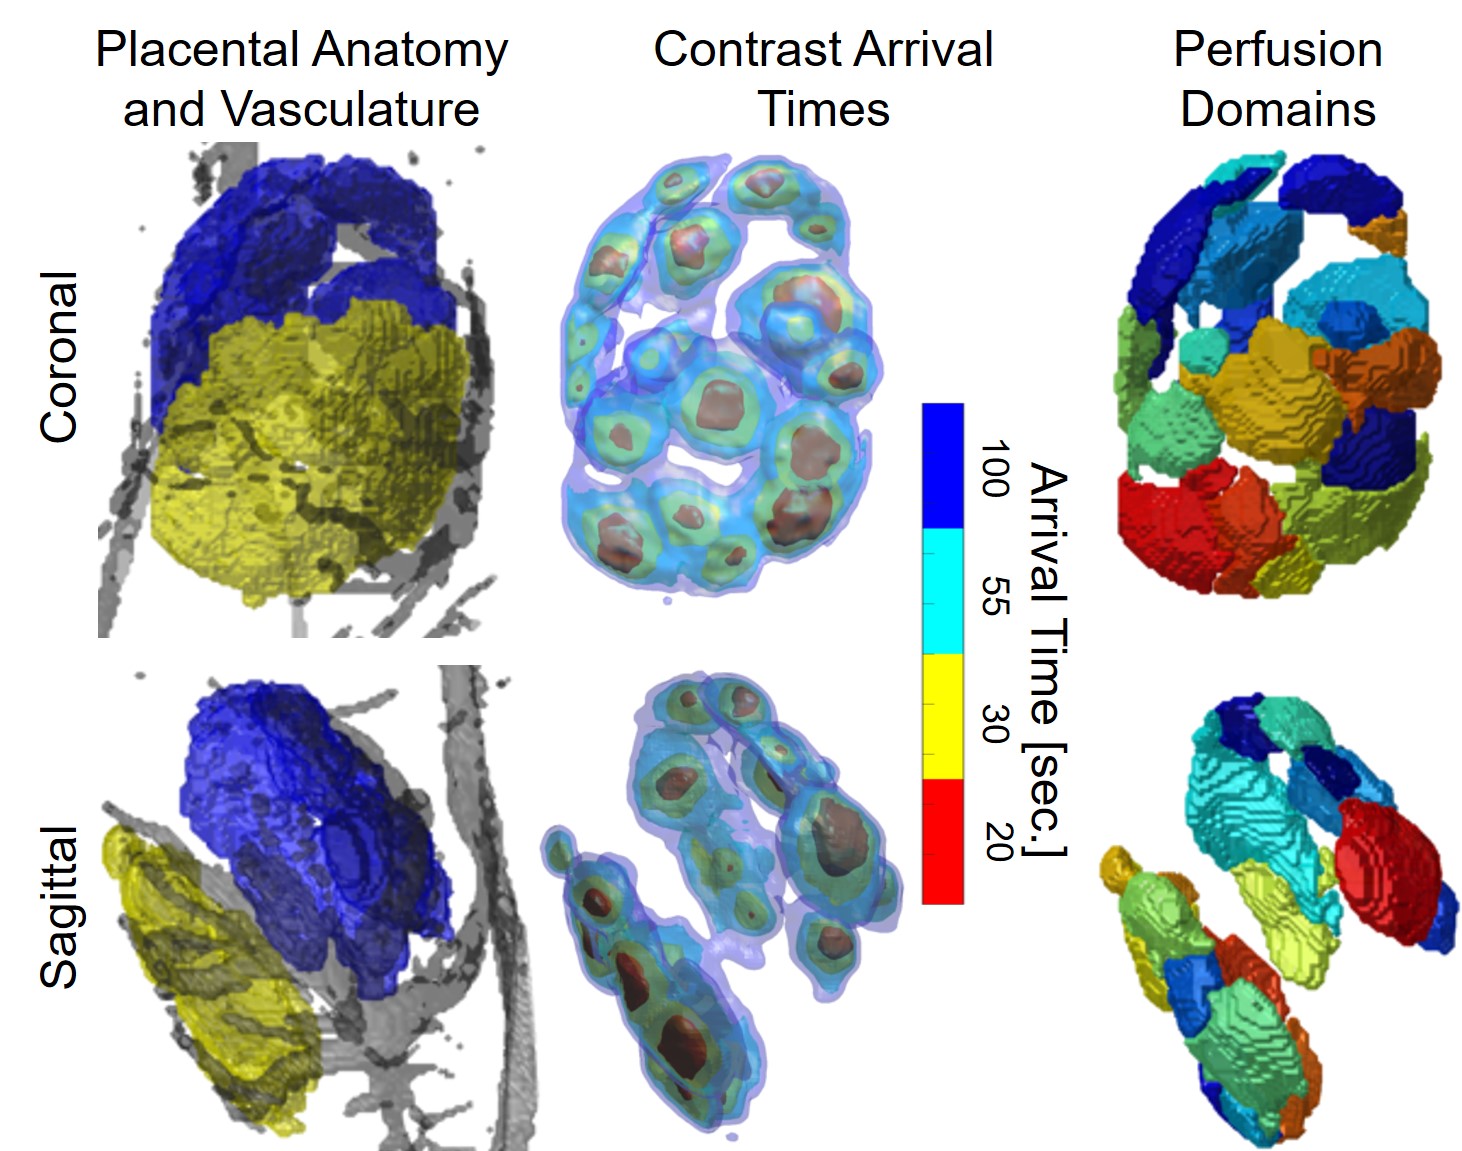
Coronal and sagittal maximum intensity projections (MIPs) of the DCE time series display localized regions of contrast in-flow occurring in separate functional domains of the rhesus placenta, as seen in figure 1. The bi-lobar organization and major vessels of the placenta are highlighted. Heterogeneous contrast arrival times are observed in the fitted arrival time maps in figure 2 which closely match spatial location of the automatically segmented functional domains. On average, a total of 15 functional domains were identified (range: 8-18) with volumes ranging from 0.1-12.5cm3. Measurements derived from DCE data are summarized in table 1 for all six macaques.Discussion
Analysis of ferumoxytol DCE MRI allows estimation of the number of perfusion domains in the rhesus macaque placenta. Our estimates were similar to the anticipated number of average domains reported in macaques3 and those observed by Gd-MRI.2 No ferumoxytol signal enhancement was observable within the fetus or amniotic fluid for all animals. Future studies will aim to determine blood flow to each functional domain.Acknowledgements
The authors thank our collaborators and colleagues. We gratefully acknowledge the NIH Human Placental Project (NICHD U01 HD087216), NIH grant number P51 OD011106 to the Wisconsin National Primate Research Center, NIH awards K24 DK102595, UL1TR000427, TL1TR000429 and T32CA009206, AAPM 2014 Graduate Fellowship UW School of Medicine and Public Health and UW Departments of Medical Physics, Radiology, and Obstetrics and Gynecology and GE Healthcare for research support.References
1 Denger K, Magness RR, and Shah DS. Establishment of the Human Uteroplacental Circulation: A Historical Perspective. Reprod. Sci. 2016:24(5):753-61
2 Frias AE, Schabel MC, Roberts VH, et al. Using dynamic contrast-enhanced MRI to quantitatively characterize maternal vascular organization in the primate placenta. Magn. Reson. Med. 2015;73(4):1570-8
3 Myers RE. The gross pathology of the Rhesus Monkey placenta. J. Reprod. Med. 1972;9(4):171-98
Figures