4571
Optimised b-values and Gradient Directions for Placental Diffusion MRI1Centre for Medical Image Computing and Department of Computer Science, University College London, London, United Kingdom, 2Centre for the Developing Brain, King's College London, London, United Kingdom, 3Biomedical Engineering Department, Division of Imaging Sciences, King's College London, London, United Kingdom
Synopsis
Diffusion MRI (dMRI) has the potential to assess placental microstructure and microcirculation in-vivo, and hence provide insight into conditions such as fetal growth restriction and pre-eclampsia. The utility of dMRI data depends heavily upon the choice of b-values and gradient directions, although these choices have to be weighed against scanning time restrictions. To address these issues, we developed an organ-specific, data-driven, clinically-viable protocol for placental dMRI. This optimised protocol compares favourably with a naive protocol of comparable scan time.
Introduction
Diffusion MRI (dMRI) is emerging as a promising tool for evaluation of the in-vivo human placenta. However, the utility of information extracted with dMRI depends on the gradient directions and b-values (or “gradient table”). In other abdominal organs, data-driven, tissue-specific optimisation of dMRI scanning parameters has been demonstrated1–3, but no placenta-specific dMRI protocols have been developed.
Here, we present a specific dMRI gradient table designed using pilot data obtained from 9 exploratory in-vivo human placenta examinations. We scanned a single subject with this protocol and, for comparison, a naive protocol of similar length.
Methods
Our approach is as follows: we optimise b-values by combining the approaches in4 and5, then optimise gradient directions following6.
The b-value optimisation is guided by results gained using a naive, exploratory protocol7, designed to assess which models best explain the placental dMRI signal. The microstructural model that proved most descriptive for analysis of this pilot data was “zeppelin-zeppelin” (named using the terminology in8). This is a two-compartment model which allows for anisotropy in both fast- (associated with perfusion) and slow- (primarily associated with diffusion) attenuating signal components. The normalised zeppelin-zeppelin dMRI signal is given by $$S(b) = f \exp(-b \mathbf{G^T} \mathbf{D_p} \mathbf{G}) + (1-f) \exp(-b \mathbf{G^T} \mathbf{D} \mathbf{G}) $$ where $$$\mathbf{D_p}$$$ and $$$\mathbf{D}$$$ are cylindrically symmetric tensors (i.e. “zeppelins”), representing perfusion and diffusion compartments respectively, $$$f$$$ is the perfusion fraction, $$$b$$$ is the b-value, and $$$\mathbf{G}$$$ is the gradient direction. Given the zeppelin-zeppelin model, we applied experimental design optimisation4, assuming an imaging scheme with a fixed number of gradient shells (12) and measurements per shell (3), and hence obtained optimised b-values for these shells.
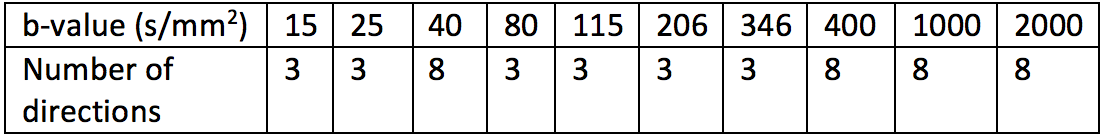
To increase angular resolution, and therefore sensitivity to anisotropy, we added additional dMRI volumes at key b-values. These b-values were calculated following reference5, using perfusion and diffusion compartment diffusivity estimates from7. For the diffusion compartment we estimated the ideal b-value as 800 s/mm2. The perfusion compartment pseudo-diffusivity, and therefore the ideal b-value, varies between the placenta and uterine wall. We therefore added additional volumes at both b=18 s/mm2 and b=36 s/mm2. Table 1 shows the final optimised dMRI b-values.
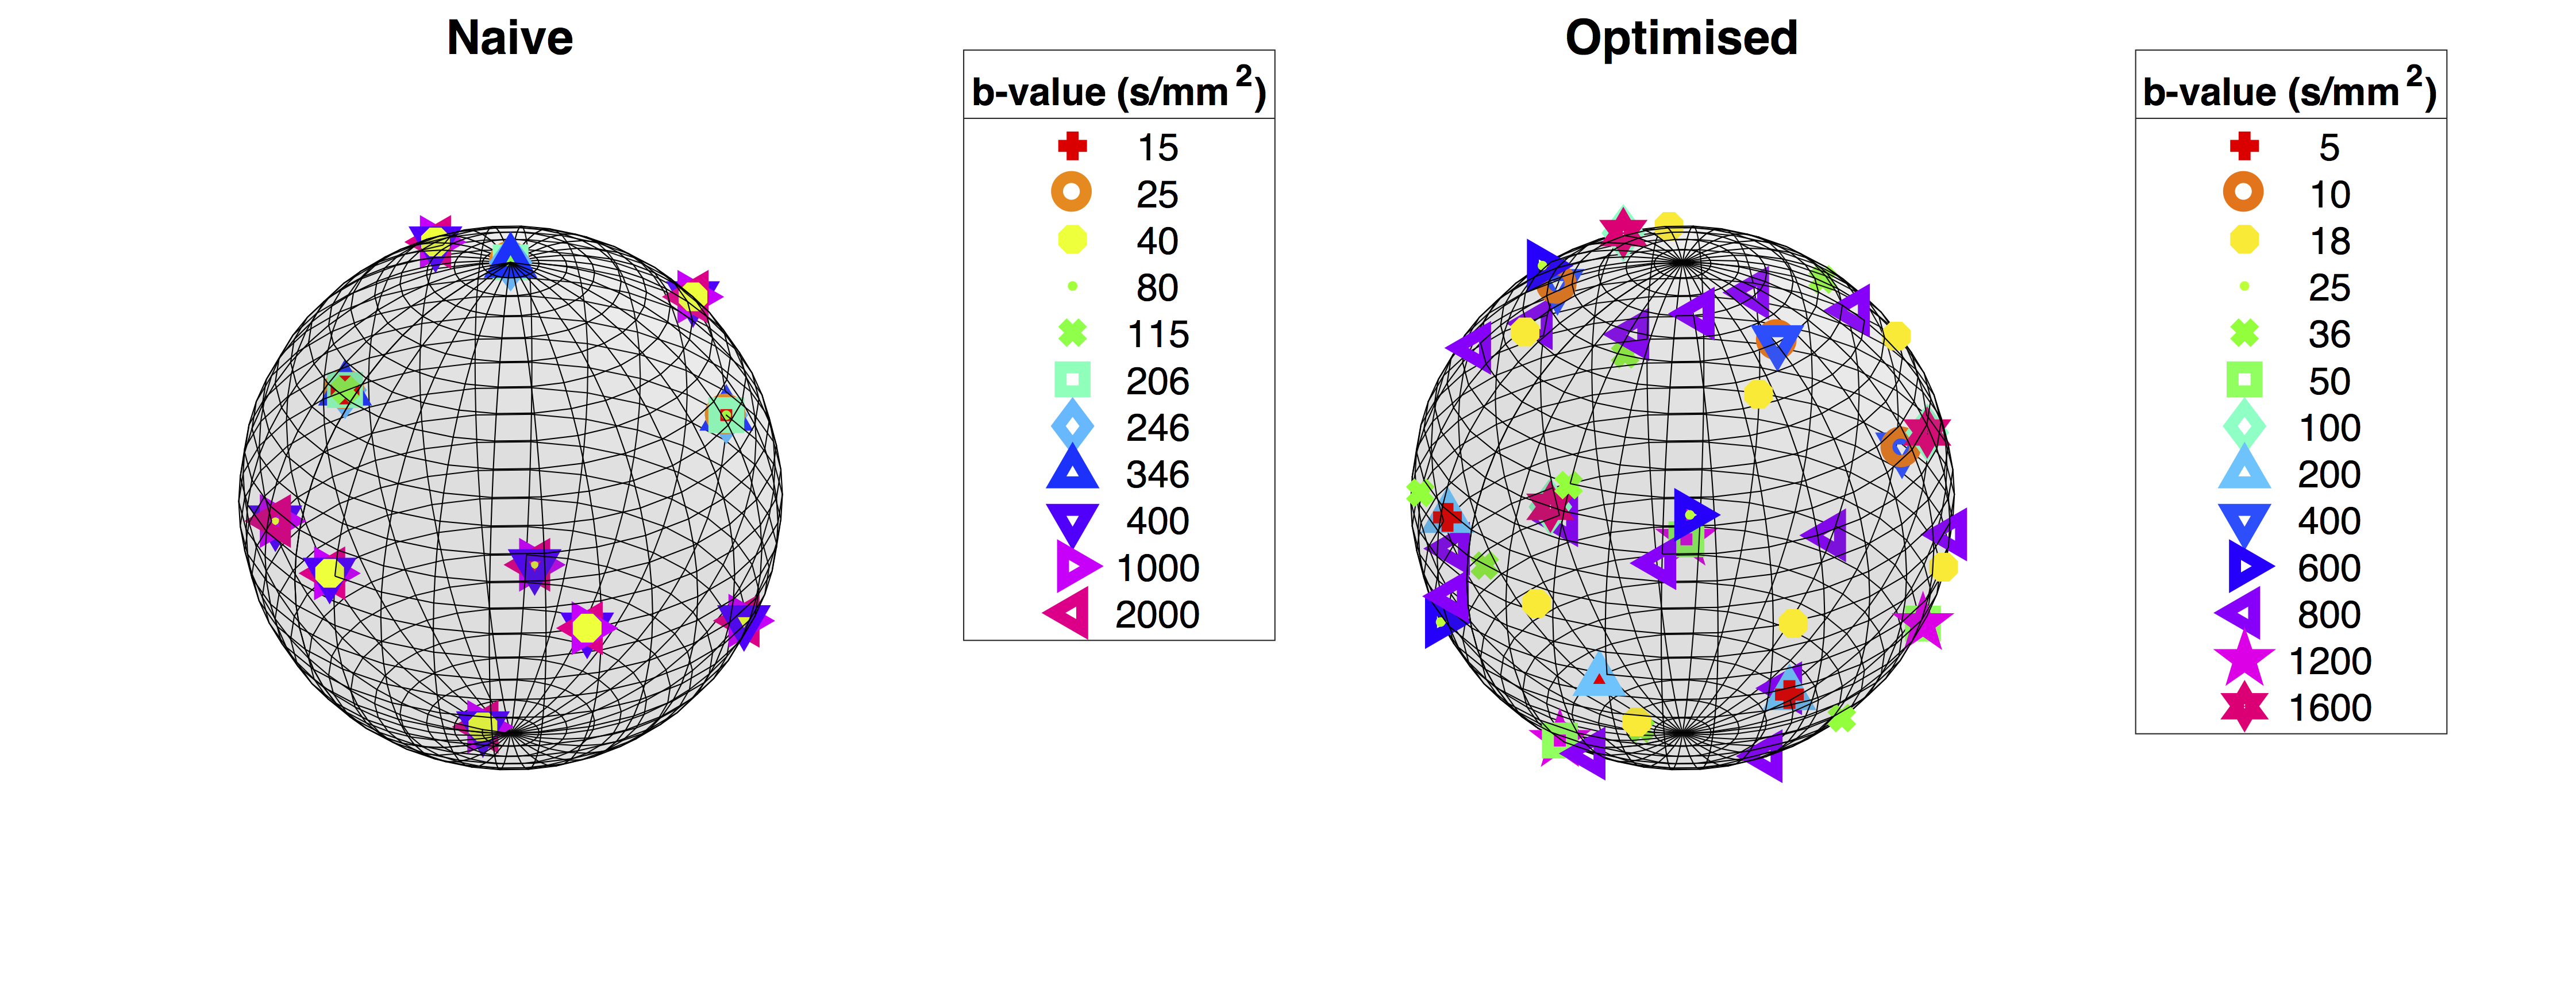
Finally, we optimised gradient directions jointly across shells to maximise the angular resolution of measurements, following the method in6. We present a visualisation of gradient directions, for both the optimised and aforementioned naive protocol, in Figure 2.
We scanned a single healthy pregnant subject, gestational age 34 weeks 1 day, using the optimised gradient table on a 3T Philips Achieva scanner with a 32-channel cardiac coil. Six interleaved b=0 images were obtained (65 dMRI volumes in total). The other acquisition parameters were as follows: 2 mm isotropic resolution, TE=95 ms, TR=7.5 s, FOV=352x352x96 mm3, 48 contiguous coronal slices, scan time 8 minutes 8 seconds.
For comparison, we also scanned the same subject with the naive protocol (b-values in Table 3). Other acquisition parameters were: 2.2 mm isotropic resolution, TE=129 ms, TR=8 s, FOV=352x352x77 mm3, 35 contiguous coronal slices, 59 dMRI volumes, scan time 7 minutes 52 seconds. The two scans were performed immediately after each other.
For both scans we fit the zeppelin-zeppelin model voxel-by-voxel to the normalised dMRI signal (hence avoiding T2 dependence), assuming a Rician noise model8,9. We also fit the diffusion tensor to the full set of dMRI volumes using the MRtrix3 function dwi2tensor10.
Results
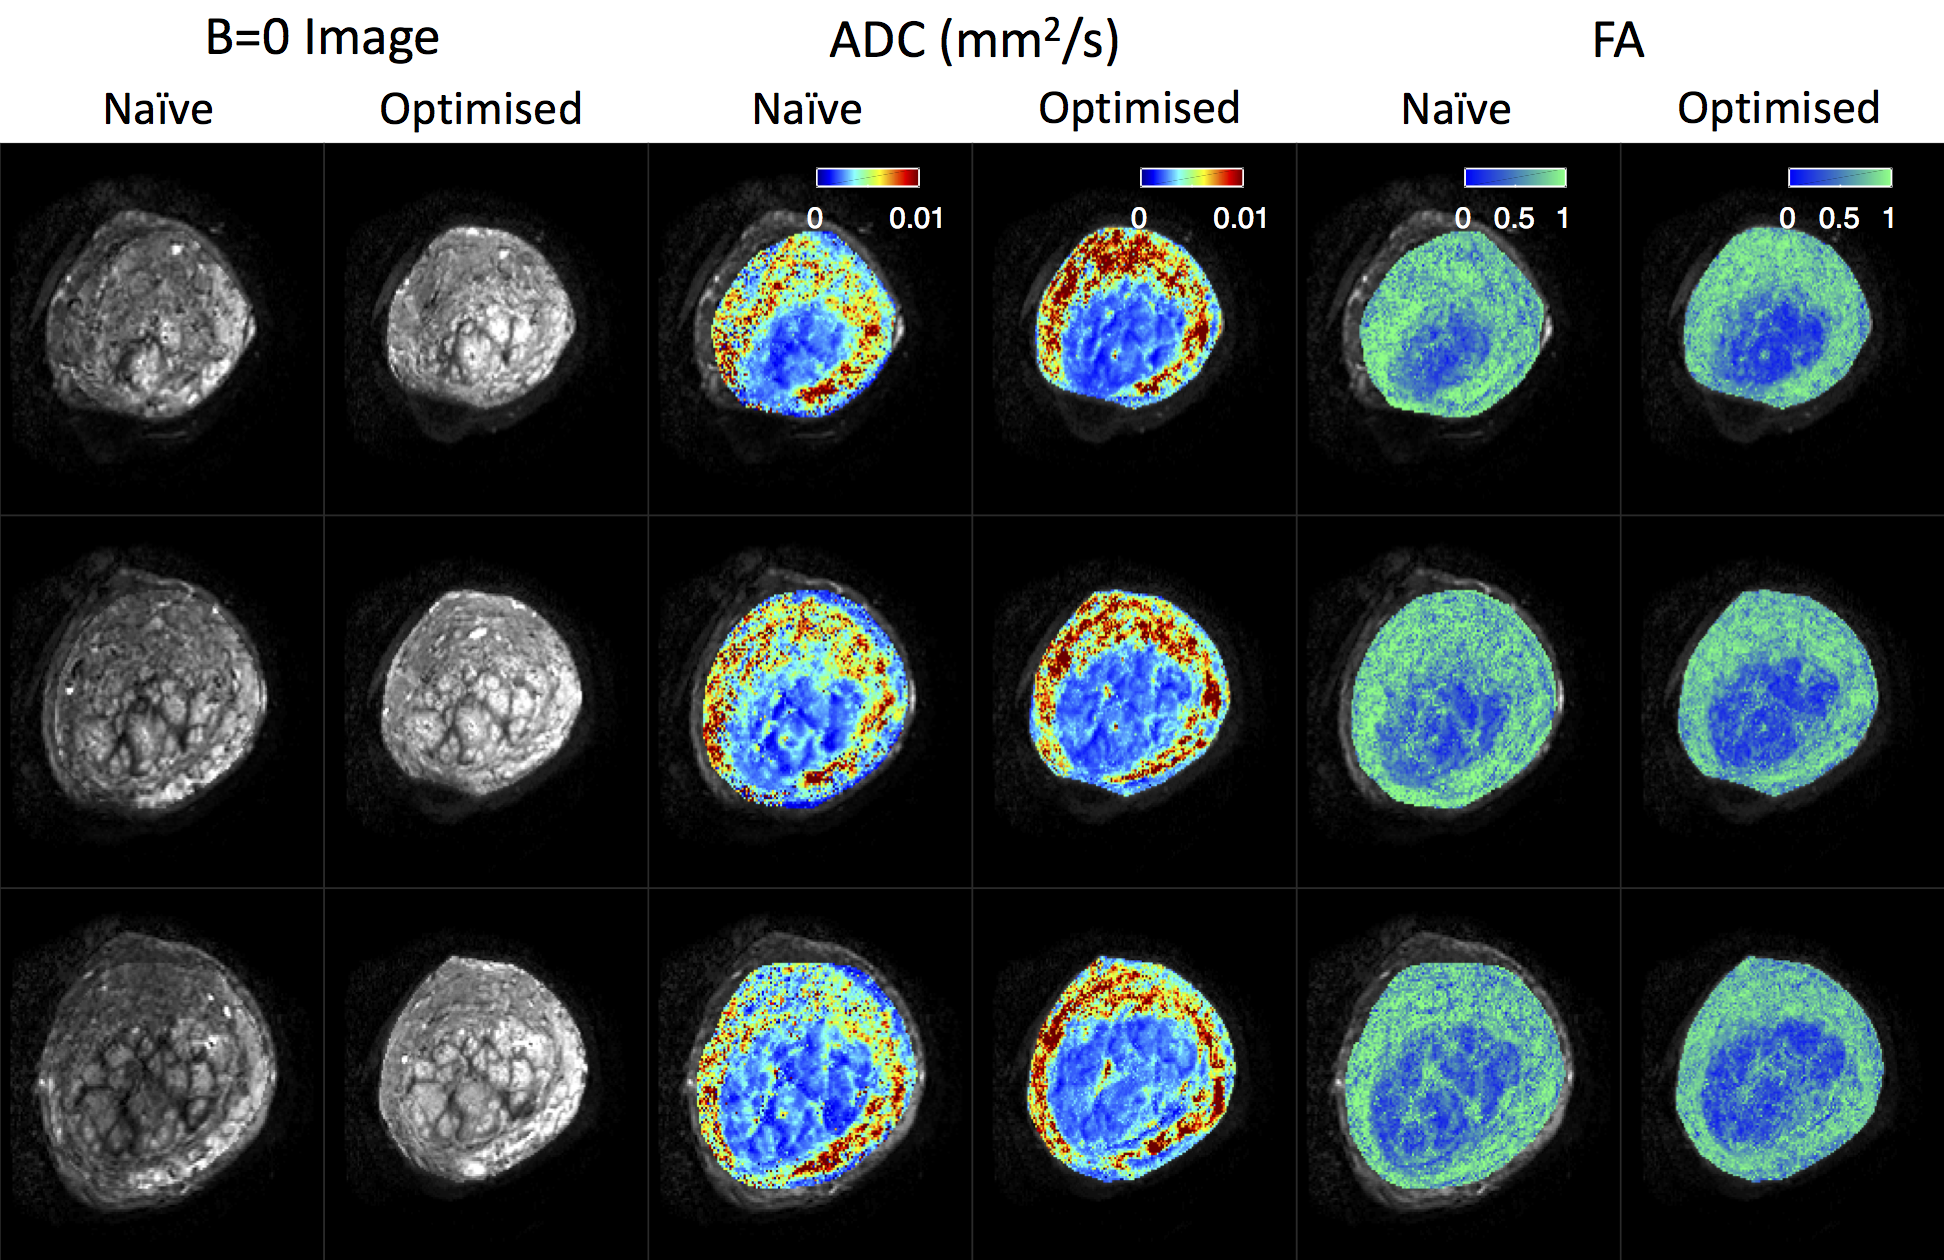
Figure 4 displays b=0 images, ADC maps, and FA maps for both protocols. Parameter maps are noticeably improved for the optimised protocol: the lobular structure is more prominent, and noise is reduced. Optimised maps also more clearly delineate the inner circular structures in columns 3-6. These presumably show the boundary between the placenta and uterine wall, so these maps may have applications in placenta segmentation. In agreement with previous observations7, we see high ADC and high FA in the uterine wall.
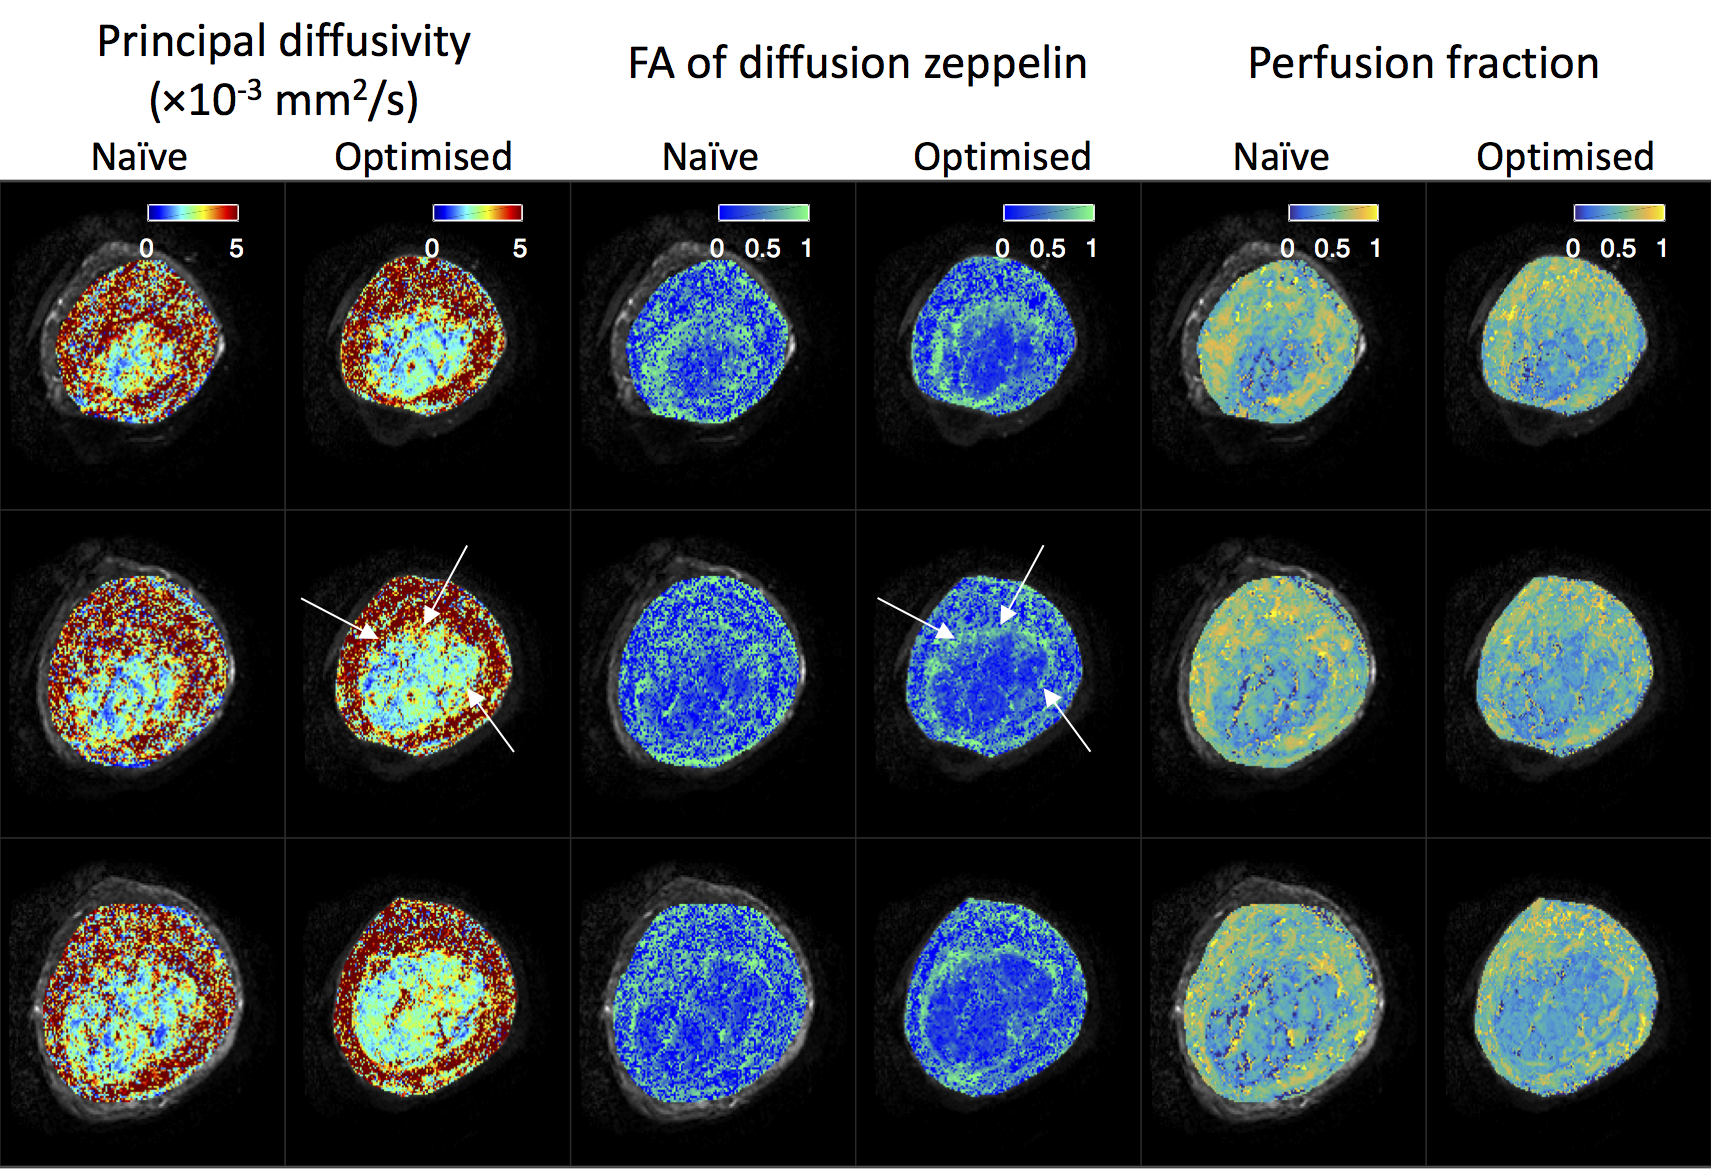
Figure 5 shows parameter maps derived from zeppelin-zeppelin model fits. The optimised protocol maps show greater contrast between structures, e.g. the placental boundary in columns 1-4 (white arrows), and less noisy appearance within homogenous regions.
Discussion and Conclusion
These results show the benefits of a comprehensive, data-driven, organ-specific, approach to dMRI protocol design. By separately optimising b-values and gradient directions, we can focus measurements at the ideal shells, and maximise angular resolution across these shells.
The scan times of both protocols are comparable, hence there is no time barrier to choosing the optimised protocol. This pipeline could be adapted to different scan time limitations by reducing the assumed number of dMRI volumes when optimising.
We anticipate that improved protocols are more likely to be sensitive to microstructural and microcirculatory changes in pathological placentas. This ultimately increases the likelihood of translating placental dMRI research into quantitative biomedical imaging applications.
Acknowledgements
This work is part of the NIH-funded Placenta imaging Project: project number 1U01HD087202-01. Jana Hutter received funding from the Wellcome Trust (Sir Henry Wellcome Fellowship, 201374/Z/16/Z). Daniel Alexander and Andrada Ianus received funding from the EPSRC (grants N018702, M020533 and grant M507970 respectively).References
1. Zhang, J. L., Sigmund, E. E., Rusinek, H., Chandarana, H., Storey, P., Chen, Q. & Lee, V. S. Optimization of b-value sampling for diffusion-weighted imaging of the kidney. Magn. Reson. Med. 67, 89–97 (2012).
2. Leporq, B., Saint-Jalmes, H., Rabrait, C., Pilleul, F., Guillaud, O., Dumortier, J., Scoazec, J.-Y. & Beuf, O. Optimization of intra-voxel incoherent motion imaging at 3.0 Tesla for fast liver examination. J. Magn. Reson. Imaging 41, 1209–1217 (2015).
3. Freiman, M., Voss, S. D., Mulkern, R. V., Perez-Rossello, J. M., Callahan, M. J. & Warfield, S. K. In vivo assessment of optimal b -value range for perfusion-insensitive apparent diffusion coefficient imaging. Med. Phys. 39, 4832–4839 (2012).
4. Alexander, D. C. A general framework for experiment design in diffusion MRI and its application in measuring direct tissue-microstructure features. Magn. Reson. Med. 60, 439–448 (2008).
5. Jones, D. K., Horsfield, M. A. & Simmons, A. Optimal strategies for measuring diffusion in anisotropic systems by magnetic resonance imaging. Magn. Reson. Med. 42, 515–525 (1999).
6. Caruyer, E., Lenglet, C., Sapiro, G. & Deriche, R. Design of multishell sampling schemes with uniform coverage in diffusion MRI. Magn. Reson. Med. 69, 1534–40 (2013).
7. Slator, P. J., Hutter, J., McCabe, L., Santos Gomes, A. Dos, Price, A. N., Panagiotaki, E., Rutherford, M. A., Hajnal, J. V. & Alexander, D. C. Quantifying Placental Microcirculation and Microstructure with Anisotropic IVIM Models. Placenta 57, 290–291 (2017).
8. Panagiotaki, E., Schneider, T., Siow, B., Hall, M. G., Lythgoe, M. F. & Alexander, D. C. Compartment models of the diffusion MR signal in brain white matter: A taxonomy and comparison. Neuroimage 59, 2241–2254 (2012).
9. Ferizi, U., Schneider, T., Witzel, T., Wald, L. L., Zhang, H., Wheeler-Kingshott, C. A. M. & Alexander, D. C. White matter compartment models for in vivo diffusion MRI at 300mT/m. Neuroimage 118, 468–483 (2015).
10. Veraart, J., Sijbers, J., Sunaert, S., Leemans, A. & Jeurissen, B. Weighted linear least squares estimation of diffusion MRI parameters: Strengths, limitations, and pitfalls. Neuroimage 81, 335–346 (2013).
Figures