4567
Proton Spectroscopy of the Human Placenta In-Utero to Establish Normal Ranges Throughout Gestation1Edinburgh Imaging, University of Edinburgh, Edinburgh, United Kingdom, 2MRC Centre for Inflammation Research, University of Edinburgh, Edinburgh, United Kingdom, 3BHF Centre for Cardiovascular Sciences, University of Edinburgh, Edinburgh, United Kingdom, 4MRC Centre for Reproductive Health, University of Edinburgh, Edinburgh, United Kingdom
Synopsis
For magnetic resonance proton spectroscopy to be of potential future use in investigating placental dysfunction in-utero, a normal range of detectable metabolites is required. Seventy-seven healthy pregnant women with an uncomplicated singleton pregnancy were scanned between 20 and 40 week's gestation. Robust quality assurance removed compromised data and spectra were quantified for the commonly observed peaks and metabolites expected in the placenta. A characteristic spectrum was observed, which was independent of gestational age. Quantification of this technique in terms of the expected results and their variability will inform future studies and suggest technical improvements that may be useful.
Introduction
Placental dysfunction is associated with several fetal developmental disorders, including stillbirth1 and intra uterine growth retardation2. Magnetic resonance proton spectroscopy (1H-MRS) has been used to investigate placental physiology in-utero in a small number of studies3,4,5. The next step towards the wider use of this technique in research and eventually clinical practice is the establishment of normal results expected from a spectrum obtained from a healthy placenta. We aimed to 1) establish a normal 1H MRS spectrum and 2) investigate the impact of gestational age on the spectrum.Methods
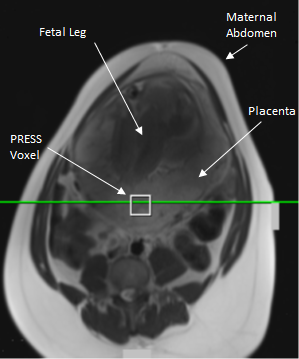
1H-MRS data were obtained in seventy-seven healthy women with an uncomplicated singleton pregnancy between 20-40 weeks’ gestation. Imaging was carried out on a 3 T Verio scanner (Siemens, Erlangen, Germany) using the body and spine matrix coils. Women were imaged at a left lateral tilt to avoid vena cava compression, with blood pressure monitored, scanning was limited to 45 minutes and SAR to normal mode. A 2 cm3 voxel in the placenta, unlikely to be contaminated with maternal tissue or amniotic fluid was selected (Figure 1). An iterative semi-automatic shimming routine was applied to achieve a water peak full width half-maximum of 30 Hz or less and single-voxel point-resolved spectroscopy (PRESS) was carried out with TE/TR 30/1500 ms, 96 averages, bandwidth 2000 Hz and water suppression of 50 Hz.
A robust quality assurance (QA) process was applied to remove spectra contaminated by non-placental tissue, maternal/fetal motion or where shimming failed. This multi-stage process checked for contamination and signal to noise ratio (SNR) prior to analysis. Results were checked for the fit quality and the uncertainty of the amplitude values. Some fits were repeated and individual peaks excluded from a few volunteers.
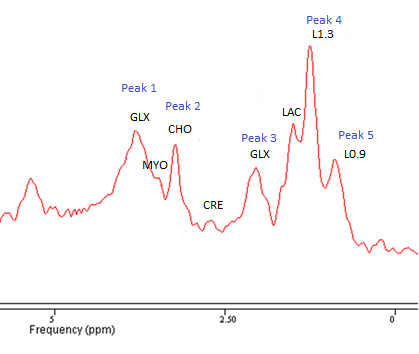
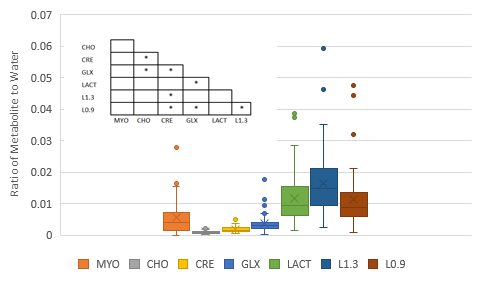
Data was fitted with jMRUI6 (version 5.2) using two inbuilt algorithms: AMARES7 which fits single peaks, possibly containing multiple metabolites, using data driven prior knowledge and QUEST8 where a simulated data set of the expected metabolites, based on the acquisition parameters, is the prior knowledge. An example spectrum following smoothing and removal of the water is shown in Figure 2 with peak and metabolite locations indicated. The primary peaks visible within spectra are Choline (Peak 2, CHO), Lipid resonances at 1.3 and 0.9 ppm (Peak 4, L1.3 & Peak 5, L0.9) and the two resonances of the Glutamate/Glutamine complex (Peak 1 & 5, GLX)9. The QUEST algorithm used these metabolites and others expected in the placenta, Creatine (CRE)10, Myo-instol (MYO)11 and Lactate (LAC)12 as prior knowledge.
The five AMARES peaks and seven QUEST metabolites amplitudes were normalised to the water peak amplitude, calculated using AMARES. The relationship of these ratios to gestational age and the other ratios in the spectrum was investigated. Correlations were tested with a 2-tailed Spearman’s Signed Rank Test and variability of the loss rate at different gestation checked with a Student's T-test.
Results
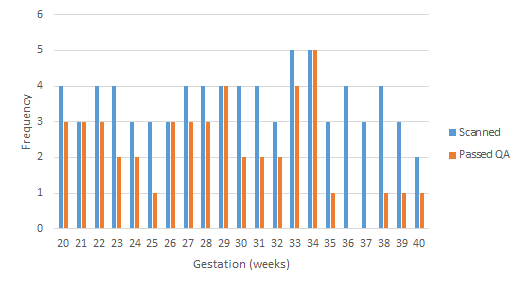
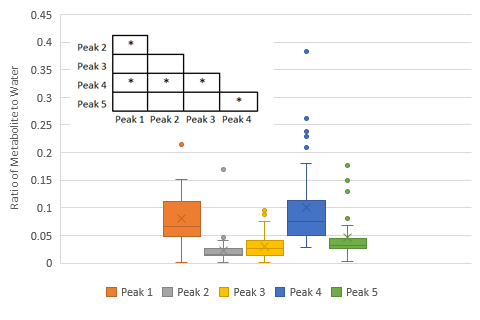
From seventy-seven data sets, forty-six (60%) passed the QA process: seventeen (22%) were removed for contamination and fourteen (18%) for low SNR. More data was rejected later in gestation, after 35 weeks, P < 0.05 (Figure 3). There was no correlation between any of the peaks/metabolites tested and gestation, P > 0.05. Scatter plots were generated for the AMARES peaks (Figure 4) and the QUEST metabolites (Figure 5). In both cases, significant correlations between peaks/metabolites are indicated by * (Table insert for Figures 4 & 5, p<0.05).Dicussion
The lack of any change during gestation indicates that as expected in normal pregnancies the placenta is providing sustained functional support throughout. This result is less certain at late gestation because of the increased data loss due to maternal motion. This appears to be due to the reduced comfort of the volunteers in the scanner. As expected, there was less variability with AMARES due to the less complex fitting. However, QUEST is able to compensate for overlapping metabolites within an individual peak by fitting the expected resonances. Therefore QUEST may be more sensitive to changes in lower concentration metabolites. The differences between the normal spectra and spectra observed in placental dysfunction will determine which analysis is most appropriate. It may be that developments in acquisition, analysis or QA procedures are required to improve the sensitivity and accuracy of the measurements.Conclusions
A characteristic 1H-MRS spectrum has been reported for the placenta using two analysis methods with embedded robust QA processes. In healthy, uncomplicated singleton pregnancies, this characteristic spectrum does not appear to significantly change with gestation. This spectrum should be verified in larger numbers, and may be of use in future comparative studies investigating 1H-MRS of the placenta in compromised pregnancies.Acknowledgements
We would like the thank Tommy’s for funding this study, the radiographers at Edinburgh Imaging who conducted the scanning, the midwives at the MRC Centre for Reproductive Health in Edinburgh for recruiting the volunteers and all the women who participated. This imaging research project was carried out at the Edinburgh Imaging Facility (RIE) (www.ed.ac.uk/edinburgh-imaging), University of Edinburgh, which is part of the SINAPSE collaboration (www.sinapse.ac.uk), funded by the Scottish Funding Council & the Chief Scientist Office.References
1. Heazell H, Abnormalities of the Placenta. BMC Pregnancy and Childbirth 2012; 12(suppl. 1): A2.
2. Sibley CP, Turner MA, Cetin I et al. Placental phenotypes of intrauterine growth. Pediatr. Res. 2005; 58(5): 827-832.
3. Dension FC, Semple SIK, Stock SJ, et al. Novel use of proton magnetic resonance spectroscopy (1HMRS) to non-invasively assess placental metabolism, PLoS One 2012; 7(8); e42926.
4. Macnaught G, Gray C, Walker J, et al. 1H MRS: a potential biomarker of in utero placental function. NMR Biomed. 2015; 28:1275-1282.
5. F Song, Wu W, Qina Z, et al. Assessment of the Placenta in Intrauterine Growth Restriction by Diffusion-Weighted Imaging and Proton Magnetic Resonance Spectroscopy: A Pilot Study. Reprod Sci. 2017; 24(4):575-581
6. Stefan D, Cesare F Di, Andrasescu A, et al. Quantitation of magnetic resonance spectroscopy signals: the jMRUI software package. 2009; Meas. Sci. Technol. 20: 104035 7.
7. Vanhamme L, van den Boogaart A & Van Huffel S. Improved method for accurate and efficient quantification of MRS data with use of prior knowledge. J. Magn. Reson. 1997; 129(35): 35–43.
8. Ratiney H, Sdika M, Coenradie Y, et al. Time-domain semi-parametric estimation based on a metabolite basis set. NMR Biomed. 2005; 18(1): 1–13.
9. Mazzei P, Piccoloa A, Nugnesc L, et al. Metabolic profile of intact tissue from uterine leiomyomas using high-resolution magic-angle-spinning 1H NMR spectroscopy NMR Biomed. 2010; 23: 1137–1145.
10. Ellery SJ, Della Gatta PA, Bruce CR, et al. Creatine biosynthesis and transport by the term human placenta. Placenta. 2017; 52: 86-93
11. Dessì A & Fanos V. Myoinositol: A new marker of intrauterine growth restriction? J Obstet Gynaecol, 2013; 33(8): 776-780.
12. Glazier JD, Cetin I, Perugino G, et al. Association between the activity of the system A amino acid transporter in the microvillous plasma membrane of the human placenta and severity of fetal compromise in intrauterine growth restriction. Pediatr Res. 1997; 42(4):514-9.
Figures